Abstract
Background
The mechanical environment of the aortic valve (AV) has a significant impact on valve cellular biology and disease progression, but the regional variation in stretch across the AV leaflet is not well understood. This study, therefore, sought to quantify the regional variation in dynamic deformation characteristics of AV leaflets in the native mechanical environment in order to link leaflet stretch variation to reported AV calcification patterns.
Methods
Whole porcine AVs (n=6) were sutured into a physiological left-heart simulator and subjected to pulsatile and physiologically normal hemodynamic conditions. A grid of ink dots was marked on the entire ventricular surface of the AV leaflet. Dual camera stereo photogrammetry was used to determine the stretch magnitudes across the entire ventricular surface over the entire diastolic duration.
Results
Elevated stretch magnitudes were observed along the leaflet base and coaptation line consistent with previously reported calcification patterns suggesting the higher mechanical stretch experienced by the leaflets in these regions may contribute to increased disease propensity. Transient stretch overloads were observed during diastolic closing, predominantly along the leaflet base, indicating the presence of a dynamic fluid hammer effect resulting from retrograde blood flow impacting the leaflet. We speculate the function of the leaflet base is to act in cooperation with the sinuses of Valsalva to dampen the fluid hammer effect and reduce stress levels imparted on the rest of the leaflet.
Keywords: Aortic Valve Mechanics, Regional Leaflet Mechanics, Stretch Ratio Mapping, Fluid Hammer Effect, Spatial Variation, Solid Mechanics
1. Introduction
The aortic valve (AV) is a dynamic structure exposed to a harsh mechanical environment of transvalvular pressure, cyclic flexure, and axial, bending and shear stress (Sacks and Yoganathan, 2007; Stella et al., 2007; Thubrikar, 1990). It is well documented that the mechanical environment significantly impacts valve cellular biology and is thought to contribute to AV disease onset and progression (Liu et al., 2007; Otto, 2008), though the biomechanical mechanisms are yet to be clearly defined. Altered or non-physiological stretch levels in AV leaflets have been shown to trigger patho-biological responses consistent with calcific AV disease (Balachandran et al., 2006; Balachandran et al., 2009; Merryman et al., 2007). Comprehensive characterization of the native AV leaflet stretch distribution, therefore, may provide a link to explain the observed leaflet calcification patterns and help to more accurately define the mechanism of AV disease pathogenesis.
Characterization of strain mechanics of the native aortic valve has been undertaken by several authors (Adamczyk and Vesely, 2002; Billiar and Sacks, 2000; Christie and Barratt-Boyes, 1995; Stella and Sacks, 2007; Vesely and Noseworthy, 1992). However, these studies were all conducted on partial valve explants or other idealized setups rather than using the whole aortic root in its native mechanical environment, thus it is unclear how the results of such studies translate to native valve characteristics. To characterize AV mechanics in the native AV environment, our group investigated the time-varying stretch characteristics of specific points of the aortic valve using an in-vitro valve model (Yap et al., 2010). Native aortic valve leaflet stretch was characterized over the entire cardiac cycle, but the study was limited to reporting only one localized stretch value for the leaflet per time point, and did not provided spatial stretch information over the leaflet surface. The local mechanical environment of different leaflet regions could vary significantly, and such regional variations in mechanical properties could explain the reason for localization of AV calcification patterns at specific regions of the leaflet: the base and along the line of cusp coaptation (Thubrikar et al., 1986). To date, however, no studies have reported on regional differences in native AV leaflet mechanics with dynamic data.
In the current study, therefore, we report the regional differences in dynamic deformation characteristics of the native AV leaflet and its variation across the leaflet surface over the course of diastole. Based upon the specific patterns of calcification and the large body of work in the literature showing regional differences in leaflet structure and mechanical properties (Doehring et al., 2005; Sacks et al., 2009), it is expected that heterogeneous stretch patterns will be observed across the leaflet and that these stretch patterns will be dynamic over the course of diastole.
2. Materials and Methods
An in-vitro approach to examine the stretch mechanics of the native AV was used for the present study due to the superior resolution offered by this approach compared to in-vivo setups (Iyengar et al., 2001) and the ability to precisely control flow and pressure conditions. In-vitro solid mechanics studies of the AV using a mock flow loop, have been used extensively by several groups (Billiar and Sacks, 2000; Gao et al., 2002) for these reasons.
Valve Preparation
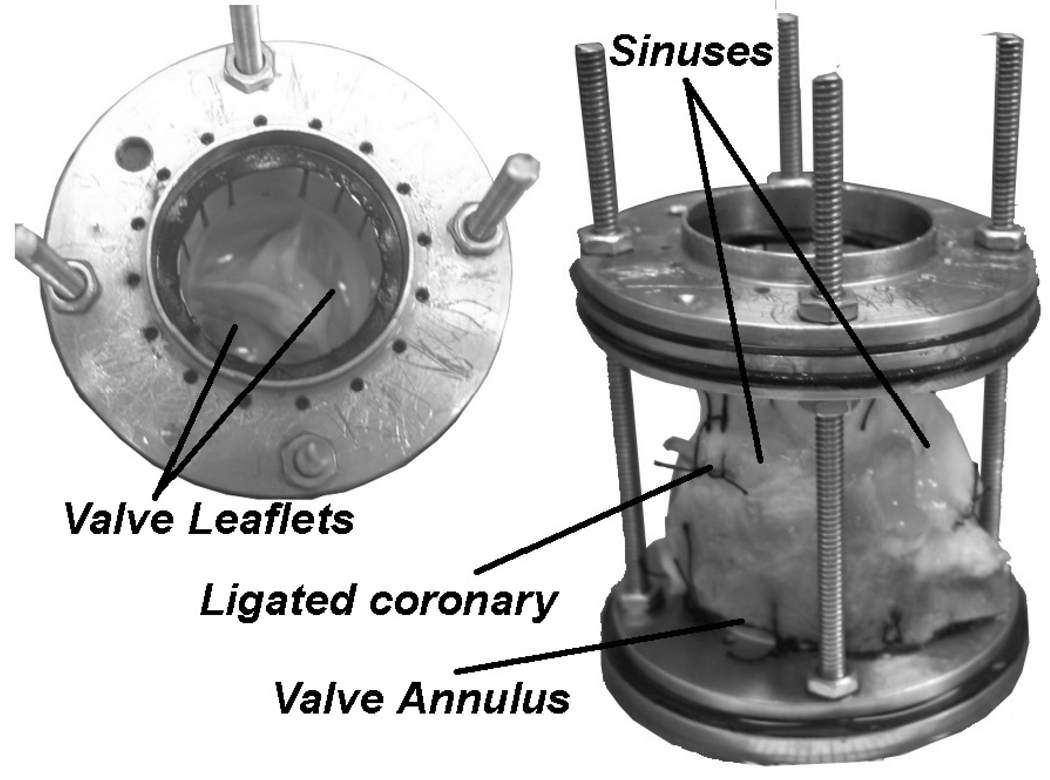
Six fresh porcine hearts (n=6) were used for this study. The aortic roots were excised and mounted as shown in Figure 1 and described in detail in a previous publication (Yap et al., 2010). The mounting mechanism allowed sufficient sinus and annular deformation freedom: the valve was chosen to be undersized relative to the suturing metal rings so that passive expansion under the mean arterial pressure would not be restricted, and the aortic root was sutured to the lower supporting ring 10–15 mm below the annulus to allow annular motion in passive response to pressure changes.
Figure 1. Aortic Valve Model.
The aortic valve was sutured into a holding device to preserve the valve dimensions during experimentation. The inner diameter of the rings were 25mm and the rods were adjusted to a length that provided slight axial tension on the aorta to ensure proper leaflet coaptation geometry and avoid leaflet prolapse. This holding device was inserted into the flow loop to perform the experiments.
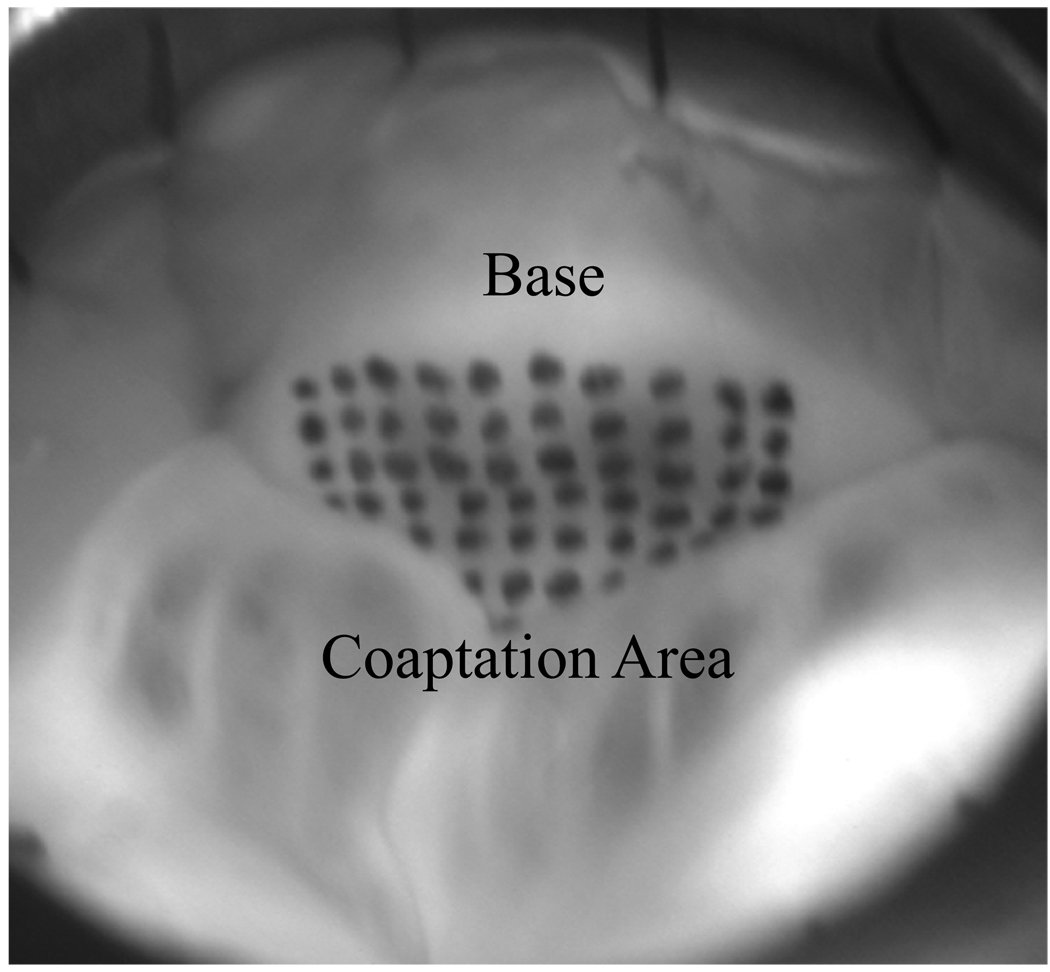
The ventricular leaflet surface was marked with a grid of ink dots (Black Shandon® Tissue Marking Dye, Thermoelectron Corporation, Pittsburgh, PA) that covered the entire ventricular surface of the leaflet during diastole as shown in Figure 2. 48 dots (8x6 array) were marked on the leaflet surface with 2mm inter-marker spacing covering approximately 192 mm2, however, coaptation geometry limited the number of visible dots during diastole to 42.
Figure 2. Ventricular View of Leaflet with Marker Grid.
The whole aorta was sutured into the flow loop such that the ventricular sides of the leaflets were visible to be photographed. The ventricular side of the non-coronary leaflet was marked with a grid of 48 markers using tissue marking dye but the coaptation geometry allowed only 42 visible markers.
Flow Loop Methodology
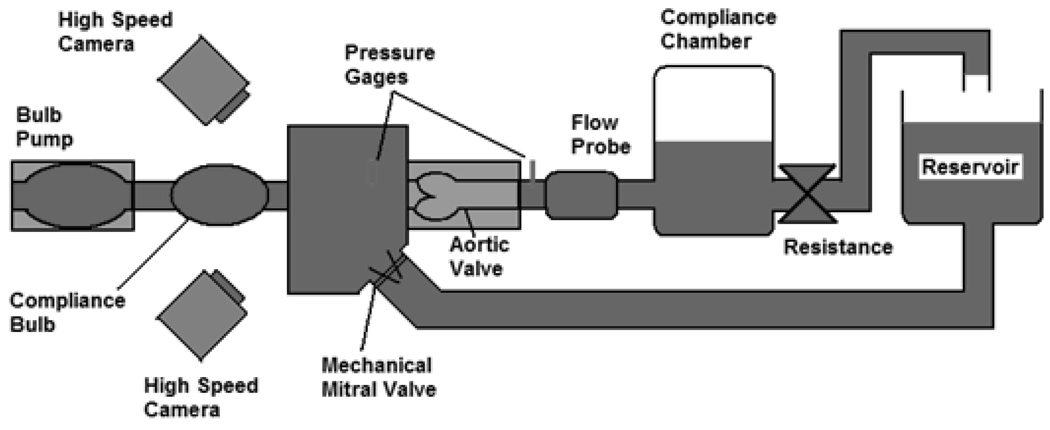
The AV valve model was secured in the Georgia Tech Left Heart Simulator shown in Figure 3, which is a flow loop designed to mimic pulsatile hemodynamic and flow conditions. Description for the flow loop setup was previously reported (Yap et al., 2010). The flow loop was set to maintain physiologically normal adult resting conditions: transaortic pressure of 120/80mmHg, heart rate of 70bpm and cardiac output of 5L/min. Flow was measured at 500Hz with a commercial ultrasonic flow probe (DP9-40, Validyne Engineering, Northridge, CA), and static pressures were measured through lateral holes on the ventricular chamber wall near the annulus and on the rigid aorta tubing wall, about 3 cm downstream of the sinotubular junction. Images of the valve were acquired using two high speed cameras (Yap et al., 2010).
Figure 3. Flow Loop Schematic Diagram.
This is a schematic of the Georgia Tech Left Heart Simulator used to subject the valves to the physiologically normal adult resting conditions: pressure of 120/80mmHg, a heart rate of 70bpm, and a cardiac output of 5L/min.
Reference State
The reference state was that resulting from the application of 1 mmHg aortic pressure, which was just sufficient to close the valve such that all markers could be imaged. Without this applied low pressure, the valve was too open to see all markers to quantify spatial variation of stretch ratios.
Surface Stretch Calculations
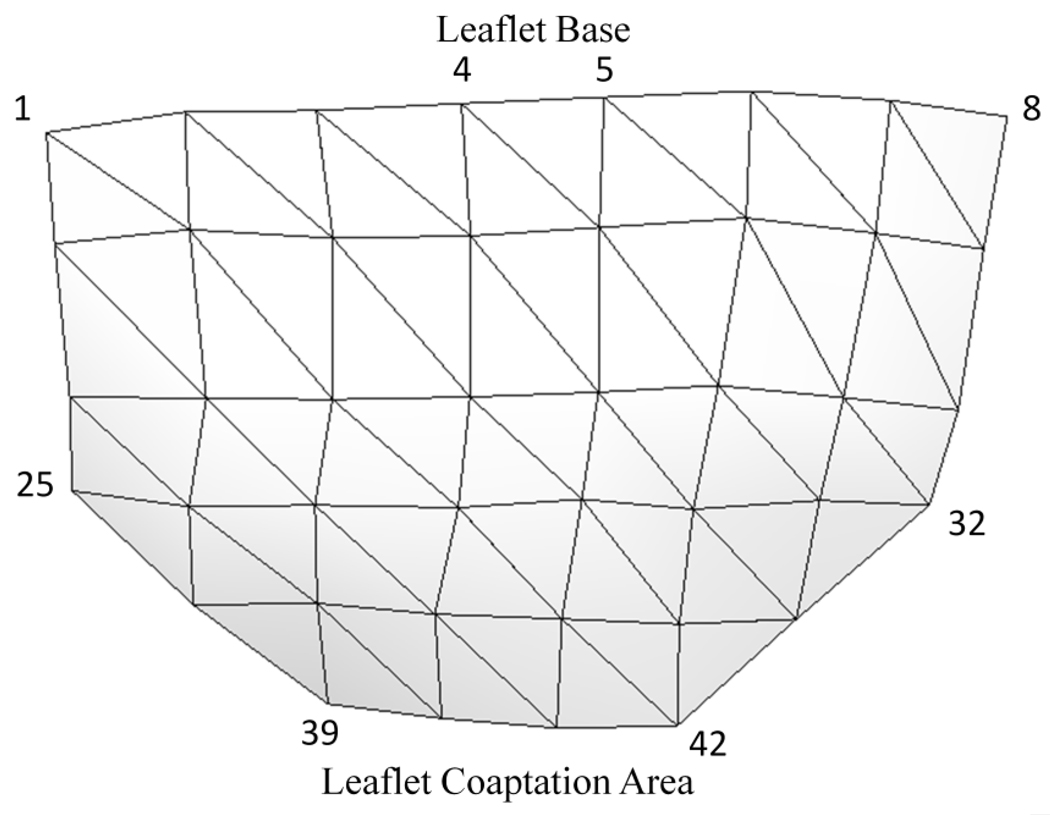
Images from the duration of diastole (approximately 340 frames or 680ms) were used to calculate surface stretch (leaflets were not sufficiently closed to provide view of all 42 markers during systole). A custom MATLAB software code and a custom MATHCAD program (PTC, Needham, MA) were used to compute the stretch field as reported previously (He et al., 2005; Padala et al., 2010; Sacks et al., 2006; Sacks et al., 2002; Yap 2010). In the process, the valve leaflets were meshed into 62 triangular elements using the 42 markers as vertices (Fig.4).
Figure 4. Schematic Diagram of 3D Digital Leaflet Mesh.
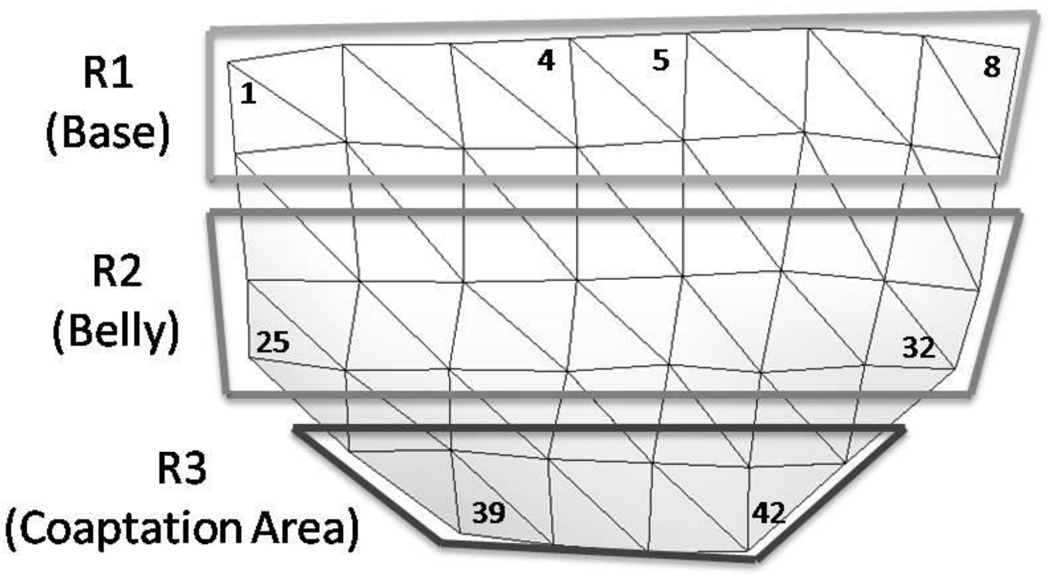
This mesh was created from the 3D leaflet marker coordinates. The top of the mesh corresponds to the base of the leaflet and the bottom of the mesh is the coaptation region. The numbers shown illustrate the pattern of leaflet marker numbering.
Statistical Methods
The data for each of the 42 points was averaged across the 6 valves to obtain average stretch magnitudes at the 42 locations, subsequently checked for normality using the Anderson-Darling Test, and analyzed for statistical significance using a paired t-test. P-values of less than 0.05 are reported.
3. Results
Surface Stretch Mapping
Stretch magnitudes were mapped over the ventricular surface of the leaflet for four distinct time points: early diastole, peak diastole, mid diastole, and late diastole. Early diastole was the first point during loading in which all 42 markers were visible, peak diastole was the point of peak transaortic pressure, mid diastole was the middle time point of diastole, and end diastole was the last point in unloading in which all 42 markers were visible. The leaflet was divided into three sub-regions shown in Figure 5 for ease of comparing stretch patterns in different areas: R1 (leaflet base), R2 (leaflet belly), and R3 (coaptation area).
Figure 5. Illustration of Regional Divisions on Leaflet Surface.
Stretch ratio values were averaged across these various regions for comparison to assess the general variation of stretch across the leaflet.
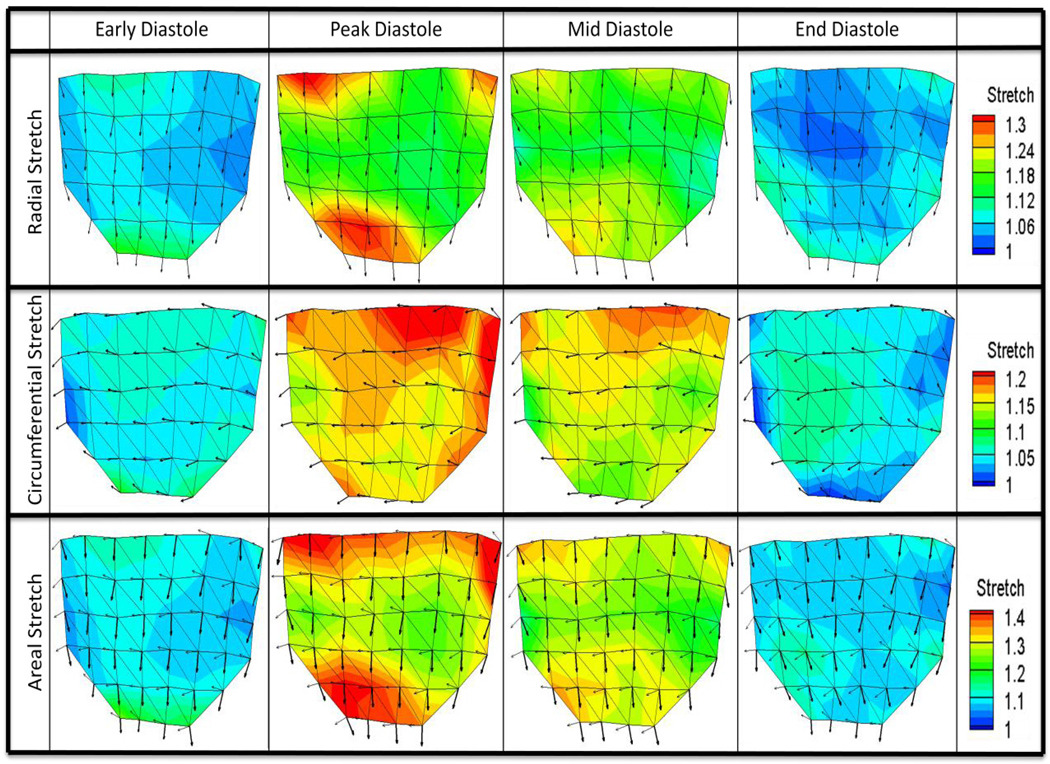
Figure 6 illustrates both the stretch magnitudes and principle stretch directions interpolated over the entire leaflet based on data at the 42 markers, for radial, circumferential, and areal stretch ratios at the four defined time points. It can be seen that the principle stretch directions were mostly uniform throughout diastole. The major and minor principle stretch directions aligned with the radial and circumferential directions, respectively. Figure 7 shows the spatially-averaged stretch magnitudes in the three regions at the four defined time points.
Figure 6. Surface Stretch Plots.
Stretch magnitudes as well as principle major and minor stretch vectors were calculated at 42 markers over the leaflet surface and averaged for n=6 valves to form one average data set. Plots here show regional variation of magnitude and direction of radial, circumferential, and areal stretch for four distinct time points: early diastole (beginning of loading phase), peak diastole (peak transvalvular pressure), mid diastole (middle time point of diastole), and late diastole (end of unloading phase). Radial stretch plots show principle major stretch vectors, circumferential stretch plots show principle minor stretch vectors, and areal stretch plots show both principle major stretch vectors (thick arrows) and principle minor stretch vectors (thin arrows).
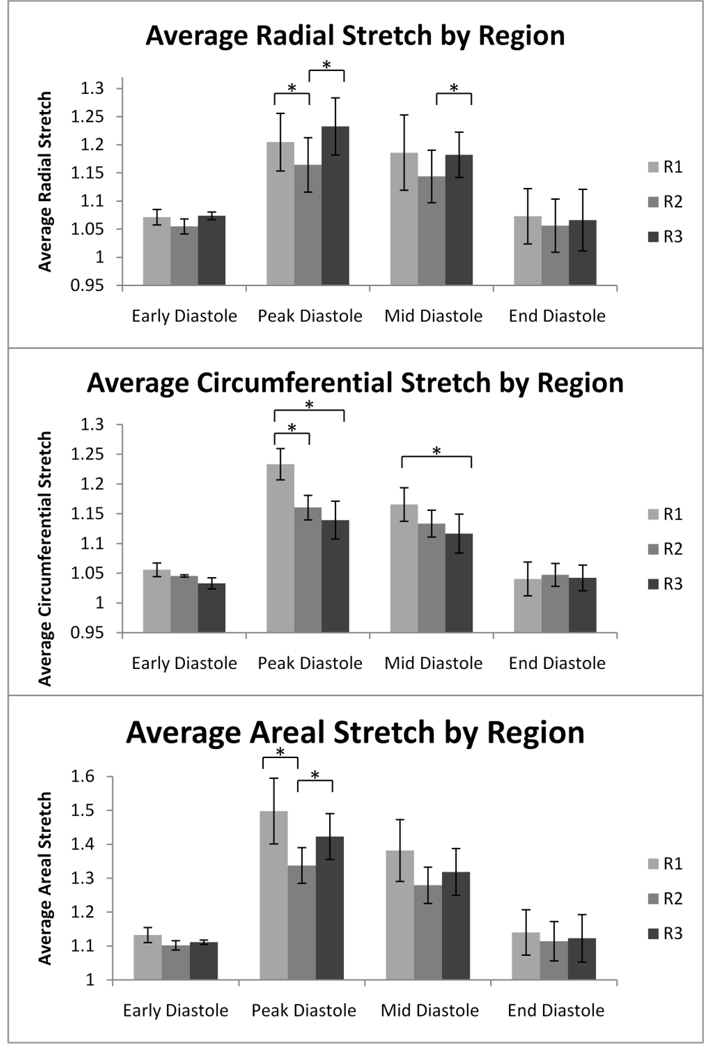
Figure 7. Average Stretch by Region.
Radial, circumferential, and areal stretch were averaged for each of the three regions in four separate time points in diastole. The scale is adjusted for radial, circumferential, and areal stretch to detailed variation in stretch. *=p<0.05. Error bars report standard error. n=6.
Early and late diastole were both characterized by relatively homogenous stretch distributions relative to peak and mid diastole with no significant differences between the three regions. Peak diastole, however, was marked by a significant heterogeneity in stretch magnitudes across the leaflet surface. The leaflet showed large radial stretch magnitudes spanning the base in the coaptation region. Radial stretch was significantly larger in regions R1 and R3 than R2 (p-values = 0.031 and 0.024, respectively). Circumferential stretch progressively decreased from very high stretch values at the base to lower stretch values at the coaptation line and was significantly larger in region R1 than in R2 and R3 (p-values=0.023 and 0.032, respectively). Areal stretch was very high along the leaflet base and in a large area along the coaptation line; regions R1 and R3 were significantly larger than R2 (p-values=0.041 and 0.029, respectively).
Mid diastole was characterized by a slight reduction in stretch magnitudes and less pronounced heterogeneity across the leaflet surface compared to peak diastole. Regions of higher radial stretch were concentrated along the base and in the coaptation region. Radial stretch was significantly larger in region R3 than R2 (p-value=0.048). Circumferential stretch magnitudes decreased from the base to the coaptation line. Region R1 was significantly larger than R3, but was not significantly different than R2 (p -value=0.041). Areal stretch was marked by a pattern of visibly higher stretch magnitudes at the base and at the coaptation line compared to the leaflet center; however, these differences were not statistically significant.
Transient Stretch Patterns
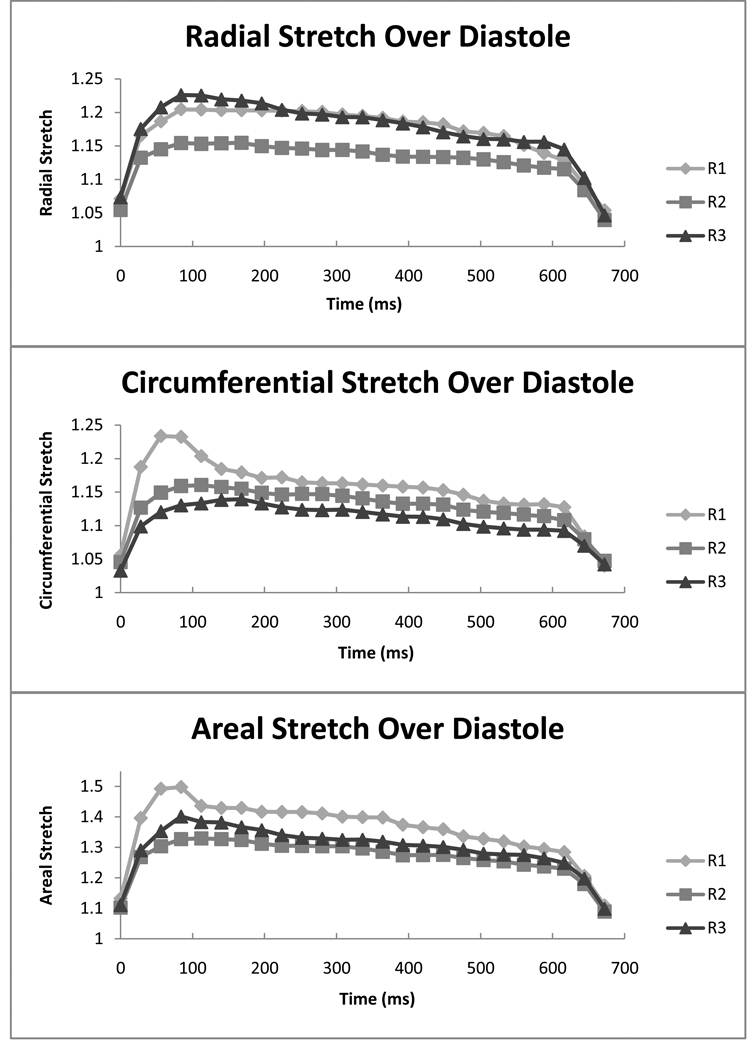
In Figure 8 the radial, circumferential and areal stretch magnitudes are plotted for the three regions at 25 time points spanning the duration of diastole. Radial stretch was characterized by transient high stretch values in region R3 during peak diastole, which decreased quickly. Similarly, circumferential stretch was characterized by a transient large stretch occurring during peak diastole in region R1. Areal stretch was characterized by a large transient stretch in region R1 occurring in peak diastole similar to the observed pattern for the circumferential stretch.
Figure 8. Regional Stretch Over Diastole.
Radial, circumferential, and areal stretch are reported at 25 time points over the course of diastole for each of the three regions. It can be seen that large transient stretch magnitudes are present in peak diastole for radial stretch in R3, circumferential stretch in R1, and areal stretch in R1. The scale is adjusted for radial, circumferential, and areal stretch to detailed variation in stretch. n=6.
Loading and Unloading Characteristics
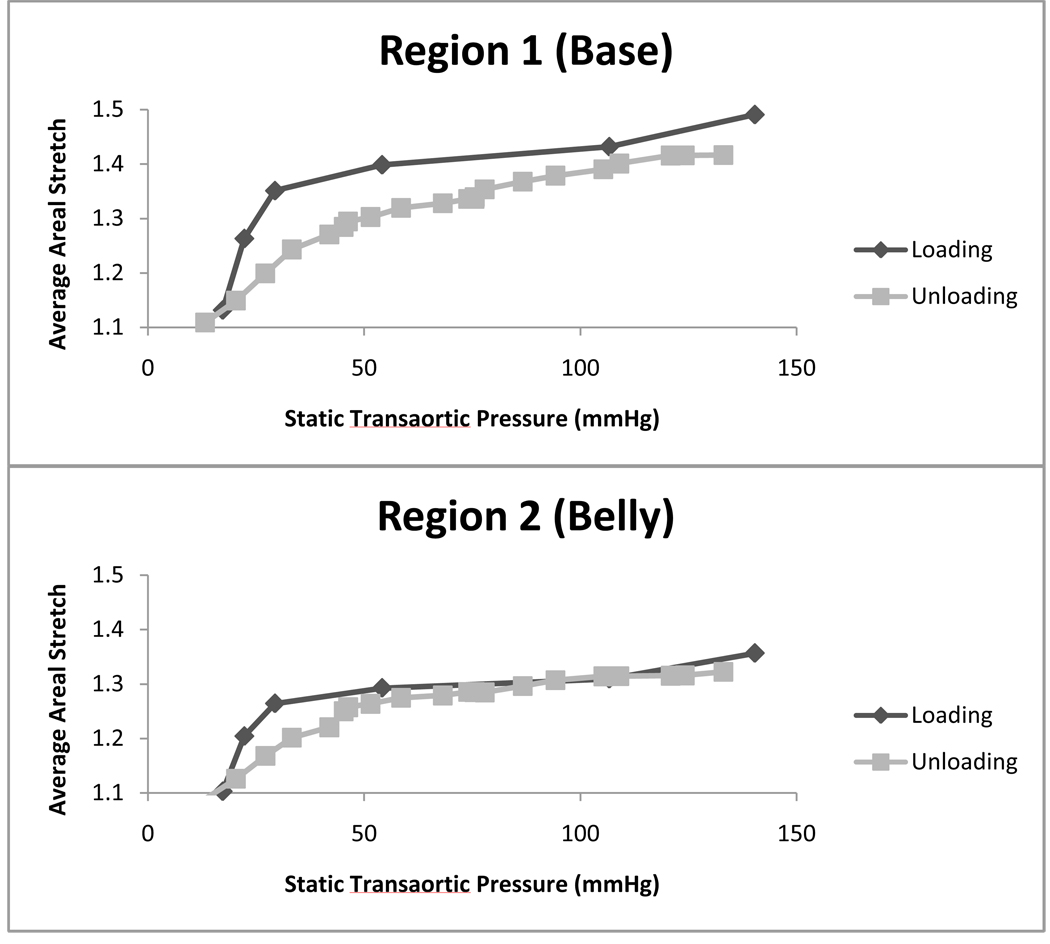
Figure 9 shows average areal stretch plotted against transaortic static pressure in the early loading and late unloading periods for the R1 and R2 regions. In region R1, larger stretch magnitudes were observed during the loading phase than the unloading phase at the same transvalvular static pressure. Between 20 mmHg and 50 mmHg, the gradient of stretch versus transvalvular pressure was higher during the loading phase than the unloading phase. These phenomena indicated the presence of dynamic pressure effects during the loading phase. The same effects were observed in region R2.
Figure 9. Average Areal Stretch vs. Static Transaortic Pressure.
Average areal stretch is plotted versus static transaortic pressure for regions R1 and R2. Stretch values are larger during loading than unloading for all transvalvular pressures in R1 and larger during loading than unloading for 18–55mmHg in R2. n=6.
4. Discussion
In the current study we report spatial variation of native AV leaflet stretch responses under normal physiological pressure loading conditions, which have not been reported previously in the literature. Studies to date have focused on the mechanics of bioprosthetic AVs (Gao et al., 2002) or isolated location-specific mechanical testing (Missirlis and Chong, 1978), which may not be representative of the native AV.
Our findings corroborate existing knowledge on the structure and geometry of the aortic valve as reported by several authors. The principal stretch directions aligned with the radial and circumferential directions uniformly over the entire valve leaflet. This agreed with Sacks et al.’s observation that collagen fiber orientations align circumferentially at low pressures (less than 4 mmHg transvalvular pressure) and remained aligned as such at subsequent higher pressures (Sacks et al., 2009). The gradual decrease in circumferential stretch from the leaflet base to the coaptation line is reflective of the gradual change in leaflet composition. Circumferential trunk collagen fibers increase and non-fibrous tissues decrease from base to the coaptation line (Sacks et al., 2009; Thubrikar, 1990), thus increasing circumferential tissue stiffness away from the base, leading to lower stretch away from the base. Radial stretch, on the other hand, is higher near the edges: both near the base and near the coaptation line, but is lower in the central portion of the leaflet. We speculate this is due to the disruption of the natural pressurized curvature of the leaflet resulting from interaction with the annulus and other leaflets at the edges, thus leading to higher curvature. This higher curvature is associated with larger stresses according to hoop stress laws, which results in a larger stretch response. These stretch ratio differences between the different leaflet regions are maintained throughout the majority of diastole, indicating that these differences are most likely due to leaflet composition and geometric differences rather than dynamic effects.
Studying regional variations in leaflet stretch may offer insights into the regional variation in valve calcification potential. Studies have shown that AV calcification occurs with specific spatial patterns; the base of the leaflet and the coaptation line of the valve are more prone to calcification than the belly region of the leaflet (Thubrikar et al., 1986). The current study has demonstrated that these regions suffer from larger deformations during each cardiac cycle, and since ex-vivo studies suggest that the AV leaflet could be pathologically mechanosensitive to stretch (Balachandran et al., 2010), these larger deformations could be a contributing factor to site specificity of AV calcification.
The current study further suggests that the stretch dynamics of the AV are complex, and are a function of both transvalvular pressure, and the dynamics of the surrounding flow field. Our data shows that there are localized regions of elevated stretch on the leaflet during peak diastole. These are primarily at the R1 base region of the leaflet, and to a lesser extent, in the radial direction at the R3 coaptation region of the AV leaflet. Since the Womersley number of flow in the aorta is high enough (approximately 36), reversed flow near the aorta walls is expected during late systole, which would culminate to fluid flowing directly towards the base of the leaflet. The momentum of this reverse flow will impart additional pressure on the base of the leaflets to cause the significant stretch elevation during early diastole in the R1 base region of the leaflet.
By plotting the areal stretch versus static transaortic pressure during both the stretch-loading and stretch-unloading phases, as shown in Figure 9, we can further support the phenomenon of dynamic pressures imparted on the leaflets by the fluid inertia. Although the central portion of the AV leaflet has been shown to respond essentially elastically at physiologic frequencies and loading conditions (Stella et al., 2007) with little hysteresis, we observed a mismatch between loading phase and unloading phase mechanical response, notably for the R1 region. This can be attributed to the dynamic pressure caused by the fluid hammer effect the on the closing valve. During the loading phase, the valve is closing, and there is retrograde fluid flow moving towards the valve. The momentum of the fluid provided additional transvalvular pressure (the dynamic pressure) to cause more stretch. During the unloading phase, however, the surrounding fluid is almost static, and there is an absence of dynamic pressure. This dynamic pressure effect is the most prominent for base region, indicating that there is more direct impact of the reversing flow at the base of the leaflet.
The early diastolic stretch elevation at the base holds implications for an important physiological function. Previoius authors have suggested that the presence of the sinuses of Valsalva are to assist in cushioning early diastolic transvalvular pressures (Beck et al., 2001; Duran et al., 1990; Sacks et al., 2009). Simulations have shown that the absence of the sinuses results in additional stresses on the leaflets , as does a reduction in the sinus wall compliance (Beck et al., 2001). It has been hypothesized that age-related stiffening of the aortic wall will thus result in higher stresses and stretch on the aortic valve leaflets resulting in the formation of calcific lesions at the base of the valve leaflets (Robicsek et al., 2002). Our study confirmed the presence of stretch (and thus stress), elevation during the early diastolic phase as a result of the fluid hammer effect. Further, we observed that the base of the valve leaflet is most affected by the fluid hammer effect, suggesting that the base of the leaflets serve as cushions for fluid hammer in conjunction with the sinuses. Our observation of the effects of fluid hammer during early diastole corroborate with in vivo observations by Dagum et al. in the sheep model, where the aortic valve annulus expanded during early diastole, just after isovolumetric relaxation (Dagum et al., 1999).
Conceivably, with the stiffening of the sinus walls, the valve leaflets will have to absorb the inertial energy of the reversing fluid colliding with the aortic root, causing more deformation to the leaflet tissues than if the sinus walls are healthy. Since this early diastolic stretch elevation may hold implications for valve calcification, further studies quantifying the amount of stretch variations with stiffened sinus walls would be useful.
5. Limitations
The principal limitation of this study was the differences between our in vitro setup and in vivo conditions, such as the lack of annular motion, and the use of a rigid chamber for valve mounting. However, the in vitro approach was necessary to obtain the superior temporal and spatial resolution, which cannot be achieved in vivo.
We acknowledge that the reference state chosen for this study does not produce true stretch values because even minute pressures alter stretch significantly from a true zero-stretch state (Billiar and Sacks, 2000; Sacks et al., 1998). Therefore, the stretch values we report especially in the radial direction, are smaller than previously reported (Yap et al. 2010). Our intent, however, was to characterize the spatial variation of stretch over the entire leaflet instead of quantifying absolute stretch values.
6. Conclusion
This study reported spatial differences in native AV dynamic deformation characteristics under simulated physiologic loading conditions. Dynamic fluid effects were observed to influence the leaflet stretch, implying that the tissue mechanic studies of the AV must include consideration of the flow dynamic environment. Locations of high stretch ratio on the leaflet appeared to match spatial patterns of calcification described in the literature, suggesting that high stretch may be related to higher risk of valve calcification.
Acknowledgements
This work was partially funded by NIH grant HL-070262, and partially supported by a Georgia Tech President’s Undergraduate Research Award. The authors acknowledge Dr. Michael Sacks for the use of the MATHCAD code used in data processing, and Hollifield Farms (Covington, GA) for providing porcine hearts.
Footnotes
Publisher's Disclaimer: This is a PDF file of an unedited manuscript that has been accepted for publication. As a service to our customers we are providing this early version of the manuscript. The manuscript will undergo copyediting, typesetting, and review of the resulting proof before it is published in its final citable form. Please note that during the production process errors may be discovered which could affect the content, and all legal disclaimers that apply to the journal pertain.
Conflict of Interest Statement
No conflicts of interest are declared by the authors.
References
- Adamczyk MM, Vesely I. Characteristics of compressive strains in porcine aortic valves cusps. The Journal Of Heart Valve Disease. 2002;11(1):75–83. [PubMed] [Google Scholar]
- Balachandran K, Konduri S, Sucosky P, Jo H, Yoganathan AP. An ex vivo study of the biological properties of porcine aortic valves in response to circumferential cyclic stretch. Annals Of Biomedical Engineering. 2006;34(11):1655–1665. doi: 10.1007/s10439-006-9167-8. [DOI] [PMC free article] [PubMed] [Google Scholar]
- Balachandran K, Sucosky P, Jo H, Yoganathan AP. Elevated cyclic stretch alters matrix remodeling in aortic valve cusps: implications for degenerative aortic valve disease. American Journal Of Physiology. Heart And Circulatory Physiology. 2009;296(3):H756–H764. doi: 10.1152/ajpheart.00900.2008. [DOI] [PubMed] [Google Scholar]
- Balachandran K, Sucosky P, Jo H, Yoganathan AP. Elevated Cyclic Stretch Induces Aortic Valve Calcification in a Bone Morphogenic Protein-Dependent Manner. Am J Pathol. 2010 doi: 10.2353/ajpath.2010.090631. ajpath.2010.090631. [DOI] [PMC free article] [PubMed] [Google Scholar]
- Beck A, Thubrikar MJ, Robicsek F. Stress analysis of the aortic valve with and without the sinuses of valsalva. The Journal Of Heart Valve Disease. 2001;10(1):1–11. [PubMed] [Google Scholar]
- Billiar KL, Sacks MS. Biaxial mechanical properties of the natural and glutaraldehyde treated aortic valve cusp--Part I: Experimental results. Journal Of Biomechanical Engineering. 2000;122(1):23–30. doi: 10.1115/1.429624. [DOI] [PubMed] [Google Scholar]
- Christie GW, Barratt-Boyes BG. Biaxial mechanical properties of explanted aortic allograft leaflets. The Annals Of Thoracic Surgery. 1995;60(2 Suppl):S160–S164. doi: 10.1016/0003-4975(95)00259-n. [DOI] [PubMed] [Google Scholar]
- Dagum P, Green GR, Nistal FJ, Daughters GT, Timek TA, Foppiano LE, Bolger AF, Ingels NB, Jr, Miller DC. Deformational dynamics of the aortic root: modes and physiologic determinants. Circulation. 1999;100(19 Suppl):II54–II62. doi: 10.1161/01.cir.100.suppl_2.ii-54. [DOI] [PubMed] [Google Scholar]
- Doehring TC, Kahelin M, Vesely I. Mesostructures of the aortic valve. The Journal Of Heart Valve Disease. 2005;14(5):679–686. [PubMed] [Google Scholar]
- Duran CG, Balasundaram S, Bianchi S, Ahmad R, Wilson N. Haemodynamic effect of supraaortic ridge enhancement on the closure mechanism of the aortic valve and its implications in aortic valve repair. The Thoracic And Cardiovascular Surgeon. 1990;38(1):6–9. doi: 10.1055/s-2007-1013982. [DOI] [PubMed] [Google Scholar]
- Gao BZ, Pandya S, Arana C, Hwang NHC. Bioprosthetic heart valve leaflet deformation monitored by double-pulse stereo photogrammetry. Annals Of Biomedical Engineering. 2002;30(1):11–18. doi: 10.1114/1.1432690. [DOI] [PubMed] [Google Scholar]
- He Z, Ritchie J, Grashow JS, Sacks MS, Yoganathan AP. In vitro dynamic strain behavior of the mitral valve posterior leaflet. Journal Of Biomechanical Engineering. 2005;127(3):504–511. doi: 10.1115/1.1894385. [DOI] [PubMed] [Google Scholar]
- Iyengar AKS, Sugimoto H, Smith DB, Sacks MS. Dynamic in vitro quantification of bioprosthetic heart valve leaflet motion using structured light projection. Annals Of Biomedical Engineering. 2001;29(11):963–973. doi: 10.1114/1.1415523. [DOI] [PubMed] [Google Scholar]
- Liu AC, Joag VR, Gotlieb AI. The emerging role of valve interstitial cell phenotypes in regulating heart valve pathobiology. The American Journal Of Pathology. 2007;171(5):1407–1418. doi: 10.2353/ajpath.2007.070251. [DOI] [PMC free article] [PubMed] [Google Scholar]
- Merryman WD, Lukoff HD, Long RA, Engelmayr GC, Jr, Hopkins RA, Sacks MS. Synergistic effects of cyclic tension and transforming growth factor-beta1 on the aortic valve myofibroblast. Cardiovascular Pathology: The Official Journal Of The Society For Cardiovascular Pathology. 2007;16(5):268–276. doi: 10.1016/j.carpath.2007.03.006. [DOI] [PMC free article] [PubMed] [Google Scholar]
- Missirlis YF, Chong M. Aortic valve mechanics--Part I: material properties of natural porcine aortic valves. Journal Of Bioengineering. 1978;2(3–4):287–300. [PubMed] [Google Scholar]
- Otto CM. Calcific aortic stenosis--time to look more closely at the valve. The New England Journal Of Medicine. 2008;359(13):1395–1398. doi: 10.1056/NEJMe0807001. [DOI] [PubMed] [Google Scholar]
- Padala M, Sacks MS, Liou SW, Balachandran K, He Z, Yoganathan AP. Mechanics of the Mitral Valve Strut Chordae Insertion Region. Journal Of Biomechanical Engineering. 2010;132(8):081004. doi: 10.1115/1.4001682. [DOI] [PubMed] [Google Scholar]
- Robicsek F, Thubrikar MJ, Fokin AA. Cause of degenerative disease of the trileaflet aortic valve: review of subject and presentation of a new theory. The Annals Of Thoracic Surgery. 2002;73(4):1346–1354. doi: 10.1016/s0003-4975(01)03001-6. [DOI] [PubMed] [Google Scholar]
- Sacks MS, David Merryman W, Schmidt DE. On the biomechanics of heart valve function. Journal Of Biomechanics. 2009;42(12):1804–1824. doi: 10.1016/j.jbiomech.2009.05.015. [DOI] [PMC free article] [PubMed] [Google Scholar]
- Sacks MS, Enomoto Y, Graybill JR, Merryman WD, Zeeshan A, Yoganathan AP, Levy RJ, Gorman RC, Gorman JH., 3rd In-vivo dynamic deformation of the mitral valve anterior leaflet. The Annals Of Thoracic Surgery. 2006;82(4):1369–1377. doi: 10.1016/j.athoracsur.2006.03.117. [DOI] [PubMed] [Google Scholar]
- Sacks MS, He Z, Baijens L, Wanant S, Shah P, Sugimoto H, Yoganathan AP. Surface strains in the anterior leaflet of the functioning mitral valve. Annals Of Biomedical Engineering. 2002;30(10):1281–1290. doi: 10.1114/1.1529194. [DOI] [PubMed] [Google Scholar]
- Sacks MS, Smith DB, Hiester ED. The aortic valve microstructure: effects of transvalvular pressure. Journal Of Biomedical Materials Research. 1998;41(1):131–141. doi: 10.1002/(sici)1097-4636(199807)41:1<131::aid-jbm16>3.0.co;2-q. [DOI] [PubMed] [Google Scholar]
- Sacks MS, Yoganathan AP. Heart valve function: a biomechanical perspective. Philosophical Transactions Of The Royal Society Of London. Series B, Biological Sciences. 2007;362(1484):1369–1391. doi: 10.1098/rstb.2007.2122. [DOI] [PMC free article] [PubMed] [Google Scholar]
- Stella JA, Liao J, Sacks MS. Time-dependent biaxial mechanical behavior of the aortic heart valve leaflet. Journal Of Biomechanics. 2007;40(14):3169–3177. doi: 10.1016/j.jbiomech.2007.04.001. [DOI] [PMC free article] [PubMed] [Google Scholar]
- Stella JA, Sacks MS. On the biaxial mechanical properties of the layers of the aortic valve leaflet. Journal Of Biomechanical Engineering. 2007;129(5):757–766. doi: 10.1115/1.2768111. [DOI] [PubMed] [Google Scholar]
- Thubrikar MJ. The Aortic Valve. Boca Raton: CRC; 1990. [Google Scholar]
- Thubrikar MJ, Aouad J, Nolan SP. Patterns of calcific deposits in operatively excised stenotic or purely regurgitant aortic valves and their relation to mechanical stress. The American Journal Of Cardiology. 1986;58(3):304–308. doi: 10.1016/0002-9149(86)90067-6. [DOI] [PubMed] [Google Scholar]
- Vesely I, Noseworthy R. Micromechanics of the fibrosa and the ventricularis in aortic valve leaflets. Journal Of Biomechanics. 1992;25(1):101–113. doi: 10.1016/0021-9290(92)90249-z. [DOI] [PubMed] [Google Scholar]
- Yap CH, Kim H-S, Balachandran K, Weiler M, Haj-Ali R, Yoganathan AP. Dynamic deformation characteristics of porcine aortic valve leaflet under normal and hypertensive conditions. American Journal Of Physiology. Heart And Circulatory Physiology. 2010;298(2):H395–H405. doi: 10.1152/ajpheart.00040.2009. [DOI] [PubMed] [Google Scholar]


