Abstract
Background
Many industrialized nations have initiated reforms in the organization and delivery of primary care. In Ontario, Canada, salaried and capitation models have been introduced in an attempt to address the deficiencies of the traditional fee-for-service model. The Ontario setting therefore provides an opportunity to compare these funding models within a region that is largely homogeneous with respect to other factors that influence care delivery. We sought to compare the performance of the models across a broad array of dimensions and to understand the underlying practice factors associated with superior performance. We report on the methodology grounding this work.
Methods
Between 2004 and 2006 we conducted a cross-sectional mixed-methods study of the fee-for-service model, including family health groups, family health networks, community health centres and health service organizations. The study was guided by a conceptual framework for primary care organizations. Performance across a large number of primary care attributes was evaluated through surveys and chart abstractions. Nested case studies generated qualitative provider and patient data from 2 sites per model along with insights from key informants and policy-makers familiar with all models.
Results
The study recruited 137 practices. We conducted 363 provider surveys and 5361 patient surveys, and we performed 4108 chart audits. We also conducted interviews with 40 family physicians, 6 nurse practitioners, 24 patients and 8 decision-makers. The practice recruitment rate was 45%; it was lowest in fee-for-service practices (23%) and in family health networks (37%). A comparison with all Ontario practices in these models using health administrative data demonstrated that our sample was adequately representative. The patient participation (82%) and survey scale completion (93%) rates were high.
Conclusions
This article details our approach to performing a comprehensive evaluation of primary care models and may be a useful resource for researchers interested in primary care evaluation.
As a growing body of evidence reveals the importance of primary care to the health of populations, there is increasing interest in the efficient, effective and equitable delivery of these services. In response, many industrialized nations have initiated reforms in the organization and delivery of primary care with the aim of optimizing care delivery.1 Primary care is funded in several different ways by different countries. Capitation funding provides a fixed annual sum to a practice for the care of each patient registered with that practice. Fee-for-service funding provides payment to a practice according to services delivered, such as patient consultations and type of care delivered. In a salaried service, the health care providers are employed and practice income is not dependent on the number of services provided or the number of patients served. Recently some countries have made efforts to introduce quality- or performance-related payments into existing payment structures.2-4 There is little evidence to indicate which models of funding of primary care deliver better services, and international comparisons are difficult to interpret because differences are not confined to funding models.
The situation in Ontario, Canada, provides an excellent opportunity to compare funding models for primary care because the 3 major models described above have been used side by side in recent years. This enables comparisons to be made largely unconfounded by differences in gross domestic product, percent spending on health care, patient characteristics and professional training. Over the past 2 decades, Ontario has developed an array of diverse models of primary care delivery but little information on their comparative performance is available to guide further reform initiatives. In 2002, the government of Canada established the Primary Health Care Transition Fund, an $800-million commitment to help provinces and territories develop and sustain new approaches to primary health care delivery. In this article we report on the methodology of a mixed-methods practice-based study sponsored from this fund, the Comparison of Models of Primary Care in Ontario (COMP-PC). We studied fee-for-service (FFS) practices (including the traditional FFS model and reformed family health group model), a capitation-based system called health service organizations (HSOs), a model of multidisciplinary community health centres (CHCs) employing salaried physicians with a focus on community needs, and a relatively new model of physician-run group practices, the family health networks (FHNs), which incorporated extended-hour coverage, financial support for information technology and a blended remuneration formula of capitation, performance bonuses and fee for service.
Our aim was to measure the impact of funding models of primary care on patient self-reported quality of care and on provider adherence to recommended standards of care. In this article we detail the study design and the methods used for data collection. We describe how we categorized and sampled practices using different funding models, how we collected information on processes of care that might explain model differences and how we measured the outcomes of quality and adherence. This large study used a complex methodology that cannot be sufficiently described in associated articles. This article, therefore, serves as an elaboration of the methods that will be reported in a succinct form elsewhere.
Methods
Objectives
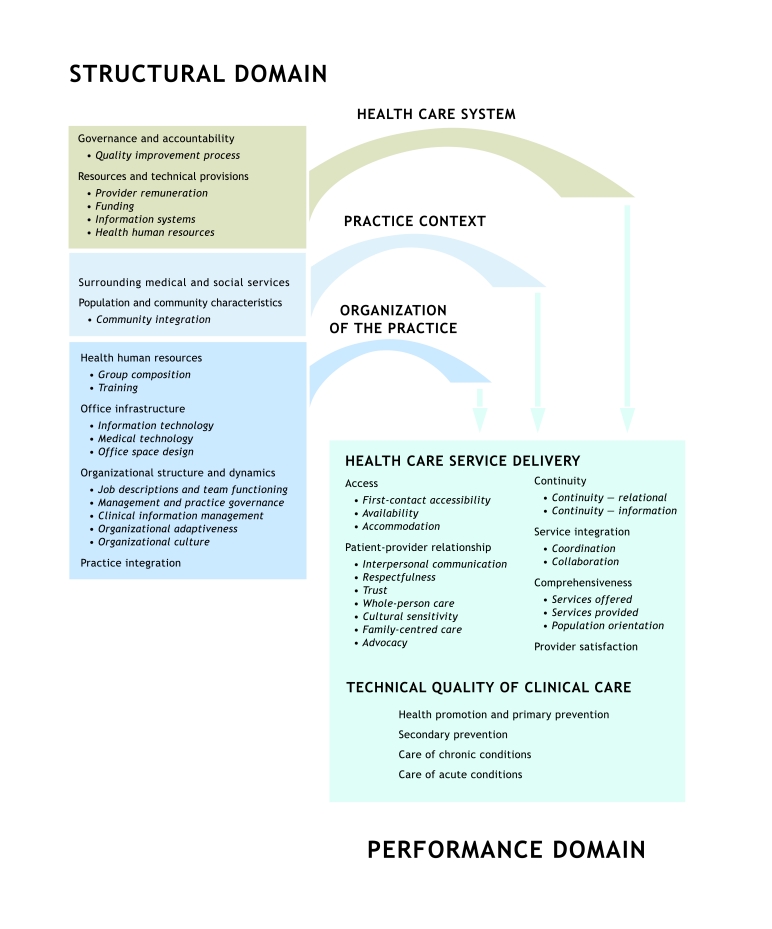
The objectives of the COMP-PC study were to describe 4 funding models (FFS, HSOs, CHCs and FHNs), to measure and compare the quality of primary care delivered and to better understand aspects of practice organization that may influence the health care experience of patients and the quality of care they receive. The process and outcome evaluation were theory based5 and guided by a conceptual framework (Fig. 1).6
Figure 1.
Conceptual framework for primary care organizations
Design
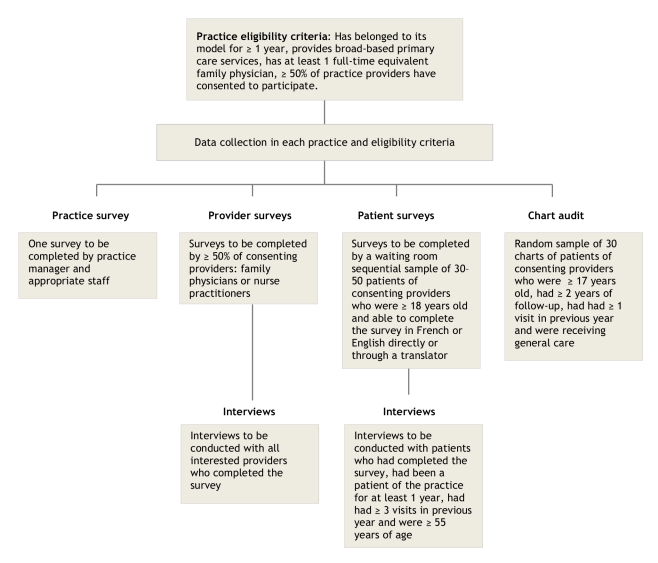
The COMP-PC project was a cross-sectional mixed-methods study of primary care practices involving quantitative data collection and a nested qualitative case study using a subset of 2 sites per model. The Ottawa Hospital Research Ethics Board approved the study. Figure 2 summarizes the study sampling approach and eligibility criteria.
Figure 2.
Practice-based study recruitment and eligibility flow chart
Study population
The study involved primary care practices, their providers and patients. We also interviewed key informants and policy-makers who had in-depth knowledge of each model.
Sample size
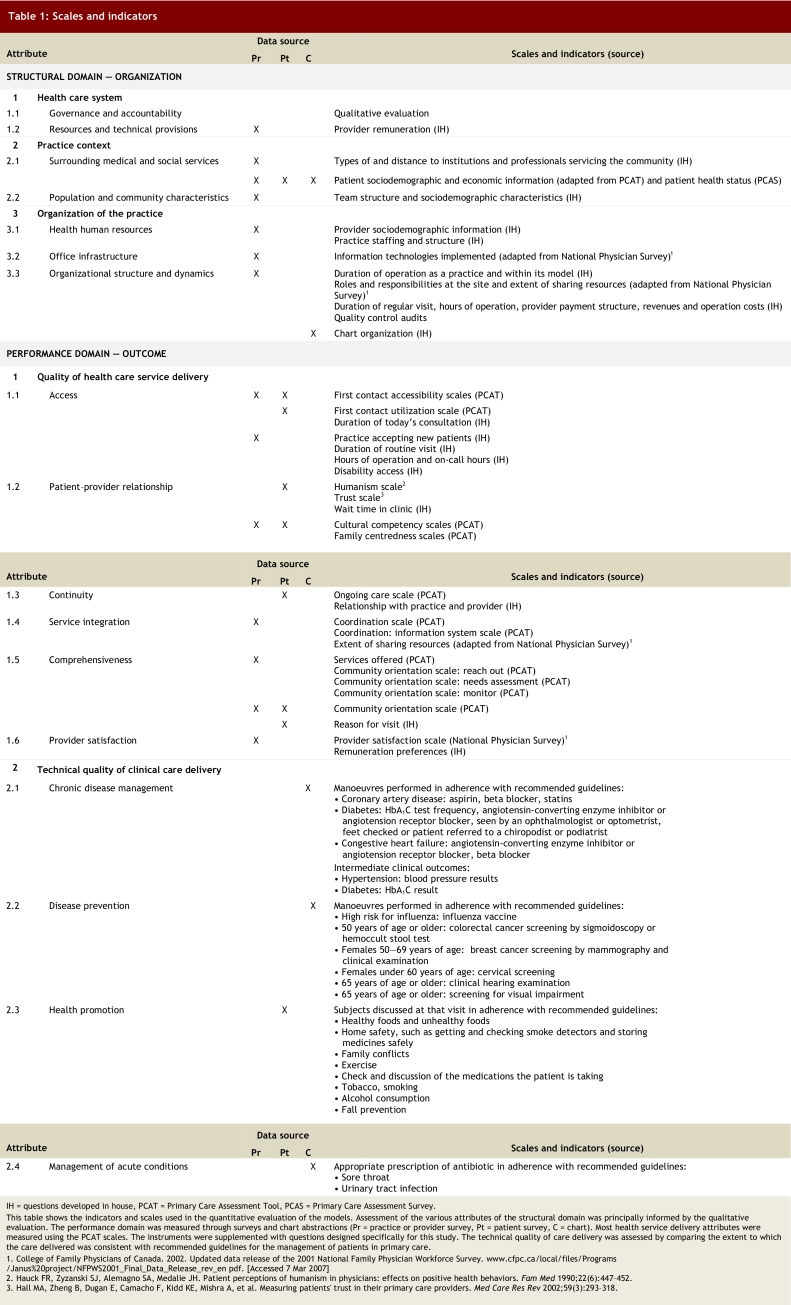
The study measured the performance of primary care practices across numerous outcomes. Because we expected the measure of performance in disease prevention to require the greatest number of measurements, it was used to estimate sample size. Performance in disease prevention was measured as the adherence to recommended guidelines for 6 manoeuvres (see Table 1, section 2.2). A patient’s disease prevention score was the proportion of manoeuvres performed to manoeuvres for which he or she was eligible.
Table 1.
Scales and indicators
Sample size was calculated using a minimum clinically important difference of 0.5 standard deviation, with an alpha value of 0.05 and a beta value of 0.20, and was chosen to control for the family-wise error rate and variance of the cluster (cluster correlation coefficient of 0.2).7 The basic unit of random selection was the practice. The recommendation that resulted from this calculation was to include data from 40 practices per model and data from at least 30 patients per practice. Owing to budgetary and time limitations, the number of practices was reduced to 35. We aimed to collect up to 50 surveys at each practice (instead of 30) to compensate for the possibility that surveys would not be adequately completed.
For the nested case study, we selected 8 practices (2 per model) from within the sites recruited for the cross-sectional study to allow for methodological and data triangulation.We stopped conducting interviews after wereached an acceptable level of data saturation for each model and for each category of respondent (providers, patients and key informants).
Study participants: practices
Eligibility
For practical reasons, we excluded practices in the far north of the province.1 Over the course of the recruitment period, we noted that the majority of practices under the traditional FFS model had converted to family health groups (FHGs), a modified FFS model introduced as the study was getting underway. At the time of recruitment, the main difference between the FHG and the traditional FFS models was that FHG practices were required to register their patients and provide extended hours of service, for which they received additional compensation.8 Three months before the end of recruitment a decision was made to include FHG practices within the traditional FFS group, and we endeavoured to enrol those FFS practices previously deemed non-eligible because they had converted to FHGs. In this document we refer to both models as FFS.
Consent to participate was required from at least half of the physicians and nurse practitioners in the organization. Practices were also required to have operated under their model for at least 1 year and provide general primary care services. Practices also provided consent to allow the study investigators to access the information related to their practice contained in health administrative databases housed at the Institute for Clinical Evaluative Sciences (ICES). Practices were considered a group if the individual providers shared at least 4 of the following 5 items or resources: office space, staff, expenses, patient records and on-call duties. Practices with different geographic locations (addresses) were considered separate even if they were linked in a network.9
Sampling strategies and recruitment
All of the CHC, HSO and FHN practices in Ontario and a randomly selected group of 197 FFS–FHG practices were invited to participate. Forty-two of these FFS–FHG practices were found to be not eligible, leaving 155 eligible FFS–FHG practices. For the nested case study, we used a typical case sampling strategy to select the sites.10 Practice sites were invited to participate in this qualitative component if they typified the model to which they belonged in size and composition. Practices needed to be large enough to allow sufficient provider interviews to permit data saturation within that model. We recruited 1 urban and 1 rural practice from each model, with the exception of HSOs; 2 urban sites were selected for HSOs because these organizations are concentrated in urban areas. The sample base covered practices serving approximately 90% of the provincial population of 12.6 million at the time of sampling.
Study invitation materials were mailed to eligible practices. Follow-up was done through a combination of mailings, telephone calls and face-to-face visits. We also sought the support of the model’s central organizational structure where one existed (i.e., CHCs and HSOs) in delivering study information and promoting participation.
Sites were offered C$2000 in recognition of the time required by professionals and administrative staff to participate in the study. An additional C$500 was paid to those practices participating in the qualitative component of the study. Recruitment and data collection took place from June 2005 to June 2006.
Study participants: providers
Eligibility
Physicians and nurse practitioners working at the practice were eligible to participate in the study if they had practised at that site for at least 1 year or 6 months, respectively; the participating site was the principal site of their clinical practice; the majority of their services were devoted to primary care; and the majority of their patients were over the age of 17 years.
Sampling strategies and recruitment
Practices were asked to invite all eligible providers to participate in the study and were informed that participation by at least half of the eligible providers was required for the practice to be included in the study; 363 providers participated. Practices electing to also participate in the qualitative component provided names of family physicians and nurse practitioners who were interested in interviews. For 2 sites with multiple providers, this process yielded only 2 providers. In these cases, snowball sampling was then used to recruit providers through the first contact.
Study participants: patients
Eligibility
Patients were eligible to complete the survey if they were patients of consenting providers, 18 years of age or older, not severely ill or cognitively impaired, not known to the survey administrator and able to communicate in English or French either directly or through a translator. Patients participating in the qualitative component of the study were also required to have been patients of the practice for at least 1 year and to have attended at least 3 appointments. We gave preference to those 55 years of age or older.
Sampling strategies and recruitment
Following a prepared script, receptionists introduced the study and handed an invitation letter to all patients presenting for their appointment on the day of survey administration. Using another prepared script, the survey administrator provided more detailed information about the study, verified whether the patient met the full set of eligibility criteria and invited eligible patients to participate. In practices participating in the qualitative component of the study, the survey administrator invited patients who had completed surveys to take part in an in-depth interview at a later date, until 6–8 agreed.
Chart audit
Eligibility
Chart abstraction was limited to the charts of regular patients of consenting care providers who were 17 years of age or older at the time of their last visit and had at least 2 years of information, with at least 1 visit in the previous year. Patients were excluded if they had died or had left the practice in the previous 2 years, had used the practice for specialized services only (e.g., foot care), were known to the chart abstractor or were staff members of the practice.
Random selection
In practices with paper-based charting, the total length of the shelves containing the charts was divided into 60 “similar distance” sections, and the fifth chart from the start of each section was retrieved for evaluation. In practices with electronic medical records, a random-number generator produced a list of 100 practice patients. In each case the chart abstractor reviewed eligibility sequentially until 30 eligible charts were identified for review.
Data collection tools
We used a theory-based evaluation framework to identify the dimensions of care that should be addressed and to help select the tools used for the evaluation.5 The process involved a review of the literature and consultation with stakeholders and experts in the field to develop the theory underpinning the approach. As a result, we developed a conceptual framework that identified key areas to measure;6 established program logic models for each practice model that provided a detailed visualization of the link between organizational attributes, activities and performance; and produced a mapping document to guide the tool selection.
Quantitative component
The quantitative data collection tools comprised 3 surveys and a chart abstraction form. The surveys were modified from the adult edition of the Primary Care Assessment Tool (PCAT), full or abridged version. The PCAT is an instrument developed to measure the quality of primary care services. The full version of the PCAT was validated in 2001.11,12 We selected this tool because of the high degree of congruency between the dimensions it addresses and those set out in our conceptual framework and because the instrument allows the perceptions of patients and providers to be measured. To maintain the validity of the original tool, which was developed in the US, modifications were kept to a minimum and primarily reflected the differences in context between the US and Ontario settings. To minimize the burden on providers in group practices, a subset of questions from the provider survey addressing practice factors common to all of the providers in a given practice was moved to a practice survey.
The content of the PCAT was mapped to the dimensions of the conceptual framework, and where deficiencies were noted the tool was supplemented with questions from the National Physician Survey and other studies9,13-15 or with questions developed by the investigators. Copies of the surveys are available from the authors upon request. Details of the scales and indicators used in this evaluation are shown in Table 1.
Practice survey
The practice survey was divided into 3 sections. The first focused on the description of the practice environment including the setting, hours of operation, availability of medical and social services in the surrounding area and accessibility for disabled persons. The second section contained questions that measured performance (see Table 1). The third section captured various practice attributes, including governance, team structure, extent of information technology adoption and economic information (e.g., sources of income, salaries and operating costs).
Provider survey
The provider survey was divided into 2 sections. The first section contained questions measuring the provider’s perception of practice performance on several dimensions of health care service delivery (see Table 1). The second section captured provider demographic information, information on their work setting and socio-economic information.
Patient survey
The patient survey was divided into 2 sections. The first section was completed in the waiting room before the visit with the provider. This section captured patient sociodemographic and economic information and elicited the patient’s experience concerning a broad range of dimensions of health care service delivery as shown in Table 1. The second section, completed after the appointment with the provider, took less than 5 minutes to answer and captured visit-specific information, including waiting time, visit duration and measures of activities related to health promotion.
The survey was developed in English and translated to French through an extensive iterative translation process. The French version was validated against the English version on a sample of 120 bilingual individuals.15 We made the tool available in French and English only and relied on the services of translators to reach patients who spoke neither language.
Chart audit
The chart audit forms captured 4 thematic areas: patient demographic information; visit activities, including referrals, prescriptions and orders; chart organization; and measures of performance of technical quality of care, including prevention, chronic disease management and acute disease management. We evaluated performance of technical quality of care by comparing the care provided with established guidelines for prevention, chronic disease management and acute disease management.
Qualitative component
We used the conceptual framework to define the topics and questions to be covered during qualitative data collection. At the case study sites at least 2 physicians and at least 1 nurse practitioner (if available) were interviewed. The interview guide for providers contained questions about the influence of organizational characteristics (e.g., remuneration scheme), processes (e.g., teamwork, inter-professional collaboration) and clinical routines on service delivery. The interview guide for patients focused on their experience with the practice associated with the dimensions of accessibility, continuity, coordination and comprehensiveness of care. The interviews with key informants focused on qualitative comparisons of the 4 models studied in relation to broad issues such as governance, accountability and performance measurement in primary care.
Quality control
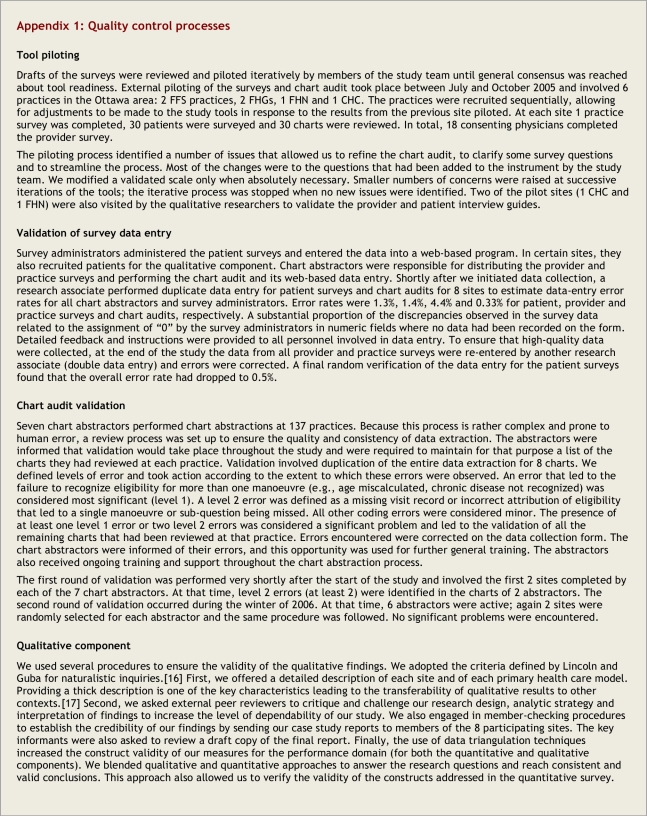
All tools were piloted before the start of the study. A full description of the piloting process can be found in Appendix 1. Data entry verification was performed for all 4 tools, and the accuracy with which the results of the practice and provider survey were recorded was enhanced by double data entry. Chart audit validation was performed twice during the study. At each verification, chart abstractors were informed of their errors and received additional focused training then and throughout the study. Data were exported into SPSS and verified for internal consistency, missing information and outliers. Queried data were verified against the hard copy of the data collection tools. The validity of the qualitative findings was verified using naturalistic inquiries.16 We also engaged in member-checking procedures to establish the credibility of our findings. Finally, the use of data triangulation techniques increased the construct validity of our measures for the performance domain (for both the quantitative and qualitative components). Additional details concerning the quality control processes are available in Appendix 1.
Study processes
This study involved a wide range of personnel from various backgrounds over a 3-year period and required significant organizational preparation. Details of the study team composition and study processes are available in Appendix 2.
Stakeholder advisory committee
A stakeholder advisory committee comprised of 2 members from each model, Ministry of Health and Long-Term Care representatives, a community member and study team members met twice during the study. The committee’s goals were for its members to serve as conduits between their representative group and the study team, to ensure transparency of the study process, to guide the evaluation plan and interpretation of results, and to participate in outcome dissemination.
Planned analyses
The study captures 2 types of data, 1 describing the practice structure and the other the practice performance (see Table 1). The study will use multi-level analyses to compare the performance of the models studied across the performance dimensions. It will also rely on the large number of structural attributes described for each practice to assess their impact on performance by evaluating their association with better performance. For example, we will evaluate whether a difference in first contact accessibility exists between models and then identify the components of the practice structure that are associated with better first contact accessibility across all models. In these analyses, provider information will be aggregated to the practice level, and patient level information (from surveys and chart abstraction) will be linked to the practice and provider data, allowing a hierarchical approach to data analysis accounting for intra-cluster correlations.7 We captured measures of the quality of health service delivery as well as measures of the technical quality of care in the sample practices. Our analyses will also allow us to understand the relationship between the 2 within a practice.
Results
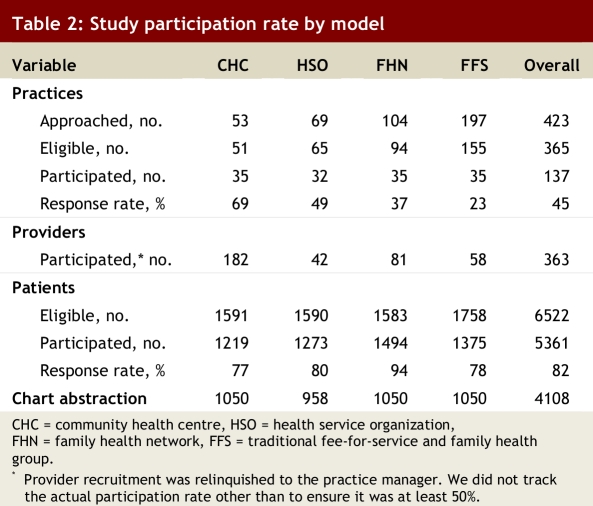
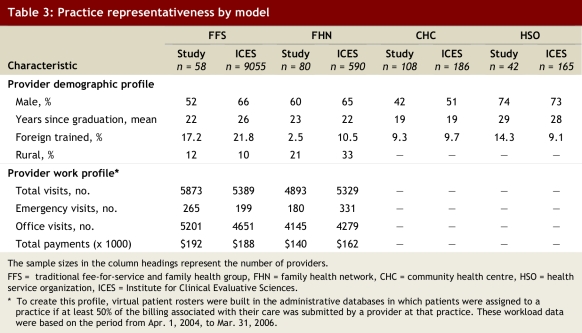
The study was successful in recruiting its intended number of practices (35) in all practice types except HSOs (32) (Table 2) and involved 8 practices in the qualitative evaluation. FFS–FHG practices were the most difficult ones to recruit (participation rate of 23%). We compared the profiles of the recruited family physicians with the profiles of all Ontario family physicians practising in these models to determine if there was selection bias related to practice refusal or provider self-selection. We relied on the information contained in the physician workforce database and in the Ontario Health Insurance Plan (OHIP) billing database housed at ICES. The former allowed evaluation of provider demographic profiles, and the latter provided billing parameters that allowed us to compare the FFS–FHG and FHN practices only (these models rely on Ministry of Health and Long-Term Care billing for their remuneration). These comparisons showed that our sample is broadly representative for all characteristics measured in these databases (Table 3).
Table 2.
Study participation rate by model
Table 3.
Practice representativeness by model
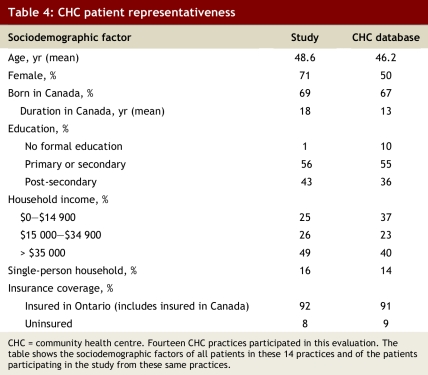
We compared the sociodemographic information of the CHC patients participating in the study with that of all CHC patients listed in the CHC practice electronic patient registration database to evaluate whether there was systematic bias in the selection of respondents from the CHCs (Table 4). CHC is the model most likely to serve individuals who are housebound or have language barriers and therefore less likely to have been reached in this study than patients from the other practice types. As anticipated, the waiting room sample was older and more likely to be female than the overall practice population, reflecting the profile of those who make more use of primary care services. The study sampling was not successful in reaching individuals without a formal education and those with lower income.
Table 4.
CHC patient representativeness
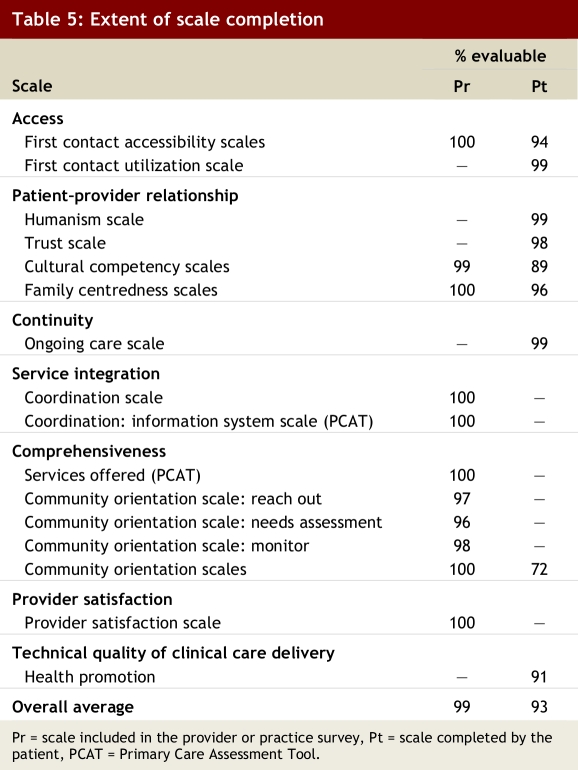
Survey questionnaires were not modified after the start of the study. All practices and all but 2 consenting providers completed the survey. The overall patient participation rate was 82%, with most scales adequately completed for evaluation (Table 5).
Table 5.
Extent of scale completion
Discussion
We measured performance across a large number of primary care attributes to obtain a comprehensive picture of status of family care in Ontario. We evaluated dimensions of health service delivery and technical quality of care in the same practices. The study was complex and care was taken to ensure the quality of the data collected and to minimize disruption to the practices. At the study onset, much work was invested in ensuring that appropriate evaluation tools were used. Throughout the study, we focused on enhancing practice and patient recruitment, establishing dependable processes for data collection, verifying data quality and training and supporting personnel.
The study was successful in collecting data from 137 primary care practices for a multi-dimensional evaluation. The limitations of this mixed-methods study stem largely from the problems inherent in cross-sectional and survey-based studies. These include participant selection bias and the inability to infer causation from observed associations. Other study-specific factors are discussed below.
Sample selection
Sample selection was limited by our ability to identify all practices within a model, the geographic boundaries we established for data collection and the fact that patient recruitment was limited to those attending the practice. There was no accessible central source of reliable practice lists within each model, except for CHCs. In addition, late in 2004 the Ontario Ministry of Health and Long-Term Care instituted a new model of care, the FHG, to which FFS practices could transition. We initially excluded FHG practices, but FFS practices converted to this new model quickly; by early 2006 most FFS practices had become FHGs and it became evident that the great majority would transition by the year end. As a result, 3 months before recruitment was terminated, a decision was made to include the FFS practices that had transitioned to FHGs. Although a concerted effort was made to return to those practices initially deemed ineligible because they had converted into an FHG, not all attempts were successful, so we cannot ignore this potential source of bias toward late adopters within this subset.
The geographic boundaries set by the study resulted in the exclusion of the most northern territories of the province. These areas serve a more marginalized population living under very different conditions and for whom the experience of primary care services is not reflected by the study sample. Our study’s findings cannot be extrapolated to that group.
Finally, we chose to administer the patient survey to those patients visiting the practice on a given day. This face-to-face approach is expected to have enhanced our response rate (compared with what might have been expected with a telephone or mailed questionnaire approach) but resulted in an overrepresentation of those more likely to frequent the practice. Therefore, the sample does not represent the general practice population, nor did it reach housebound patients. Rather it is weighted, perhaps appropriately so, by the frequency of visits.
In contrast, the chart-based assessment of the technical quality of care was based on a random selection of records so that the results could be generalizable to the practice level. An alternative strategy would have been to review the charts associated with the patients surveyed. Although that approach would have allowed the relationship between the quality of health service delivery and technical quality of care to be assessed at the individual patient level, the estimates of care level would have been biased toward those attending the practice more frequently.
Data
Although the original PCAT tool had been validated,12 for some scales we relied on the nonvalidated abridged version of a validated scale. We made the tool available in 2 languages only (French and English) and used the services of translators to reach patients who spoke neither of these languages. Although we felt it was essential to capture the essence of the experience of patients from linguistic minority groups, the use of an intermediary allows for biases or inconsistencies to be introduced during the translation process.
Ideally, the selection of practices for the case study would have been informed by the results of the quantitative surveys concerning the quality-of-care indicators. This would have allowed us to select negative or deviant cases within each model for in-depth analyses. However, because of time constraints, sites were invited to participate in both components (quantitative and qualitative) of the onset of the study.
Participation
This study was conducted at a time when Ontario primary care practices were saturated with government-sponsored studies, which likely contributed to the suboptimal participation rate. The practice response rate was best in models from which we obtained support from their central organizational group (CHC and HSO). Despite lower participation rates in FFS–FHG and FHN practices, comparative data suggest that the study population was adequately representative. All but 1 scale had completion rates of 94% or higher.
We compared the study patient population with the general practice population in CHCs and found that CHC participants were older, more likely to be female, had completed a higher level of education and had a higher income than the general CHC population. In Canada older people, women and people with higher socio-economic status are more likely to visit their family physician, and thus these differences between the CHC patients surveyed and those served in CHCs may be related to our waiting room sampling approach rather than participation bias.17
Conclusions
This is the first comprehensive pan-Ontario evaluation of models of primary care. The breadth of data collected will allow an in-depth description of the practices belonging to each model type. An evaluation of the practice factors (organizational features and practice attributes) associated with better performing practices should help inform policy-makers about optimal features in primary care practices and shoud help inform practice managers about how best to structure their practices to serve their disadvantaged patients. This article may also be useful to researchers interested in investigating issues related to quality of care and organizational performance in primary care.
Biographies
Simone Dahrouge is the manager of research operations at the C.T. Lamont Primary Health Care Research Centre, the research arm of the Department of Family Medicine, Faculty of Medicine at the University of Ottawa, Ottawa, Ontario, Canada.
William Hogg is a professor at the Department of Family Medicine, the Department of Epidemiology and Community Medicine, and the Institute of Population Health, University of Ottawa, and director of the C.T. Lamont Primary Health Care Research Centre.
Grant Russell is an associate professor at the Department of Family Medicine and the Department of Epidemiology and Community Medicine at the University of Ottawa, and a clinician investigator at the C.T. Lamont Primary Health Care Research Centre.
Robert Geneau is an adjunct professor in the Department of Family Medicine at the University of Ottawa and principal scientist at the C.T. Lamont Primary Health Care Research Centre.
Elizabeth Kristjansson is a principal scientist at the Institute of Population Health, University of Ottawa.
Laura Muldoon is a lecturer in the Department of Family Medicine at the University of Ottawa and a principal scientist at the C.T. Lamont Primary Health Care Research Centre.
Sharon Johnston is an assistant professor at the Department of Family Medicine and a principal scientist at the C.T. Lamont Primary Health Care Research Centre, University of Ottawa.
Appendix
Appendix 1.
Quality control processes
Appendix 2.
Study processes
Footnotes
Competing interests: None declared.
Contributors: Simone Dahrouge participated in finalizing the study methodology, managed the quantitative component and was the principal writer of the manuscript. William Hogg conceived the project, oversaw the data collection and analysis and participated in all phases of the writing. Grant Russell helped implement the study, worked on finalizing the methodology and contributed to the writing and editing of the manuscript. Robert Geneau described the qualitative methods used in the study and reviewed all manuscript drafts. Elizabeth Kristjansson participated in editing and reviewing manuscript drafts. Laura Muldoon conceived the study and oversaw its implementation and participated in the writing of the manuscript. Sharon Johnston helped guide the analysis and participated in the writing. All of the authors approved the final version of the manuscript.
Funding source: Funding for this research was provided by the Primary Health Care Transition Fund of Ontario Ministry of Health and Long-Term Care. The views expressed in this report are the views of the authors and do not necessarily reflect those of the Ontario Ministry of Health and Long-Term Care.
References
- 1.Rosenthal Meredith B. Beyond pay for performance — emerging models of provider-payment reform. N Engl J Med. 2008;359(12):1197–1200. doi: 10.1056/NEJMp0804658. [DOI] [PubMed] [Google Scholar]
- 2.Buetow Stephen. Pay-for-performance in New Zealand primary health care. J Health Organ Manag. 2008;22(1):36–47. doi: 10.1108/14777260810862399. [DOI] [PubMed] [Google Scholar]
- 3.Campbell Stephen, Reeves David, Kontopantelis Evangelos, Middleton Elizabeth, Sibbald Bonnie, Roland Martin. Quality of primary care in England with the introduction of pay for performance. N Engl J Med. 2007;357(2):181–190. doi: 10.1056/NEJMsr065990. [DOI] [PubMed] [Google Scholar]
- 4.Pink George H, Brown Adalsteinn D, Studer Melanie L, Reiter Kristin L, Leatt Peggy. Pay-for-performance in publicly financed healthcare: some international experience and considerations for Canada. Healthc Pap. 2006;6(4):8–26. doi: 10.12927/hcpap.2006.18260. [DOI] [PubMed] [Google Scholar]
- 5.Rowan MS, Hogg W, Labrecque L, Kristjansson EA, Dahrouge S. A theory-based evaluation framework for primary care: setting the stage to evaluate the Comparison of Models of Primary Health Care in Ontario (COMP-PC) project. Can J Program Eval. 2008;23(1):113–140. [Google Scholar]
- 6.Hogg William, Rowan Margo, Russell Grant, Geneau Robert, Muldoon Laura. Framework for primary care organizations: the importance of a structural domain. Int J Qual Health Care. 2007 Nov 30;20(5):308–313. doi: 10.1093/intqhc/mzm054. http://intqhc.oxfordjournals.org/cgi/pmidlookup?view=long&pmid=18055502. [DOI] [PMC free article] [PubMed] [Google Scholar]
- 7.Baskerville N B, Hogg W, Lemelin J. The effect of cluster randomization on sample size in prevention research. J Fam Pract. 2001;50(3):W241–W246. [PubMed] [Google Scholar]
- 8.Ontario Medical Association. Family health groups (FHGs): Frequently asked questions. Toronto: The Association; 2007. [Google Scholar]
- 9.College of Family Physicians of Canada. Updated data release of the 2001 National Family Physician Workforce Survey. 2002. [accessed 7 Mar 2007]. http://www.cfpc.ca/local/files/Programs/Janus%20project/NFPWS2001_Final_Data_Release_rev_en.pdf.
- 10.Patton MQ. Qualitative research and evaluation methods. Thousand Oaks (CA): Sage Publications, Inc; 2002. [Google Scholar]
- 11.Starfield B. Adult primary care assessment tool—expanded version. Boston: Primary Care Policy Center, Johns Hopkins University School of Hygiene and Public Health; 1998. [accessed 18 Aug 2009]. http://www.jhsph.edu/pcpc/PCAT_PDFs/PCAT_AE.pdf. [Google Scholar]
- 12.Shi L, Starfield B, Xu J. Validating the adult primary care assessment tool. J Fam Pract. 2001;50(2):E1. http://www.jfponline.com/Pages.asp?AID=2157. [Google Scholar]
- 13.Hauck F R, Zyzanski S J, Alemagno S A, Medalie J H. Patient perceptions of humanism in physicians: effects on positive health behaviors. Fam Med. 1990;22(6):447–452. [PubMed] [Google Scholar]
- 14.Hall Mark A, Zheng Beiyao, Dugan Elizabeth, Camacho Fabian, Kidd Kristin E, Mishra Aneil, Balkrishnan Rajesh. Measuring patients’ trust in their primary care providers. Med Care Res Rev. 2002;59(3):293–318. doi: 10.1177/1077558702059003004. [DOI] [PubMed] [Google Scholar]
- 15.Haggerty J Centre de recherche du Centre hospitalier de l’Université de Montréal (CHUM) Accessibility and continuity of primary care in Quebec. Annex 2: Primary Care Assessment Questionnaire. 2004. [accessed 14 Aug 2009]. http://www.chsrf.ca/final_research/ogc/pdf/haggerty_final.pdf.
- 16.Lincoln YS, Guba EG. Naturalistic inquiry. Newbury Park (CA): Sage Publications, Inc; 1985. [Google Scholar]
- 17.Seale C. The quality of qualitative research. London: Sage Publications, Inc; 1999. [Google Scholar]
- 18.Nabalamba Alice, Millar Wayne J. Going to the doctor. Health Rep. 2007;18(1):23–35. [PubMed] [Google Scholar]


