

Abstract
The field of epigenetics is now capitalizing on the vast number of emerging technologies, largely based on second-generation sequencing, which interrogate DNA methylation status and histone modifications genome-wide. However, getting an exhaustive and unbiased view of a methylome at a reasonable cost is proving to be a significant challenge. In this article, we take a closer look at the impact of the DNA sequence and bias effects introduced to datasets by genome-wide DNA methylation technologies and where possible, explore the bioinformatics tools that deconvolve them. There remains much to be learned about the performance of genome-wide technologies, the data we mine from these assays and how it reflects the actual biology. While there are several methods to interrogate the DNA methylation status genome-wide, our opinion is that no single technique suitably covers the minimum criteria of high coverage and, high resolution at a reasonable cost. In fact, the fraction of the methylome that is studied currently depends entirely on the inherent biases of the protocol employed. There is promise for this to change, as the third generation of sequencing technologies is expected to again ‘revolutionize’ the way that we study genomes and epigenomes.
Keywords: DNA methylation, epigenetics, high-throughput sequencing, tiling arrays
DNA methylation, whereby a methyl group is added to the 5′ position of the cytosine pyrimidine ring, is an important epigenetic modification and is commonly associated with chromatin remodeling and gene silencing [1]. DNA methylation also plays a critical role in normal development and is involved in key processes such as X-inactivation and imprinting, and is known to be aberrant in many diseases, including cancer [2]. There are over 28 million CpG dinucleotide sites, the primary location at which methylation occurs, in a single strand of the reference human genome. CpG dinucleotides are underrepresented genome wide but, when present, they often occur in clusters called CpG islands [3] and are commonly associated with gene promoters. Non-CpG methylation has previously been reported in mammalian cells [4], and more recently, has been shown to be prominent in undifferentiated cells [5], however its biological role is still unclear.
For genome-wide DNA methylation analysis, the goal is straightforward: elucidate the consensus methylation status, either yes or no, of each CpG site in a genome, or as many sites as possible. Methods to reveal the methylation status of individual CpG sites have been available since the early 1990s with the advent of bisulfite (BS) sequencing [6–8]. CpG sites make up less than 1% of the human genome, and so the magnitude of the task may appear to be relatively small in comparison to the sequencing of the human genome. However, the formidable challenge in the analysis of DNA methylation is that while there is a single genome, each cell type and stage in differentiation may have a very distinct methylome (epigenome). In addition, there are several biological and technical problems that also hinder the quest to accurately determine genome-wide methylation. For example, variation at individual CpG sites or regions may occur owing to natural variation, or because DNA was extracted from samples that contained mixed populations of different cell-types, or alleles that are different in methylation status, or simply because of the technical limitations of the assays used (e.g., incomplete BS conversion [9] and/or bias in PCR amplifications [10]). Research to date has only scratched the surface of this potential complexity, and it is therefore, timely to alert the expanding field of epigenome researchers that interpretation of DNA methylation status needs to be critically assessed in the context of the quality of the DNA, the laboratory protocols used and the informatics techniques used to interpret the results, especially when comparing DNA methylation analyses from different platforms.
The main technologies used to assay DNA methylation status have recently been comprehensively described by one of the field's pioneers (see [11]), so we will only provide a brief overview here. The main focus of this article is on the many bioinformatic and data analysis challenges stemming from these genome-wide datasets. Specifically, we explore the various sources of bias that exist, and discuss recent developments in bioinformatics research that have facilitated improvements in standard analyses. In addition, we provide some comments on the major challenges ahead and some considerations for careful data analysis. In short, ‘protocol matters’. Every step between extracting DNA and interpretation of DNA methylation status potentially impacts on the sensitivity and specificity of the data.
Many reports have recently claimed that DNA methylation can be studied in an unbiased fashion genome-wide. For example, there are suggestions that the use of methylated cytosine specific-antibody is one of the few techniques that allows unbiased evaluation of DNA methylation genome-wide [12]. Meanwhile, others imply that methylated DNA immunoprecipitation sequencing (MeDIP-seq) analysis generates nonbiased DNA methylation maps, or provides nonbiased genome-wide information [13], or that a combination of methyl CpG binding domain (MBD) precipitation of genomic DNA with massively parallel sequencing does not introduce sequence bias [14]. While we whole-heartedly applaud and respect this scientific salesmanship, our intriguing results in this article suggest that DNA methylation mapping is not so straightforward. Some researchers, however, have recognized this complexity. For example, we and others have highlighted biases in the analysis of DNA methylation by microarrays due to CpG density, amplification and fragment length [Robinson MD, Stirzaker C, Statham AL et al.: Evaluation of enrichment-based genome -wide analyses of DNA and methylation: effects og GC amplification bias and copy number variation. Submitted] [15]. Similarly, others recognize that ‘both capture and conventional measurements are each also likely subject to biases that are intrinsic to each methodology’ [16]. A major problem that we have previously identified as a potential source of bias is PCR amplification [15], as have others, suggesting that unnecessary PCR amplification steps potentially exacerbate biases [17]. Therefore, with the ever-changing landscape of techniques emerging, many potential biases need to be assessed during the protocol and analysis steps, and the results appropriately interpreted with caution.
Discovering and accounting for biases in genomic datasets forms a significant part of bioinformatics research today. This is not a new feature, since researchers have been contending with dye and probe-specific biases for years with microarrays [18]. Understanding the processes that lead to these biases in sequencing data (e.g., PCR amplification, immunoprecipitation and restriction enzyme digestion) are essential to making full use of the data that is collected. Unfortunately, the protocols and chemistry are changing rapidly, providing a considerable challenge for bioinformatics procedures to meet. We expect this trend to continue as the third generation of sequencing platforms become more profuse.
Advantages & disadvantages of current genome-wide DNA methylation technologies
Researchers now have many options available to them for the interrogation of DNA methylation status, both in the preparation steps and in the readout (see review by Laird [11]). We focus here mainly on second-generation sequencing-based readouts applied to whole genomes, since the cost of these platforms has dropped dramatically in the past few years and it appears as though their apparent increase in sensitivity [19] and higher genomic coverage may allow them to dominate the discovery genomics market. There are several alternatives for the elucidation of DNA methylation, and these fall into three broad categories: chemical conversion, enzymatic digestion and enrichment of a subpopulation, although combinations of these have been suggested or explored [20]. First, sodium BS conversion of DNA is the gold standard technique, whereby unmethylated cytosines are converted to uracil (read as thymine after PCR) [7] and the converted DNA is then analyzed either by DNA sequencing [9], PCR [21] or restriction enzyme digestion [22]. Second, restriction enzymes that cut genomic DNA in a methylation-specific manner can be used to decompose methylation status in various ways [Robinson MD, Stirzaker C, Statham AL et al.: Evaluation of enrichment-based genome -wide analyses of DNA and methylation: effects og GC amplification bias and copy number variation. Submitted] [23–26]. Finally, researchers can capture the methylated subfraction of the genome using various strategies, such as antibodies to 5-methylcytosine [27] or through methylated binding domain of proteins [14]; we term these approaches as enrichment-based analyses of DNA methylation [13,14,27–31]. The focus in the literature has predominantly been towards methylated cytosines in the CpG dinucleotide context. Other types of DNA methylation exist, such as non-CpG contexts [5] and 5-hydroxymethylcytosine (HMC) [32]. Interestingly, recent investigations have shown that BS-based techniques cannot distinguish between methylated cytosines and HMC [33,34], and capture-based methods, such as immunoprecipitation or methyl-CpG binding domains, do not explicitly detect fragments harboring HMCs [35]. Third-generation sequencing technologies, which are currently in development, promise to distinguish these features directly [36,37].
In considering which DNA methylation platform to adopt, the major criteria often consist of cost, resolution and genome coverage. As one would expect, researchers ‘get what they pay for’, roughly speaking. The method that has the highest coverage and resolution, shotgun genome sequencing after BS treatment [5,38–40], denoted here generically as BS-seq (described as methylC-seq in [5,40] and BS-seq in [41]), comes at a cost that is restrictive for anything but a small number of biological samples. To gain sufficient coverage for two human methylomes, researchers generated approximately two billion (uniquely mapping 100 bp) reads from the Illumina Genome Analyzer (Illumina) [5], while including a large-scale development of infrastructure for warehousing and visualizing the data. This is not an investment either in read depth or length that many research laboratories worldwide can currently make; even with costs of sequencing dropping, there is still a sizeable informatics infrastructure to build and maintain. At the other end of the cost-coverage spectrum, Illumina's Infinium (Illumina, CA, USA) HumanMethylation27 assay is perhaps the most cost-effective technique at single-base resolution; it is a sensitive microarray-based platform that interrogates an a priori chosen set of approximately 27,000 CpG sites [42]. Therefore, this technique only covers approximately 1 in every 1000 CpG sites in the genome, which is hardly a comprehensive characterization of genomic CpG methylation.
There is now a large group of DNA methylation techniques in the middle ground between these two extremes. For an intermediate cost, one can get an intermediate coverage at various levels of resolution. Researchers can reduce the representation, either by targeting specific regions of the genome [16,43] or through methylation-sensitive enzymatic digestion [23,25,26,44]. Alternatively, experimenters can capture only the methylated subset of the genome and identify and compare these populations across multiple samples [13,14,27,30,31]. The arguments for and against these two strategies, as compared among themselves and to the high and low coverage methods mentioned previously, go both ways. On the one hand, it is generally understood that enrichment-based methods operate better in CpG-rich regions of the genome ([45]; also see ‘CpG Density Bias’ section later). While many research questions may still be informative with this potential limitation, there is increasing interest in shifting the focus towards non-CpG-rich regions, such as CpG island shores of the genome [28,46]. On the other hand, targeted analyses are only as good as the techniques used to capture specific regions of the genome [47]. Furthermore, digestion-based approaches are ultimately at the mercy of the genomic location of the restriction sites. The ‘real-world coverage’ of these approaches is discussed in the ‘Coverage Bias’ section later.
It is not clear which platform will emerge to give the most cost-effective and comprehensive methylome coverage. A search for a set of markers, to discover molecular subtypes of cancer, for example, may not require either high resolution or high coverage. In such a case, the most important criteria would be the amount of starting material, since tumor banks generally cannot access large amounts of high quality DNA. The brute force approach of BS-seq requires access to a significant amount of DNA or amplification techniques that generate enough. We have recently observed that such amplification techniques can reduce sensitivity [15]. Some optimizations for the amount of starting material have been made [17], and hopefully, further efficiencies will be introduced and realized for precious DNA sources. For defining cancer subtypes, the emphasis will likely shift to biological replication (i.e. large samples), in order to gain confidence that a particular methylation marker is relevant as a cancer signature.
Biases & bioinformatics
Short-read mapping bias
Short reads from second-generation sequencers are generally used in two distinct ways, either for the position of the mapped sequence or for the sequence itself. We will ignore for the time being the issue of allele-specific information, since that is an additional complexity that few studies have addressed in the context of DNA methylation in a genome-wide fashion, although researchers are beginning to address this [48]. Strictly speaking, allele information could be extracted in conjunction with either position or sequence information. All approaches that involve BS treatment must make use of the sequence, since that is a rich source of information to illuminate cytosine methylation status. Enrichment-based approaches, and enzymatic digestion approaches that are not followed by BS conversion make use only of the position of the mapped reads. More specifically, the data can be represented as a count over a neighbourhood, either in an untargeted fashion (counts in any regions along the genome, e.g., [14]) or a targeted fashion (e.g., reads counts proximal to a known promoter [15]). In a related research stream, many methods have been developed for peak finding along the genome in chromatin immunoprecipitation sequencing (ChIP-seq) datasets [49,50], but it is not clear whether these procedures are appropriate for epigenome studies, since there is no expectation of defined peak shapes.
It has been established that second-generation sequencing is not without its inherent biases, where, for example, the number of reads mapping to a 1-kb region is positively correlated with the GC content of those regions [51]. Figure 1A illustrates this feature for a single lane of Illumina sequencing (randomly fragmented DNA from a normal genome) by splitting the genome into 2-kb regions and showing the distribution of number of reads across equally sized groups of GC content. For applications where the sequence itself is of interest, this may only have an indirect impact, in that the coverage of a particular region is lower at low GC content and the ability to call methylation (or mutation) status is somewhat compromised due to lack of data. But, for analysis procedures that call regions of interest based on their enrichment levels, understanding of this feature, which may change from protocol to protocol and instrument to instrument [52], is rather important. Background models have been proposed that build this into the analysis pipeline (e.g., local Poisson rates [50]), but some of the early peak finders and some procedures to select ‘enriched’ genomic regions in DNA methylation data have not done this, potentially biasing towards regions of higher GC content. It is not exactly clear what the impact this has on the ability to call methylated regions in enrichment-based analyses, and we discuss this further later. Differential analyses, whereby two (groups of) samples are compared are less affected by these genome-position-specific biases. But, we note later that other biases exist (e.g., see ‘Copy number bias’ section), especially in the comparison of cancer methylomes.
Figure 1. Read count by GC content and mappability.
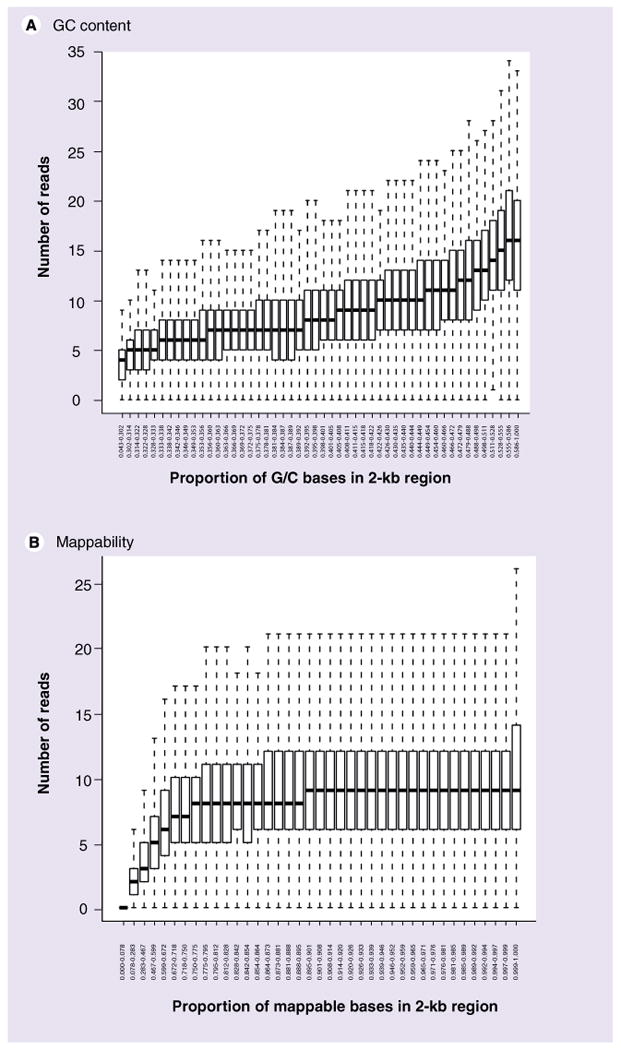
(A) Number of uniquely mapped reads per 2-kb region of a normal prostate genome, stratified into 50 equally-sized groups based on GC content. (B) Number of uniquely mapped reads per 2-kb region of a normal prostate genome, stratified into 50 equally-sized groups based on ‘mappability’.
Similarly, the genome cannot be interrogated uniformly. For example, with 36-bp reads, approximately 13% of the positions in the human genome are simply ‘unmappable’; while there are several relevant definitions for mappability [49,53], we use the definition of whether a read can be unambiguously placed at each base in the genome (e.g. mapping all possible reads using Bowtie [54] without mismatches), which is a reflection of the uniqueness of each 36 bp region of the genome (see Online SupplementAry Figures at www.futuremedicine.com/doi/suppl/10.2217/epi.10.36 for details). Fortunately, for investigations where the sequence itself is of primary interest, the coverage of the genome remains high, since neighboring reads can still overlap these unmappable regions. However, it does impose lower coverage for regions of the genome that are locally less mappable. Figure 1B illustrates the number of reads in 2-kb regions of the genome, stratified by the mappability. Even though the mappability calculation does not allow mismatches, this analysis highlights the fact that fewer reads are mapped to regions of lower local mappability. Longer reads decrease the mappability problem (at 50-bp reads, 8% of positions are unmappable) and paired-end (or mate-pair) reads will reduce the problem even further.
The issue of mappability is more extreme for reads from BS-treated DNA, since the degeneracy introduced by converting unmethylated cytosines to thymines effectively reduces the genome to three bases. The methodology used to map such reads does have some effect on this bias [55]. Two main mapping strategies have been employed to date: a degenerate BS genome where cytosine residues in the reference are replaced with the International Union of Pure and Applied Chemistry (IUPAC) symbol Y [101] allowing a match to either cytosine or thymine, or a three-base genome where all cytosines are converted to thymine in both the reference and reads before mapping [5]. The use of a degenerate BS genome [56] introduces a bias (Figure 2); regions of the genome that are identical after conversion of all Cs to Ts can display a difference in their mappability depending on methylation state. In the example shown, the methylated read is uniquely mappable, whereas the unmethylated read would be mapped to multiple locations and therefore discarded, potentially leading to an overcalling of DNA methylation at these loci. By contrast, the three-base BS mapping strategy has methylation information divorced from the reads prior to mapping, and hence, does not exhibit this bias. However, longer reads will reduce these problems.
Figure 2. Mapping bisulfite-converted sequence to a reference genome.

The example shown illustrates the potential methylation-status-specific bias that can be introduced when mapping bisulfite-converted sequences to a degenerate BS genome (left track) or to a 3-base bisulfite-converted genome (right track).
CpG coverage bias
One of the metrics often quoted for genome-wide DNA methylation detection procedures is the number of CpG sites interrogated. These numbers must be accepted with caution, since they can vary drastically not only from method to method, but according to the depth of sequence used, which is a cost consideration for most researchers. Here, we explore the observed CpG coverage for several published studies. This is not a completely fair comparison, but serves for generating discussion of the issues surrounding the problem of interrogating DNA methylation status genome wide with these emerging techniques. Figure 3A shows the decay of the number of CpG sites interrogated at increasingly stringent levels of required coverage, using four publicly available datasets as well as unpublished in-house data using the MethylMiner™ (Invitrogen, CA, USA) protocol on SssI-treated fully methylated DNA (see Online Supplementary Figures at www.futuremedicine.com/doi/suppl/10.2217/epi.10.36 for details). Except for the BS-seq dataset, these comparisons aggregate the coverage observed over multiple samples (see Online Supplementary Figures at www.futuremedicine.com/doi/suppl/10.2217/epi.10.36 for details). Each curve shows the decay of CpG coverage as the required level of coverage increases. It should be understood that ‘covering’ a base is not equivalent across methods. BS-based methods relay single-base methylation information, whereas enrichment-based methods only detect the position and local abundance of the methylated DNA fragments that are captured. In the latter, we do not know the degree of methylation in enriched fragments, unless further interrogated. Another key difference for enrichment-based methods is that we only observe the methylated material, assuming that the capture technique has high specificity. So, the curves presented in Figure 3A for enrichment-based methods can be considered a lower bound on the coverage, since we may be able to enrich other regions of the genome that are simply not methylated in the samples studied. Similarly, deeper sequencing of the methylated DNA fragments may allow other genomic CpG sites to be interrogated. It should also be understood that enrichment-based approaches take advantage of the knowledge of the fragment size selection step (i.e., the mapped reads are extended, see Online Supplementary Figures at www.futuremedicine.com/doi/suppl/10.2217/epi.10.36 for details), assuming this knowledge is available and reliable. Longer fragments give higher coverage, but shorter fragments give higher resolution.
Figure 3. Observed CpG coverage and ‘effciency’ of various DNA methylation analyses.

(A) Total number of genomic CpG sites interrogated at given coverage for several published DNA methylation mapping studies. Dotted lines represent enrichment-based techniques. Solid lines represent bisulfite-based techniques. (B) Observed ‘efficiency’ of methylation mapping (number of CpG sites interrogated per number of uniquely mapping reads). The maximum number of CpG sites interrogated and the number of uniquely mapping reads are shown.
MeDIP-seq: Methylated DNA immunoprecipitation sequencing; MethylC-seq: Whole-genome bisulfite sequencing; MiGS: Methyl CpG binding domain-isolated genome sequencing; RRBS: Reduced representation bisulfite sequencing.
Whether the mapped reads are used for their position or their sequence, having more of them at a certain location gives more evidence and more confidence to the detection of DNA methylation or differential methylation. For BS-based methods, a certain minimum number of reads covering each cytosine base is required to accurately estimate methylation status. For example, Hodges and co-authors [16] required 41 reads to overlap every CpG site in order to satisfy a constraint on the width of their methylation percentage confidence intervals. This is quite stringent, of course, and is only practical in experiments targeting small regions of the genome [16]. However, applying this severe criterion to the first human BS-seq study [5] only reduces the coverage to approximately 8 million CpG sites, which is a testament to the massive effort these researchers have tendered.
One attraction of enrichment-based approaches is that only methylated DNA is captured and sequenced. This brings with it a certain efficiency, since large portions of the genome need not be BS converted and sequenced, ultimately to find little or no methylation. For example, Lister and co-authors generated 1.18 billion uniquely mapping reads (e.g., for IMR90 cells). It should be noted that approximately 670 million of these reads (56%) do not overlap a CpG site and of the remainder that do, a further 17 million result in entirely unmethylated cytosines. The information from the latter class of reads confirms the unmethylated status, but the path to this conclusion is a long and expensive one. For example, BS-seq requires billions of reads to get reasonable genome-wide coverage whereas enrichment-based methods can gather (lower resolution) information using just tens of millions of reads. To highlight the large amount of sequencing effort that is dedicated to interrogating DNA methylation across platforms, we calculated the ratio of number of CpG sites interrogated to the number of uniquely mapping reads, as shown in Figure 3B. This shows a clear ‘efficiency’ advantage for enrichment-based methods, even if the information content is far greater for BS-based methods. We should also note this comparison gives an inherent advantage to methods that operate in CpG-dense regions.
CpG density bias
A bias intimately related to coverage and mapping is that of CpG density. One of the possible arguments against enrichment-based methylation discovery is that it operates more efficiently in the domain of CpG-rich regions, and there is increasing evidence to suggest that CpG sites away from defined islands may have an important biological role, especially in tissue specific expression [46]. A full understanding of affinity enrichment of methylated DNA is limited, but it is clear that the relative enrichment of fragments harboring different CpG densities depends on the technique used, for example MeDIP versus MBD capture approaches [15,39]. Similarly, enzyme-based and BS-based techniques are not immune to the effects of CpG density bias, but we speculate that the differences originate from a different source. To explore this, we calculated the average coverage across a range of local CpG densities for a number of recently published studies, in addition to a fully methylated DNA sample. For local CpG density, we simply calculated the number of CpG sites within 200 bases of all 28 million sites genome-wide and grouped them into approximately 30 groups based on this number. The curves in Figure 4A show average coverage by CpG density, sampling 50,000 sites from each group. It should be noted that the average coverage is related to the overall depth of sequencing, which is different from study to study, but the shape of the curves is somewhat comparable. Figure 4B shows the genome-wide frequencies of the CpG density groups. The results suggest that no method uniformly covers the CpG density space of the genome, underscoring the difficulties of the genome-wide DNA methylation enterprise. We recognize that for enrichment-based data-sets, the shape of the curve (i.e., the distribution of fragments containing methylated CpG sites that are captured and sequenced) is ultimately dependent not only on the technique used [15,39], but also the distribution of methylated CpGs of the genome under study. Extra analyses presented in the Online Supplementary Figures (see www.future-medicine.com/doi/suppl/10.2217/epi.10.36 for details) suggest that the distributions we observed here are reasonably consistent across several methylomes. Our results suggest that Methyl CpG binding domain-isolated genome sequencing (MiGS) is geared towards CpG-rich areas only, more so than competing enrichment-based techniques, such as MeDIP and MBD capture. Meanwhile, the majority of sequencing in a BS-seq experiment is dedicated to CpG sites in isolation or near isolation. Also perhaps, to some extent, mapping of BS-treated DNA selects for this in terms of both lower mappability in lower complexity regions and lower GC content after BS treatment. The reduced representation BS technique [23] appears to select against low CpG density regions, possibly owing to the fragment size selection step. The curves in Figure 4A need to be taken with some caution, since they are a convolution of biological effects, capture and digestion biases (except BS-seq), as well as size selection and sequencing biases. We make this illustration simply to point out that different techniques used to study DNA methylation have different capabilities.
Figure 4. CpG-density-dependent coverage of various DNA methylation analyses.

(A) Average coverage by local CpG density for several published DNA methylation mapping studies. Local CpG density is calculated as the number of CpG sites 200 bases upstream or downstream from every CpG site.
(B) Genome-wide distribution of the local CpG density.
MeDIP-seq: Methylated DNA immunoprecipitation sequencing; MethylC-seq: Whole-genome bisulfite sequencing; MiGS: Methyl CpG binding domain-isolated genome sequencing; RRBS: Reduced representation bisulfte sequencing.
CpG density bias is certainly not new to the field, at least for enrichment-based techniques. Clever bioinformatics strategies have already been devised to account for this bias in microarray studies, either by calibrating the relationship by using a fully methylated sample [30] or using a linear regression coupled with a Bayesian model [29] to more accurately combine information from surrounding CpG sites. The latter has been applied to MeDIP-seq data, while the former could be adapted.
Copy number bias
Genetic variants, and specifically copy number aberrations, are a prominent feature of cancer genomes. When enriching the methylated fraction or fragmenting the genome by enzymatic digestion, regions that are amplified or deleted will be more or less enriched, respectively. The MiGS procedures make no adjustment for copy number, despite analyzing cancer cell lines that commonly have differentially altered genomes [14]. A recent analysis of the MeDIP-seq data excluded known amplified regions of the genome [13], stating they ‘excluded these (known regions of amplification) from the analysis as they might result in failure to identify regions with hypermethylation’. We show here that this is an unnecessary filtering of data and propose that integrating copy number data would provide a more satisfying analysis of the available data. Figure 5A highlights the many copy number aberrations along chromosome 20 for the MCF7 breast cancer cell line, according to data from the Sanger Cancer Genome Project [57,58]. Figure 5 B & C show normalized log-ratios of read counts in 20-kb bins for MeDIP-seq and input sequencing data, respectively (data from Ruike et al. [13]). The concordance between number of copies and methylated DNA enrichment suggests that detection of differentially methylated regions will need to integrate copy number information, especially in the analysis of cancer samples. Further research is required to explicitly integrate these datasets.
Figure 5. Copy number bias in enrichment-based analyses of DNA methylation.
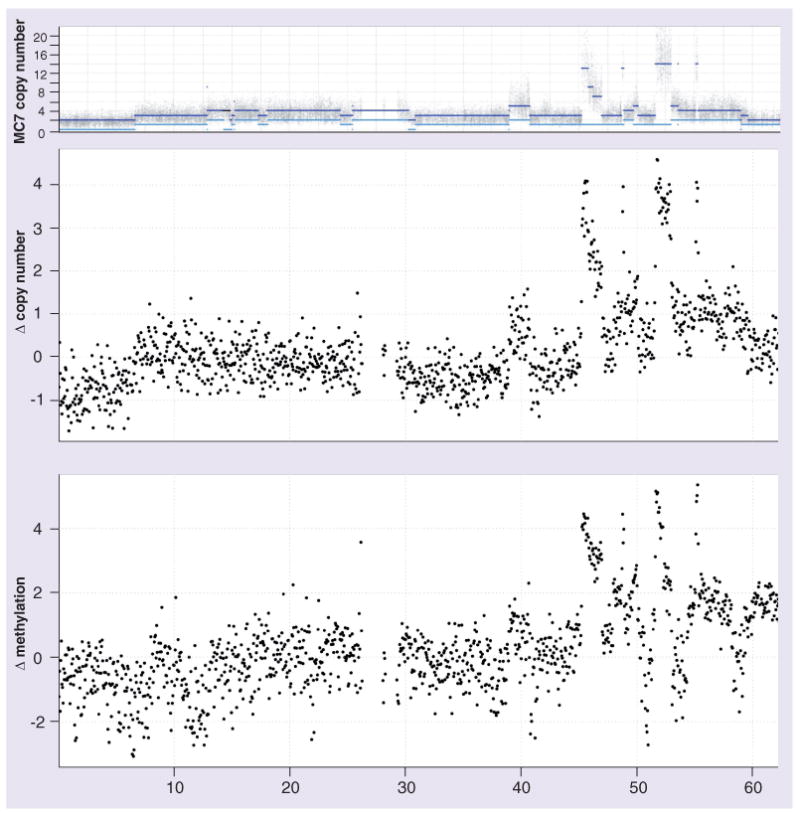
(A) Copy number estimates of MCF7 breast cancer cell line analyzed by the PICNIC algorithm [57] across human chromosome 20 (data from Sanger Cancer Genome Project [102]). (B) Log-ratios of library-size-normalized read counts between input sequencing data for MCF7 and human mammary epithelial cell (HMEC) line at 20 kb nonoverlapping intervals (data from [13]). (C) Log-ratios of library-size-normalized read counts between methylated DNA immunoprecipitation-sequencing data for MCF7 and HMEC line at 20 kb nonoverlapping intervals (data from [13]).
Methods that garner information from the sequence are less affected by copy number bias, giving higher coverage in amplified regions and lower (or no) coverage in deleted regions. But, for enrichment- and enzyme-based methods not involving a BS conversion, the implication is that copy number data needs to accompany the methylation data for these procedures to accurately account for the bias. It is worth noting that other epigenomic enrichment-based data-sets, such as those involving chromatin immunoprecipitation, will be affected in the same manner. The extent to which this influences the calling of enriched regions of the genome is unknown.
Charting ahead
Few formal comparisons have been made between competing techniques that elucidate DNA methylation status, although initial studies are beginning to appear [15,39]. Thus, an important area of further investigation, independent of applying these techniques for biological discovery, is comparing the approaches according to sensitivity, specificity, cost, coverage and GC bias. A deeper understanding of the limitations of these assays will ultimately lead to improvements in the accuracy of existing protocols. In order to make these comparisons, samples of the same and known origin (e.g., fully methylated DNA) should be tested on all platforms, and false-positive and false-negative rates estimated. This also gives an opportunity to benchmark the performance of existing statistical procedures and facilitate improvements to the informatics tools across the entire sequencing data analysis pipeline. The unprecedented detail reported in the first single-base methylome study [5] or the other reference methylomes recently created [38,39] could be used to benchmark improved or newly developed DNA methylation techniques.
Discussion
The developments of the last few years, especially in second-generation sequencing, have led to an explosion of techniques for studying genome-wide DNA methylation. There is no question that DNA methylation profiles will be abundantly catalogued at high resolution in the near future, but there is still a long way to go to understand the biological relevance of methylation patterns and the alterations that occur in development and disease. For researchers selecting a DNA methylation method, some of the many considerations include cost, coverage, amount of starting material, resolution, labor involved and most importantly the biological question being addressed. In this article, we highlighted the fact that no DNA methylation assay is truly unbiased, despite optimistic claims in the literature. We illustrated the association of read density with GC content and mappability, which need to be accounted for when determining ‘enriched’ regions. Because of the CpG-density-dependent coverage, different techniques will lead to a different view of the methylome. We highlighted biases that arise in mapping BS-converted reads, and that whole genome BS-seq consumes the majority of its sequencing capacity outside of the CpG context. Furthermore, copy number of the underlying genome will have a direct effect on the data from some assays, and especially in studies from diseased cells.
Which genome-wide DNA methylation technique gives the highest return on investment? This question does not have a clear answer at this point in time. BS-seq gives unprecedented detail about the methylome, but the cost is prohibitive and the efficiency for extracting information about CpG methylation is low: longer reads are needed to get the same mappability, and considerable sequencing effort is dedicated to unmethylated cytosines. All other proposed methods trade-off coverage or resolution to obtain an acceptable cost. Perhaps, the most efficient approach is a hybrid technique that BS treats and sequences only the methylated fraction of the genome.
Do we need single-base resolution? We know that the DNA methylation is often highly correlated in a local region [59]. If this is generally true, a more effective use of sequencing resources would be to study bona-fide biological variation, as opposed to the intimate detail of individual CpG sites throughout the entire genome, many of which may be biological noise. This question will need to be answered more thoroughly, given the associated cost and infrastructure involved with achieving single-base resolution genome-wide. The International Human Epigenome Consortium (IHEC) [60] aims to provide normal genome methylation reference maps at single base resolution, and these maps will provide an invaluable resource to determine if a particular region of the genome requires more detailed mapping in different biological studies.
With third-generation sequencing technologies promising that they can distinguish methylated from unmethylated cytosines directly on single molecules [36,37], some might argue that researchers should wait and many of the problems discussed in this note will disappear. Of course, this ‘watch and wait’ argument can always be used for any new technology and, as single molecule direct sequencing is still in active development with an unknown cost for everyday use, we realize that waiting is not always a practical or productive option. It is quite clear, however, that epigenetic research will benefit from the promised sensitivity of third-generation sequencing technologies, and a more precise understanding of the methylome will emerge.
Future perspective
The field of epigenomics has finally come of age with the advent of new sequencing technologies, and consequently is experiencing a period of substantial growth. New strategies for interrogating epigenetic marks, especially DNA methylation profiles, are still not able to map the genome in its entirety due to inherent biases for each approach. While many of these biases may remain, understanding the limitations and advantages of each technique will increase, allowing more accurate interpretation of the epigenome. The future of DNA methylation analysis is single molecule sequencing of individual CpG residues that will allow a deeper insight into the subtle changes in methylation that are associated with tissue specific gene regulation in development. The prospect that the epigenome is the interactive interface between the genome and the environment, where DNA methylation perturbations may occur in response to environmental exposures such as diet, stress, infection and environmental carcinogens can also now be accurately addressed with this technology. These future studies are critical to our understanding of the complexity of epigenomics, but will require cheaper, high-resolution techniques that can be applied to large-scale studies across different cell and disease types.
Supplementary Material
Acknowledgments
We thank Matthew Wakefield for helpful discussions of the technologies and data analysis, Dario Strbenac for technical assistance with the public sequencing datasets, Clare Stirzaker and Jenny Song for contributing the experiments using fully methylated DNA, and Rebecca Hinshelwood and Kate Patterson for the careful reading of the manuscript.
This work is funded by National Health and Medical Res Council (NH & MRC) project (427614, 481347) (MDR, CS, DS) and Fellowship (SJC), Cancer Institute of New South Wales grants (CINSW: SJC; ALS), National Institute of Health grant 5R01 GM083084-03 (TPS) and National Breast Cancer Foundation Program Grant (SJC).
Footnotes
Financial & competing interests disclosure: The authors have no other relevant affiliations or financial involvement with any organization or entity with a financial interest in or financial conflict with the subject matter or materials discussed in the manuscript apart from those disclosed.
No writing assistance was utilized in the production of this manuscript.
Bibliography
Papers of special note have been highlighted as:
▪ of interest
▪▪ of considerable interest
- 1.Clark SJ, Melki J. DNA methylation and gene silencing in cancer: which is the guilty party? Oncogene. 2002;21:5380–5387. doi: 10.1038/sj.onc.1205598. [DOI] [PubMed] [Google Scholar]
- 2.Jones PA, Baylin SB. The epigenomics of cancer. Cell. 2007;128:683–692. doi: 10.1016/j.cell.2007.01.029. [DOI] [PMC free article] [PubMed] [Google Scholar]
- 3.Gardiner-Garden M, Frommer M. CpG islands in vertebrate genomes. J Mol Biol. 1987;196:261–282. doi: 10.1016/0022-2836(87)90689-9. [DOI] [PubMed] [Google Scholar]
- 4.Clark SJ, Harrison J, Frommer M. CpNpG methylation in mammalian cells. Nat Genet. 1995;10:20–27. doi: 10.1038/ng0595-20. [DOI] [PubMed] [Google Scholar]
- 5.Lister R, Pelizzola M, Dowen RH, et al. Human DNA methylomes at base resolution show widespread epigenomic differences. Nature. 2009;462:315–322. doi: 10.1038/nature08514. [DOI] [PMC free article] [PubMed] [Google Scholar]; ▪▪ First single-base resolution methylome using whole-genome shotgun bisulfite (BS) sequencing.
- 6.Frommer M, McDonald LE, Millar DS, et al. A genomic sequencing protocol that yields a positive display of 5-methylcytosine residues in individual DNA strands. Proc Natl Acad Sci USA. 1992;89:1827–1831. doi: 10.1073/pnas.89.5.1827. [DOI] [PMC free article] [PubMed] [Google Scholar]
- 7.Clark SJ, Harrison J, Paul CL, Frommer M. High sensitivity mapping of methylated cytosines. Nucleic Acids Res. 1994;22:2990–2997. doi: 10.1093/nar/22.15.2990. [DOI] [PMC free article] [PubMed] [Google Scholar]
- 8.Grigg G, Clark S. Sequencing 5-methylcytosine residues in genomic DNA. Bioessays. 1994;16:431–436. doi: 10.1002/bies.950160612. [DOI] [PubMed] [Google Scholar]
- 9.Clark SJ, Statham A, Stirzaker C, Molloy PL, Frommer M. DNA methylation: bisulphite modification and analysis. Nat Protoc. 2006;1:2353–2364. doi: 10.1038/nprot.2006.324. [DOI] [PubMed] [Google Scholar]
- 10.Warnecke PM, Stirzaker C, Melki JR, Millar DS, Paul CL, Clark SJ. Detection and measurement of PCR bias in quantitative methylation analysis of bisulphite-treated DNA. Nucleic Acids Res. 1997;25:4422–4426. doi: 10.1093/nar/25.21.4422. [DOI] [PMC free article] [PubMed] [Google Scholar]
- 11.Laird PW. Principles and challenges of genome-wide DNA methylation analysis. Nat Rev Genet. 2010;11:191–203. doi: 10.1038/nrg2732. [DOI] [PubMed] [Google Scholar]; ▪ Recent and comprehensive review of DNA methylation analysis techniques.
- 12.Pelizzola M, Koga Y, Urban AE, et al. MEDME: an experimental and analytical methodology for the estimation of DNA methylation levels based on microarray derived MeDIP-enrichment. Genome Res. 2008;18:1652–1659. doi: 10.1101/gr.080721.108. [DOI] [PMC free article] [PubMed] [Google Scholar]
- 13.Ruike Y, Imanaka Y, Sato F, Shimizu K, Tsujimoto G. Genome-wide analysis of aberrant methylation in human breast cancer cells using methyl-DNA immunoprecipitation combined with high-throughput sequencing. BMC Genomics. 2010;11:137. doi: 10.1186/1471-2164-11-137. [DOI] [PMC free article] [PubMed] [Google Scholar]
- 14.Serre D, Lee B, Ting A. MBD-isolated genome sequencing provides a high-throughput and comprehensive survey of DNA methylation in the human genome. Nucleic Acids Res. 2009;38:391–399. doi: 10.1093/nar/gkp992. [DOI] [PMC free article] [PubMed] [Google Scholar]
- 15.Irizarry RA, Ladd-Acosta C, Carvalho B, et al. Comprehensive high-throughput arrays for relative methylation (CHARM) Genome Res. 2008;18:780–790. doi: 10.1101/gr.7301508. [DOI] [PMC free article] [PubMed] [Google Scholar]
- 16.Hodges E, Smith A, Kendall J, et al. High definition profiling of mammalian DNA methylation by array capture and single molecule bisulfite sequencing. Genome Res. 2009;19:1593–1605. doi: 10.1101/gr.095190.109. [DOI] [PMC free article] [PubMed] [Google Scholar]
- 17.Quail MA, Kozarewa I, Smith F, et al. A large genome center's improvements to the Illumina sequencing system. Nat Meth. 2008;5:1005–1010. doi: 10.1038/nmeth.1270. [DOI] [PMC free article] [PubMed] [Google Scholar]
- 18.Quackenbush J. Microarray data normalization and transformation. Nat Genet. 2002;32(Suppl):496–501. doi: 10.1038/ng1032. [DOI] [PubMed] [Google Scholar]
- 19.‘t Hoen PA, Ariyurek Y, Thygesen HH, et al. Deep sequencing-based expression analysis shows major advances in robustness, resolution and inter-lab portability over five microarray platforms. Nucleic Acids Res. 2008;36:e141. doi: 10.1093/nar/gkn705. [DOI] [PMC free article] [PubMed] [Google Scholar]
- 20.Lister R, Ecker JR. Finding the fifth base: genome-wide sequencing of cytosine methylation. Genome Res. 2009;19:959–966. doi: 10.1101/gr.083451.108. [DOI] [PMC free article] [PubMed] [Google Scholar]
- 21.Herman JG, Graff JR, Myohanen S, Nelkin BD, Baylin SB. Methylation-specific PCR: a novel PCR assay for methylation status of CpG islands. Proc Natl Acad Sci USA. 1996;93:9821–9826. doi: 10.1073/pnas.93.18.9821. [DOI] [PMC free article] [PubMed] [Google Scholar]
- 22.Xiong Z, Laird PW. COBRA: a sensitive and quantitative DNA methylation assay. Nucleic Acids Res. 1997;25:2532–2534. doi: 10.1093/nar/25.12.2532. [DOI] [PMC free article] [PubMed] [Google Scholar]
- 23.Gu H, Bock C, Mikkelsen TS, et al. Genome-scale DNA methylation mapping of clinical samples at single-nucleotide resolution. Nat Meth. 2010;7:133–136. doi: 10.1038/nmeth.1414. [DOI] [PMC free article] [PubMed] [Google Scholar]; ▪ Combination of enzymatic digestion with bisulphite treatment and sequencing.
- 24.Lippman Z, Gendrel AV, Colot V, Martienssen R. Profiling DNA methylation patterns using genomic tiling microarrays. Nat Meth. 2005;2:219–224. doi: 10.1038/nmeth0305-219. [DOI] [PubMed] [Google Scholar]
- 25.Oda M, Glass J, Thompson R, et al. High-resolution genome-wide cytosine methylation profiling with simultaneous copy number analysis and optimization for limited cell numbers. Nucleic Acids Res. 2009;37:3829–3839. doi: 10.1093/nar/gkp260. [DOI] [PMC free article] [PubMed] [Google Scholar]
- 26.Oda M, Greally JM. The HELP assay. Methods Mol Biol. 2009;507:77–87. doi: 10.1007/978-1-59745-522-0_7. [DOI] [PubMed] [Google Scholar]
- 27.Weber M, Davies JJ, Wittig D, et al. Chromosome-wide and promoter-specific analyses identify sites of differential DNA methylation in normal and transformed human cells. Nat Genet. 2005;37:853–862. doi: 10.1038/ng1598. [DOI] [PubMed] [Google Scholar]; ▪ First large-scale study of captured methylated DNA fragments in combination with microarrays.
- 28.Doi A, Park I, Wen B, et al. Differential methylation of tissue- and cancer-specific CpG island shores distinguishes human induced pluripotent stem cells, embryonic stem cells and fibroblasts. Nat Genet. 2009;41:1350–1353. doi: 10.1038/ng.471. [DOI] [PMC free article] [PubMed] [Google Scholar]
- 29.Down T, Rakyan V, Turner D, et al. A Bayesian deconvolution strategy for immunoprecipitation-based DNA methylome analysis. Nat Biotechnol. 2008;26:779–785. doi: 10.1038/nbt1414. [DOI] [PMC free article] [PubMed] [Google Scholar]
- 30.Pelizzola M, Koga Y, Urban A, et al. MEDME: an experimental and analytical methodology for the estimation of DNA methylation levels based on microarray derived MeDIP-enrichment. Genome Res. 2008;18:1652–1659. doi: 10.1101/gr.080721.108. [DOI] [PMC free article] [PubMed] [Google Scholar]
- 31.Weber M, Hellmann I, Stadler MB, et al. Distribution, silencing potential and evolutionary impact of promoter DNA methylation in the human genome. Nat Genet. 2007;39:457–466. doi: 10.1038/ng1990. [DOI] [PubMed] [Google Scholar]
- 32.Kriaucionis S, Heintz N. The nuclear DNA base 5-hydroxymethylcytosine is present in Purkinje neurons and the brain. Science. 2009;324:929–930. doi: 10.1126/science.1169786. [DOI] [PMC free article] [PubMed] [Google Scholar]
- 33.Huang Y, Pastor WA, Shen Y, Tahiliani M, Liu DR, Rao A. The behaviour of 5-hydroxymethylcytosine in bisulfite sequencing. PLOS ONE. 2010;5:E8888. doi: 10.1371/journal.pone.0008888. [DOI] [PMC free article] [PubMed] [Google Scholar]
- 34.Nestor C, Ruzov A, Meehan RR, Dunican DS. Enzymatic approaches and bisulfite sequencing cannot distinguish between 5-methylcytosine and 5-hydroxymethylcytosine in DNA. Biotechniques. 2010;48:317–319. doi: 10.2144/000113403. [DOI] [PubMed] [Google Scholar]
- 35.Jin SG, Kadam S, Pfeifer GP. Examination of the specificity of DNA methylation profiling techniques towards 5-methylcytosine and 5-hydroxymethylcytosine. Nucleic Acids Res. 2010;38(11):E125. doi: 10.1093/nar/gkq223. [DOI] [PMC free article] [PubMed] [Google Scholar]
- 36.Clarke J, Wu HC, Jayasinghe L, Patel A, Reid S, Bayley H. Continuous base identification for single-molecule nanopore DNA sequencing. Nat Nanotechnol. 2009;4:265–270. doi: 10.1038/nnano.2009.12. [DOI] [PubMed] [Google Scholar]; ▪▪ Proof of principle that nanopore sequencing can directly distinguish methylated from unmethylated cytosines.
- 37.Flusberg BA, Webster DR, Lee JH, et al. Direct detection of DNA methylation during single-molecule, real-time sequencing. Nat Methods. 2010;7:461–465. doi: 10.1038/nmeth.1459. [DOI] [PMC free article] [PubMed] [Google Scholar]; ▪▪ Proof of principle that single-molecule real-time sequencing can directly distinguish the 4 DNA bases from methyladenine, 5-methylcytosine and 5-hydroxymethylcytosine.
- 38.Laurent L, Wong E, Li G, et al. Dynamic changes in the human methylome during differentiation. Genome Res. 2010;20:320–331. doi: 10.1101/gr.101907.109. [DOI] [PMC free article] [PubMed] [Google Scholar]
- 39.Li N, Ye M, Li Y, et al. Whole genome DNA methylation analysis based on high throughput sequencing technology. Methods. 2010 doi: 10.1016/j.ymeth.2010.04.009. Epub ahead of print. [DOI] [PubMed] [Google Scholar]; ▪ One of the first large-scale comparisons of enrichment-based techniques.
- 40.Lister R, O’Malley RC, Tonti-Filippini Highly integrated single-base resolution maps of the epigenome in Arabidopsis. Cell. 2008;133:523–536. doi: 10.1016/j.cell.2008.03.029. [DOI] [PMC free article] [PubMed] [Google Scholar]
- 41.Cokus SJ, Feng S, Zhang X, et al. Shotgun bisulphite sequencing of the Arabidopsis genome reveals DNA methylation patterning. Nature. 2008;452:215–219. doi: 10.1038/nature06745. [DOI] [PMC free article] [PubMed] [Google Scholar]
- 42.Bibikova M, Le J, Barnes B, et al. Genome-wide DNA methylation profiling using Infinium assay. Epigenomics. 2009;1:177–200. doi: 10.2217/epi.09.14. [DOI] [PubMed] [Google Scholar]; ▪ Description of the single-base resolution microarray strategy.
- 43.Ball MP, Li JB, Gao Y, et al. Targeted and genome-scale strategies reveal gene-body methylation signatures in human cells. Nat Biotechnol. 2009;27:361–368. doi: 10.1038/nbt.1533. [DOI] [PMC free article] [PubMed] [Google Scholar]; ▪ First description of large-scale targeted DNA methylation analyses in combination with sequencing.
- 44.Suzuki M, Jing Q, Lia D, Pascual M, McLellan A, Greally JM. Optimized design and data analysis of tag-based cytosine methylation assays. Genome Biol. 2010;11:R36. doi: 10.1186/gb-2010-11-4-r36. [DOI] [PMC free article] [PubMed] [Google Scholar]
- 45.Jeddeloh JA, Greally JM, Rando OJ. Reduced-representation methylation mapping. Genome Biol. 2008;9:231. doi: 10.1186/gb-2008-9-8-231. [DOI] [PMC free article] [PubMed] [Google Scholar]
- 46.Irizarry RA, Ladd-Acosta C, Wen B, et al. The human colon cancer methylome shows similar hypo- and hypermethylation at conserved tissue-specific CpG island shores. Nat Genet. 2009;41:178–186. doi: 10.1038/ng.298. [DOI] [PMC free article] [PubMed] [Google Scholar]
- 47.Mamanova L, Coffey AJ, Scott CE, et al. Target-enrichment strategies for next-generation sequencing. Nat Meth. 2010;7:111–118. doi: 10.1038/nmeth.1419. [DOI] [PubMed] [Google Scholar]
- 48.Shoemaker R, Deng J, Wang W, Zhang K. Allele-specific methylation is prevalent and is contributed by CpG-SNPs in the human genome. Genome Res. 2010;20(7):883–889. doi: 10.1101/gr.104695.109. [DOI] [PMC free article] [PubMed] [Google Scholar]
- 49.Rozowsky J, Euskirchen G, Auerbach RK, et al. PeakSeq enables systematic scoring of ChIP-seq experiments relative to controls. Nat Biotechnol. 2009;27:66–75. doi: 10.1038/nbt.1518. [DOI] [PMC free article] [PubMed] [Google Scholar]
- 50.Zhang Y, Liu T, Meyer CA, et al. Model-based analysis of ChIP-Seq (MACS) Genome Biol. 2008;9:R137. doi: 10.1186/gb-2008-9-9-r137. [DOI] [PMC free article] [PubMed] [Google Scholar]
- 51.Dohm JC, Lottaz C, Borodina T, Himmelbauer H. Substantial biases in ultra-short read data sets from high-throughput DNA sequencing. Nucleic Acids Res. 2008;36:E105. doi: 10.1093/nar/gkn425. [DOI] [PMC free article] [PubMed] [Google Scholar]
- 52.Harismendy O, Ng PC, Strausberg RL, et al. Evaluation of next generation sequencing platforms for population targeted sequencing studies. Genome Biol. 2009;10:R32. doi: 10.1186/gb-2009-10-3-r32. [DOI] [PMC free article] [PubMed] [Google Scholar]
- 53.Campbell PJ, Stephens PJ, Pleasance ED, et al. Identification of somatically acquired rearrangements in cancer using genome-wide massively parallel paired-end sequencing. Nat Genet. 2008;40:722–729. doi: 10.1038/ng.128. [DOI] [PMC free article] [PubMed] [Google Scholar]
- 54.Langmead B, Trapnell C, Pop M, Salzberg SL. Ultrafast and memory-efficient alignment of short DNA sequences to the human genome. Genome Biol. 2009;10:R25. doi: 10.1186/gb-2009-10-3-r25. [DOI] [PMC free article] [PubMed] [Google Scholar]
- 55.Zhang MQ, Smith AD. Challenges in understanding genome-wide DNA methylation. J Comput Sci Technol. 2010;25:26–34. [Google Scholar]
- 56.Smith AD, Chung WY, Hodges E, et al. Updates to the RMAP short-read mapping software. Bioinformatics. 2009;25:2841–2842. doi: 10.1093/bioinformatics/btp533. [DOI] [PMC free article] [PubMed] [Google Scholar]
- 57.Greenman CD, Bignell G, Butler A, et al. PICNIC: an algorithm to predict absolute allelic copy number variation with microarray cancer data. Biostatistics. 2010;11:164–175. doi: 10.1093/biostatistics/kxp045. [DOI] [PMC free article] [PubMed] [Google Scholar]
- 58.Forbes SA, Tang G, Bindal N, et al. COSMIC (the catalogue of somatic mutations in cancer): a resource to investigate acquired mutations in human cancer. Nucleic Acids Res. 2010;38:D652–D657. doi: 10.1093/nar/gkp995. [DOI] [PMC free article] [PubMed] [Google Scholar]
- 59.Eckhardt F, Lewin J, Cortese R, et al. DNA methylation profiling of human chromosomes 6, 20 and 22. Nat Genet. 2006;38:1378–1385. doi: 10.1038/ng1909. [DOI] [PMC free article] [PubMed] [Google Scholar]
- 60.Time for the epigenome. Nature. 2010;463(7281):587. doi: 10.1038/463587a. [DOI] [PubMed] [Google Scholar]
Websites
- 101.IUPAC Codes. www.bioinformatics.org/sms/iupac.html.
- 102.Sanger Cancer Genome Project. www.sanger.ac.uk/genetics/CGP/
Associated Data
This section collects any data citations, data availability statements, or supplementary materials included in this article.