

Abstract
Purpose
To characterize the spatial pattern of cerebral ischemic vulnerability to hypoperfusion in stroke patients.
Methods
We included 90 patients who underwent admission CT perfusion (CTP) and MRI within 12 hours of ischemic stroke onset. Infarcted brain lesions (“core”) were segmented from admission diffusion-weighted-imaging (DWI), and - along with the CTP parameter maps - coregistered onto MNI-152 brain space, which was parcellated into 125 mirror cortical and subcortical regions per hemisphere. We tested the hypothesis that the percent infarction increment per unit relative cerebral blood flow (rCBF) reduction differs statistically between regions using regression analysis to assess the interaction between regional rCBF and region variables. Next, for each patient, a “vulnerability index” (VI) map was constructed with voxel values equaling the product of that voxel’s rCBF and infarction probability (derived from the MNI-152-transformed, binary, segmented DWI lesions). Voxel-based rCBF threshold for core was determined within the upper 20th percentile of VI map voxel values.
Results
Different regions had different percent infarction increase per unit rCBF reduction (p=0.001). The caudate body, putamen, insular ribbon, paracentral lobule, precentral, middle and inferior frontal gyri had the highest ischemic vulnerability to hypoperfusion. A voxel-based rCBF threshold of <0.42 optimally distinguished infarct core in the highly-vulnerable regions, whereas rCBF <0.16 distinguished core in the remainder of the brain.
Conclusion
We demonstrated regional ischemic vulnerability of the brain to hypoperfusion in acute stroke patients. Location specific - rather than whole-brain - rCBF thresholds may provide a more accurate metric for estimating infarct core using CTP maps.
Keywords: Stroke, Compute tomography, Magnetic resonance imaging
Introduction
There are many factors determining the fate of hypoperfused brain following embolic stroke, including the severity of blood flow reduction, the degree of collateral flow, the time since onset, and the regional sensitivity of the brain to hypoperfusion. Certain brain areas with high baseline metabolic activity, such as the hippocampal CA1 region, are extremely susceptible to reduced oxygen and glucose.1 It is well-documented that different cellular constituents in gray matter (GM) and white matter (WM) are associated with different levels of cerebral blood flow (CBF) and metabolism, providing support for variable vulnerability to hypoperfusion.1
Although selective regional ischemic vulnerability has been previously studied, the neuroimaging correlates of this spatial heterogeneity are not established. Determining regional sensitivity can help predict the fate of hypoperfused tissue at highest risk for infarction (ischemic penumbra). Moreover, less vulnerable brain regions may tolerate ischemia for longer times-post-ictus, and hence be responsive to delayed therapeutic interventions.
In our study, we evaluated regional ischemic vulnerability of the brain to hypoperfusion in acute stroke patients using admission CT perfusion (CTP) and MRI-DWI scans. CTP is well suited to quantification of CBF, given the linear relationship between IV contrast concentration and CT pixel intensity. First we performed a regional analysis, examining differences in local percent infarction increment per unit reduction of blood flow, in order to establish the presence of, and determine the locations of, variable ischemic sensitivity. Next, we constructed a voxel-based “vulnerability map”, in order to visualize this spatial heterogeneity, and to determine the voxel-based CTP blood flow thresholds that optimally correlate with infarct core.
Methods and Materials
Patients
Records of all stroke patients who underwent admission CTP and MRI at our center between May 2008 and June 2009 were reviewed. Inclusion criteria were: unilateral first-ever ischemic stroke; admission CTP and MR-DWI scans acquired within 12 hours of symptom onset and within 3 hours of each other; and the absence of any previous brain abnormalities based on admission MRI and clinical history. Our study received institutional review board approval and was compliant with the “Health Insurance Portability and Accountability Act”.
Image acquisition
All CT scans were obtained with a multidetector helical scanner (Light Speed; GE Medical Systems, Milwaukee, WI). CTP followed non-contrast CT and CT angiography, comprising a 90-second shuttle-mode acquisition, one image per slice every 3 seconds, after IV administration of 35 ml non-ionic iodinated contrast (7 ml/sec). Acquisition parameters were 80 kVp and 200 mAs, covering an 8-cm axial section – 16 adjacent 5-mm slices. Total radiation dose was less than 450 mSv, below the 500 mSv FDA recommended upper limit.2 CTP source images were transferred to a GE Advantage workstation for post-processing using deconvolution-based commercial software (CT Perfusion 3, General Healthcare, Milwaukee, WI), without application of vessel-suppression algorithms. A single reference arterial input function was selected semi-automatically as described previously.3
MR imaging was performed on a 1.5 Tesla Signa scanner (GE Medical Systems, Milwaukee, WI). Our standard stroke MR protocol includes a DWI sequence with two 180-degree pulses to reduce eddy-current- distortions. TR was 5000 ms; TE was minimum. Axial images were acquired with 5 mm slice thickness, and 1 mm interslice gap.
Image analysis
For MRI, we manually segmented infarct core on admission DWI, and developed a binary imaging dataset where all voxels inside the infarct core were assigned a value of “1”, and voxels outside of the core assigned a value of “0”. These binary DWI-lesion maps, along with the CTP parameter maps, were automatically co-registered to the MNI-152 brain space using FLIRT v5.5 (FMRIB’s Linear Image Registration Tool).
Two series of analyses were next performed, “region-based” and “voxel-based”. The former was used to detect differences in regional percent infarction increment per unit reduction of blood flow, in order to establish the presence of regionally variable ischemic sensitivity in the brain. For the region-based analyses, the CTP and binary DWI lesion images were automatically parcellated into 125 pairs of symmetrical, mirror cortical and sub-cortical regions, based on the established Talairach atlas, using custom-written software programs. Next, the percent infarction and relative CBF (rCBF) were calculated for each transformed region in the symptomatic hemisphere. Linear non-rigid co-registration (transformation) of the binary DWI voxel values (0 or 1) to the MNI-152 brain space resulted in assigned fractional voxel values between 0 and 1, reflecting the probability of infarction for that voxel.4 As the voxels of differently shaped brains map (spatially transform) to slightly different voxel co-ordinates on the MNI-152, a single dichotomized value for the presence or absence of infarction becomes inappropriate. Regional percent infarction was defined as the mean of the infarction probability voxel values for each Talairach-defined region. The rCBF value for each region was determined as the ratio of the mean absolute CBF of that region in the symptomatic hemisphere, divided by the mean absolute CBF of the corresponding contralateral mirror region.
Voxel-based “vulnerability maps” were constructed for each patient in the MNI-152 space. The voxel-based rCBF values were calculated in an analogous manner to the regional values. For each voxel, the “vulnerability index” (VI) was defined as the product of the voxel-based rCBF value and the probability of infarction in that voxel. Thus, voxels with a high probability of infarction despite high rCBF had the highest VI values; whereas voxels with low probability of infarction despite low ischemic flow had the lowest VI values. The “vulnerability map” voxel values for each patient were overlaid onto the MNI-152 brain space, and mean VI values per voxel were calculated across all patients.
In order to demonstrate the spatial distribution of cerebral infarction in our patients, we developed an MNI-152-based brain map where each voxel value equaled the mean infarction probability in that particular voxel, stratified by quintiles.
Statistical analysis
In a pooled regression analysis, we first evaluated whether there was a linear relationship between the regional rCBF and percent infarction across all regions and patients. Then, multivariate regression analysis was applied to the region-based dataset to test the hypothesis that percent infarction increment per unit rCBF reduction differs statistically between the 125 paired parcellated brain regions. A regression model was constructed correlating percent infarct volume within each brain region with the following input variables; (1) regional rCBF, (2) an arbitrary categorical variable representing each region, and (3) an interaction term between the first two variables. A significant p-value in the interaction term of the model (“rCBF×Region”) would support the hypothesis that percent infarct volume increment per unit rCBF reduction differs statistically between the brain regions.
We determined the brain regions with highest ischemic vulnerability using simple linear regression. For each region, the linear regression equation correlating regional percent infarction with regional rCBF was calculated. The slope of the regression line, B, reflects the increase in regional percent infarction per unit reduction in blood flow (higher slopes (|B|) suggest greater ischemic vulnerability).
For the voxel-based analyses, we determined the optimal pooled voxel-based rCBF thresholds that could distinguish infarct core from non-infarcted brain on the segmented admission DWI scans, using receiver operating characteristics (ROC) curve analysis. First, we determined the optimal threshold at the operating point of the ROC curve for the pooled voxels located within the upper 20th percentile of the VI voxel values on the mean “vulnerability map”. Next, we determined the threshold for the pooled voxels in the remainder of the brain.
All values were expressed as either percentages or means ± standard deviation (SD). Statistical analyses were performed using STATA-10 (Stata, College Station, TX).
Results
We included 90 patients with acute first-ever unilateral stroke. Of these, 51 (57%) had left hemispheric stroke, and 54 (60%) were male. Based on the admission CTA imaging reports, 72 (80%) patients had anterior circulation arterial occlusion (7 anterior cerebral artery, remainder middle cerebral artery, MCA), 6 (7%) had posterior circulation occlusion, and 12 (13%) had no visible occlusion. The majority of patients in our study had infarction in the MCA territory (Figure 1). Admission CTP scans were performed 0.5–8.5 hours after stroke onset (mean: 3.7±2.0), and MRI scans followed CTP within 0.2–2.7 hours (mean: 0.4±0.3).
Figure 1.
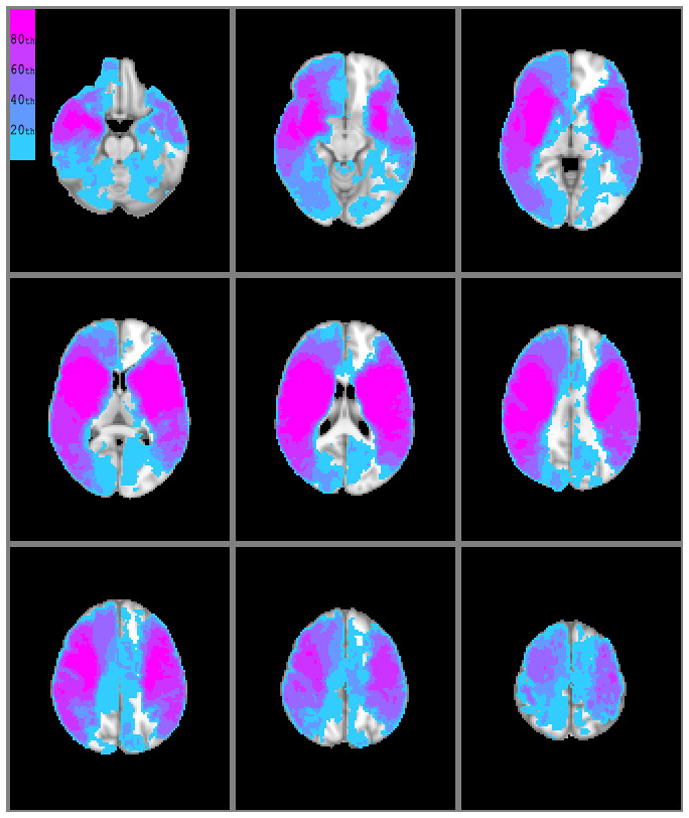
Topographic distribution of infarction in our patients; voxel values reflect the mean probability of infarction for that voxel across all patients. Color scale is based on stratification by quintile groupings.
There was a significant linear relationship between regional percent infarction and rCBF across all regions and patients (R2=0.35, p<0.001).
The multivariate regression model showed a strongly significant interaction between rCBF and the region variables confirming that regional percent infarction increment per unit rCBF reduction differs statistically between parcellated regions (p<0.001, Table 1), and hence that ischemic vulnerability varies between locations.
Table 1.
Multivariate regression analysis to test the hypothesis that percent infarction increment per unit rCBF reduction differs statistically between the 125 paired parcellated brain regions.
| B | S.E. | B | p value | |
|---|---|---|---|---|
| rCBF | 0.535 | 0.487 | 0.019 | 0.273 |
| Region | 0.063 | 0.003 | 0.279 | <0.001 |
| rCBF×Region | −0.057 | 0.004 | −0.344 | <0.001* |
| Constant | 2.96 | 0.426 |
A regression model was constructed correlating percent infarct volume within each brain region with the three variables listed in the first column. The significant interaction term (“rCBF×Region”) supports the hypothesis that percent infarct volume increment per unit rCBF reduction does indeed differ statistically between parcellated brain regions (i.e. ischemic vulnerability of brain tissue varies between locations).
B, regression coefficient; S.E. standard error of the B coefficient; β, standardized regression coefficient; p value of the input variable; rCBF, relative cerebral blood flow
This regional variability was also shown by simple linear regression for each of the 125 paired parcellated brain regions. Overall, regional percent infarction increased with decreasing rCBF. The table 2 lists those regions with highest slope of the regression line, corresponding to greatest ischemic vulnerability (slope = |B| coefficient = increase in regional percent infarction per unit reduction in blood flow). The corpus callosum had the lowest |B| values (|B|=0.10, R2=0.23 left; |B|=0.03, R2=0.30 right), whereas the insula, pre-central gyrus, and basal ganglia had the highest |B| values.
Table 2.
Brain regions with highest ischemic vulnerability to hypoperfusion
| Regions | Left hemisphere | Right hemisphere | ||
|---|---|---|---|---|
| |B| | R2 | |B| | R2 | |
| Caudate body | 0.94 | 0.38 | 0.84 | 0.61 |
| Putamen nucleus | 0.79 | 0.42 | 0.85 | 0.51 |
| Insular ribbon | 1.30 | 0.60 | 1.15 | 0.55 |
| Middle frontal gyrus | 0.82 | 0.64 | 0.95 | 0.64 |
| Frontal lobe subcortical WM | 0.78 | 0.45 | 0.91 | 0.48 |
| Precentral gyrus | 1.30 | 0.60 | 1.15 | 0.55 |
| Frontal lobe paracentral lobule | 0.74 | 0.29 | 1.04 | 0.98 |
For each of the 125 paired parcellated brain regions, the linear regression equation correlating regional percent infarction with regional rCBF was calculated. The table lists those regions with highest slope of the regression line, corresponding to greatest ischemic vulnerability (|B| = slope, increase in regional percent infarction per unit reduction in blood flow).
Voxel-based analysis provided visual corroboration of the region-based results (Figure 2). On the mean vulnerability map, the basal ganglia, insula, precentral gyrus, paracentral lobule, middle frontal, and inferior frontal gyri appear highly vulnerable bilaterally. Based on operating point ROC curve analysis of those voxels with VI values within the upper 20th percentile (i.e., highly vulnerable locations, Figure 3), a voxel-based rCBF threshold of 0.42 optimally distinguished infarct core. In the remainder of the brain, an rCBF voxel threshold of 0.16 distinguished infarct core with similar sensitivity and specificity.
Figure 2.
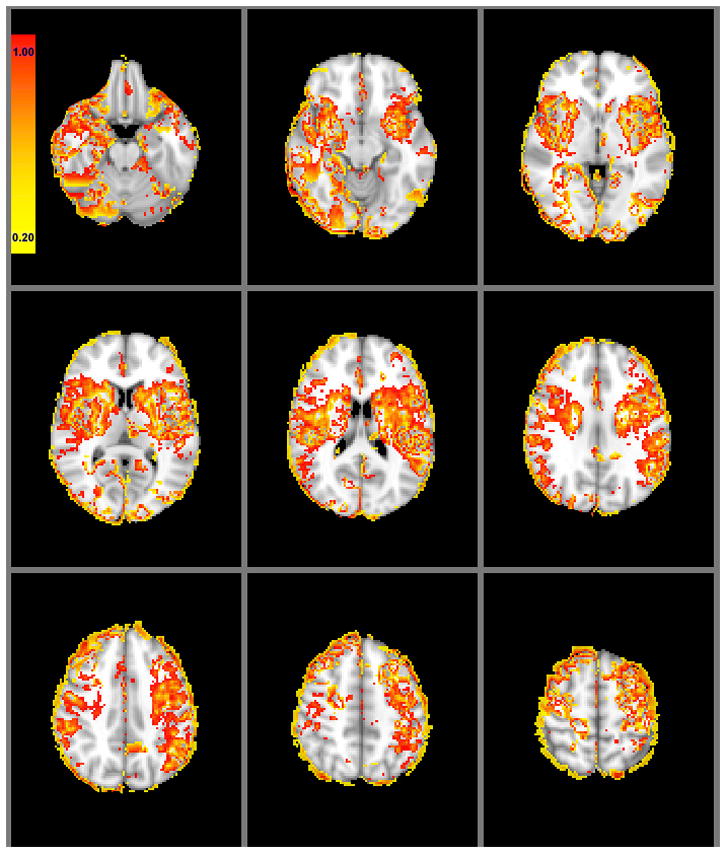
Mean voxel-based regional ischemic vulnerability of the brain on a color scale for 90 patients. Following non-rigid transformation of the segmented DWI infarct lesion maps to the MNI-152 brain space, each voxel was assigned a 0-to-1 value as the infarction probability. For each patient, “vulnerability index” values in each voxel were calculated as the product of the infarction probability and the relative cerebral blood flow.
Figure 3.
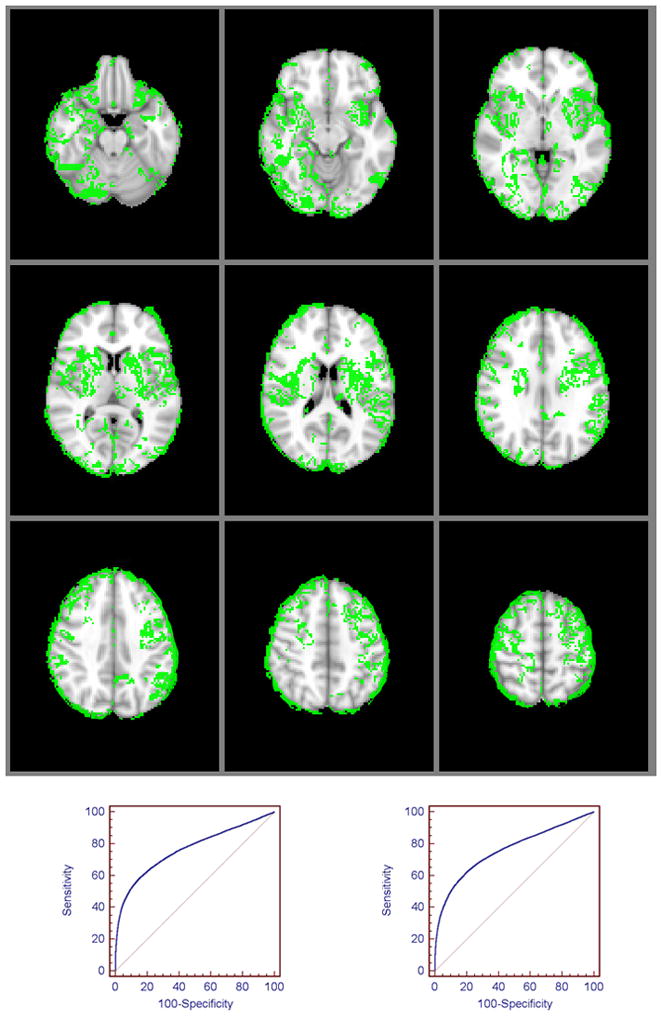
Regional ischemic vulnerability of the brain dichotomized into highly vulnerable (green voxels) versus less vulnerable (remainder of the brain) locations. A voxel-based rCBF threshold of <0.42 optimally differentiated infarct core in the highly vulnerable regions (voxels within the upper 20th percentile of values on the vulnerability map) (area under ROC curve [AUC] 0.72, 54% sensitivity, 80% specificity, p<0.001, bottom left); whereas an rCBF threshold of <0.16 distinguished core in the remainder of the brain, with equal sensitivity and specificity (AUC 0.73, 54% sensitivity, 79% specificity, p<0.001, bottom right).
Discussion
We have shown that ischemic vulnerability varies across brain regions, and that the caudate, putamen, insula, precentral gyrus, inferior frontal, and middle frontal gyri are among the top 20% of locations most highly sensitive to reductions in CBF. We have quantified that – for our particular CTP acquisition protocol and post-processing software – an approximately 60% reduction in rCBF in these highly vulnerable locations distinguishes infarct core, whereas an approximately 85% reduction in rCBF distinguishes infarct core in the remainder of the brain.
The literature supports our findings. Previous studies in rats have shown higher frequency of DWI changes in the hippocampus, cortex, and caudate/putamen,5 and greater degree of selective neuronal loss in the caudate/putamen following unilateral hypoxia-ischemia.6 Cheng and colleagues have also reported higher probabilities of infarct growth in the striatocapsular region of stroke patients with MCA stem occlusion.4 Interestingly, the spatial pattern of sensitivity to hypoperfusion in our patients (Figures 2 and 3) resembles the topographic distribution of early DWI hyperintensities reported in patients with hypoxic ischemic encephalopathy.7, 8 This suggests the possibility that similar pathophysiological mechanisms of regionally-selective neuronal loss may underlie cerebral injury in patients with embolic-occlusive and hypoxic ischemic stroke. There are also well-documented differences in the neurochemical response to ischemia of WM versus GM, likely due to greater metabolic demands of GM.9 Within GM, certain cortical regions in our study appeared more vulnerable than others, including the insular, precentral, and inferior frontal gyri. The specific cortical areas with the highest ischemic sensitivity to hypoperfusion displayed on our mean “vulnerability map” (Figure 2) and regional regression results (Table 2) could, in part, be attributed to the high volume of convoluted GM at these locations. Our results may also reflect selective neurophysiologic vulnerability of these regions. In support of this latter hypothesis, Woo et al found selective cerebral GM loss in the frontal and insular cortices of patients with long-term heart failure, presumably due to ischemia accompanying perfusion deficits.10
The vulnerability map of the brain reveals subtle topographic asymmetry (e.g., of the frontal paracentral lobules) (Figure 2 and 3) that may be artifactual, however, there may be other explanations for these findings. The inhomogenous distribution of infarction in our patients (Figure 1) and/or the presence of outliers could contribute to this asymmetry, or it might reflect true asymmetric vulnerability of these regions.
In agreement with previous studies, our rCBF threshold for infarct core was much higher (<0.42) in vulnerable cerebral areas versus the rest of the brain (<0.16). Arakawa et al reported CBF thresholds of 34.6 mL/100g/min for GM and 20.8 mL/100g/min for WM in an MR perfusion study.11 Bristow et al found CBF thresholds of 20.0 mL/100g/min and 12.3 mL/100g/min for infarction in GM and WM, respectively.12 Optimal CTP parameter thresholds for infarct core can vary significantly between vendors and even between different software from the same vendor.13 The optimal rCBF threshold (0.16) that we found in this study for less vulnerable brain voxels is in agreement with thresholds previously reported for an independent cohort who underwent a >65 second acquisition with post-processing by the same software, using the same default parameters (CT Perfusion 3).13
Given the variability in absolute quantification with different softwares, we chose to report “relative” – rather than “absolute” – values.14 Although rCBV as a surrogate for infarct core is well established, in our study we sought to study ischemic vulnerability based on the degree of hypoperfusion. The intrinsic physiological variability of CBV changes with ischemia which include such phenomenon as luxury perfusion and elevated CBV due to autoregulatory mechanisms – make CBV a less desirable parameter given the aims of our study.15 Previous work has also suggested that CBV measurements are likely more sensitive to subtle differences in acquisition and post-processing protocols than are CBF measurements.
Our findings may have clinical implications. Although we did not include time-post-ictus in our models, it is reasonable to hypothesize that less vulnerable areas may have a longer therapeutic time window for reperfusion treatment. This may also suggest that for those patients with ischemia at the most highly vulnerable brain locations, even early robust recanalization might be more effective if accompanied by neuroprotective therapies. There are a number of limitations to our study. Our results are limited by the spatial distribution of stroke lesions in our cohort (Figure 1). We could not evaluate voxels which had few or no infarctions, most notably in the posterior circulation. The variable time between stroke onset, admission CTP, and admission DWI for different patients may also have distorted our results. Moreover, because CTP quantification is not yet standardized between different acquisition and post-processing protocols from different vendors, the rCBF thresholds we report could vary slightly between different imaging platforms.13 Although the choice of a 20% cutoff in Figure 3 was arbitrary, this allowed us to visually threshold the “most” highly vulnerable regions for demonstration purposes in the figures.
Finally, the difference between our reported CBF thresholds and those of the literature is likely attributable to both differences in CTP acquisition length (45 seconds versus > 65 seconds in current generation protocols) and that we did not apply vessel exclusion post-processing algorithms, so as to be consistent with our current clinical defaults and in order to maximize contrast-to-noise ratio. This suggests that the specific thresholds which we report may have limited generalizability to other acquisition and post-processing platforms.
In conclusion, we have shown regional differences in ischemic susceptibility of the brain to hypoperfusion. Of the territories with infarction in our cohort, we found that the caudate and putamen were highly vulnerable, as were specific cortical areas including the insula, precentral gyrus, and middle and inferior frontal gyri. Our findings support the hypothesis that location-specific thresholds may be more accurate than whole-brain thresholds for estimating the likelihood of infarction with CTP, and hence have the potential to be of value in clinical management.
Acknowledgments
Source of funding:
This work was supported by the Specialized Programs of Translational Research in Acute Stroke (SPOTRIAS) grant funded by the National Institute of Health (NIH) (P50 NS051343), the Agency for Healthcare Research and Quality grant AHRQ R01 HS11392, and the Massachusetts General Hospital Clinical Research Center (No. 1 UL1 RR025758-01) Harvard Clinical and Translational Science Center, from the National Center for Research Resources.
Footnotes
Disclosures:
Michael H Lev receives research support from GE Healthcare, and is Consultant to Co-Axia, GE Healthcare, and Millennium Pharmaceuticals
References
- 1.Marcoux FW, Morawetz RB, Crowell RM, DeGirolami U, Halsey JH., Jr Differential regional vulnerability in transient focal cerebral ischemia. Stroke. 1982;13:339–346. doi: 10.1161/01.str.13.3.339. [DOI] [PubMed] [Google Scholar]
- 2.Konstas AA, Goldmakher GV, Lee TY, Lev MH. Theoretic basis and technical implementations of CT perfusion in acute ischemic stroke, part 2: Technical implementations. AJNR Am J Neuroradiol. 2009;30:885–892. doi: 10.3174/ajnr.A1492. [DOI] [PMC free article] [PubMed] [Google Scholar]
- 3.Payabvash S, Kamalian S, Fung S, Wang Y, Passanese J, Souza LC, Kemmling A, Harris GJ, Halpern EF, Gonzalez RG, Furie KL, Lev MH. Predicting language improvement in acute stroke patients presenting with aphasia: A multivariate logistic model using location-weighted atlas-based analysis of admission ct perfusion scans. AJNR Am J Neuroradiol. 31:1661–1668. doi: 10.3174/ajnr.A2125. [DOI] [PMC free article] [PubMed] [Google Scholar]
- 4.Cheng B, Golsari A, Fiehler J, Rosenkranz M, Gerloff C, Thomalla G. Dynamics of regional distribution of ischemic lesions in middle cerebral artery trunk occlusion relates to collateral circulation. J Cereb Blood Flow Metab. 2010 Oct 13; doi: 10.1038/jcbfm.2010.185. [Epub ahead of print] [DOI] [PMC free article] [PubMed] [Google Scholar]
- 5.Dijkhuizen RM, Knollema S, van der Worp HB, Ter Horst GJ, De Wildt DJ, Berkelbach van der Sprenkel JW, Tulleken KA, Nicolay K. Dynamics of cerebral tissue injury and perfusion after temporary hypoxia-ischemia in the rat: Evidence for region-specific sensitivity and delayed damage. Stroke. 1998;29:695–704. doi: 10.1161/01.str.29.3.695. [DOI] [PubMed] [Google Scholar]
- 6.Garcia JH, Liu KF, Ye ZR, Gutierrez JA. Incomplete infarct and delayed neuronal death after transient middle cerebral artery occlusion in rats. Stroke. 1997;28:2303–2309. doi: 10.1161/01.str.28.11.2303. discussion 2310. [DOI] [PubMed] [Google Scholar]
- 7.Konaka K, Miyashita K, Naritomi H. Changes in diffusion-weighted magnetic resonance imaging findings in the acute and subacute phases of anoxic encephalopathy. J Stroke Cerebrovasc Dis. 2007;16:82–83. doi: 10.1016/j.jstrokecerebrovasdis.2006.10.007. [DOI] [PubMed] [Google Scholar]
- 8.Singhal AB, Topcuoglu MA, Koroshetz WJ. Diffusion MRI in three types of anoxic encephalopathy. J Neurol Sci. 2002;196:37–40. doi: 10.1016/s0022-510x(02)00019-9. [DOI] [PubMed] [Google Scholar]
- 9.Hawkins R, Hass WK, Ransohoff J. Measurement of regional brain glucose utilization in vivo using [2(-14)c] glucose. Stroke. 1979;10:690–703. doi: 10.1161/01.str.10.6.690. [DOI] [PubMed] [Google Scholar]
- 10.Woo MA, Macey PM, Fonarow GC, Hamilton MA, Harper RM. Regional brain gray matter loss in heart failure. J Appl Physiol. 2003;95:677–684. doi: 10.1152/japplphysiol.00101.2003. [DOI] [PubMed] [Google Scholar]
- 11.Arakawa S, Wright PM, Koga M, Phan TG, Reutens DC, Lim I, Gunawan MR, Ma H, Perera N, Ly J, Zavala J, Fitt G, Donnan GA. Ischemic thresholds for gray and white matter: A diffusion and perfusion magnetic resonance study. Stroke. 2006;37:1211–1216. doi: 10.1161/01.STR.0000217258.63925.6b. [DOI] [PubMed] [Google Scholar]
- 12.Bristow MS, Simon JE, Brown RA, Eliasziw M, Hill MD, Coutts SB, Frayne R, Demchuk AM, Mitchell JR. MR perfusion and diffusion in acute ischemic stroke: Human gray and white matter have different thresholds for infarction. J Cereb Blood Flow Metab. 2005;25:1280–1287. doi: 10.1038/sj.jcbfm.9600135. [DOI] [PubMed] [Google Scholar]
- 13.Kamalian S, Kamalian S, Payabvash S, Schaefer PW, Furie KL, Gonzalez RG, Lev MH. CT perfusion cerebral blood flow not blood volume optimally correlates with admission diffusion weighting maging assessment of core infarction lesion volume in acute stroke patients. stroke. 2010;41:e339–340. [Google Scholar]
- 14.Schaefer PW, Roccatagliata L, Ledezma C, Hoh B, Schwamm LH, Koroshetz W, Gonzalez RG, Lev MH. First-pass quantitative CT perfusion identifies thresholds for salvageable penumbra in acute stroke patients treated with intra-arterial therapy. AJNR Am J Neuroradiol. 2006;27:20–25. [PMC free article] [PubMed] [Google Scholar]
- 15.Derdeyn CP, Videen TO, Yundt KD, Fritsch SM, Carpenter DA, Grubb RL, Powers WJ. Variability of cerebral blood volume and oxygen extraction: Stages of cerebral haemodynamic impairment revisited. Brain. 2002;125:595–607. doi: 10.1093/brain/awf047. [DOI] [PubMed] [Google Scholar]