

Abstract
The microsomal epoxide hydrolase (mEH) plays a significant role in the metabolism of numerous xenobiotics. Additionally, it has a potential role in sexual development and bile acid transport, and it is associated with a number of diseases, such as emphysema, spontaneous abortion, eclampsia and several forms of cancer. Toward developing chemical tools to study mEH biological role, we designed and synthesized a series of absorbent and fluorescent substrates. The highest activity for both rat and human mEH was obtained with the fluorescent substrate cyano(6-methoxy-naphthalen-2-yl)methyl glycidyl carbonate (11). An in vitro inhibition assay using this substrate ranked a series of known inhibitors similarly to the assay that used radioactive cis-stilbene oxide, but with a greater discrimination between inhibitors. These results demonstrate that the new fluorescence-based assay is a useful tool for the discovery of structure-activity relationships among mEH inhibitors. Further, this substrate could also be used for the screening chemical library with high accuracy and with a Z' value about 0.7. This new assay permits a significant decrease in labor and cost as well as offering the advantage of a continuous readout. However, it should not be used with crude enzyme preparations due to interfering reactions.
Keywords: microsomal epoxide hydrolase, fluorescent substrate, α-cyanocarbonate, xenobiotic metabolism
The microsomal epoxide hydrolase (mEH; E.C.3.3.2.9) catalyzes the hydrolysis of epoxides or arene oxides to their corresponding diols [1],[2]. It is a key hepatic enzyme involved in the metabolism of numerous xenobiotics, such as the epoxides of 1,3-butadiene, styrene, naphthalene, benzo(α)pyrene, phenantoin and carbamazepine [3]–[7]. The mEH is also involved in the extra-hepatic metabolism of these agents [8],[9]. While for most compounds the mEH action is a detoxification process [3]–[5], in some cases such as for benzo(α)pyrene 4,5-oxide, diol formation can lead to the stabilization of a secondary epoxide; thus increasing the mutagenic and carcinogenicities of the product[10],[11]. Additionally, the role of mEH in xenobiotic detoxification is further supported by recent polymorphism studies showing a relationship between this enzyme and susceptibility to emphysema [12]–[14], and several forms of cancer [15]–[18].
Despite the fact that mEH knockout mice do not present an obvious phenotype [11], there are several new lines of evidence suggesting an endogenous role for this enzyme in addition to xenobiotic metabolism. A potential role of mEH in sexual development is supported by the fact that androstene oxide is a very good mEH substrate [19], and that mEH is an apparent subunit of the anti-oestrogen-binding site [20] Such a role could be related to the observed relation between mEH polymorphism and spontaneous abortion [21] or preeclampsia [22]. Furthermore, mEH is well expressed in follicle cells in the ovaries [23],[24], and its expression is regulated by progesterone during the menstrual cycle [25]. Alternatively, over the last decade, mEH was also described as mediating the transport of bile acid in the liver [26],[27]. The mechanism by which mEH participates in this transport is not known. Finally, mEH was recently suggested [28] to play a complementary role to soluble epoxide hydrolase in the metabolism in the brain of naturally occurring epoxyeicosatrienoic acids, which are lipid mediators that have positive effects on cardiovascular diseases, pain and cancer treatment [29]–[31]. Obtaining potent mEH inhibitors will provide new tools to better understand the multiple roles of this enzyme.
Over the past decade, we have developed more potent mEH inhibitors to study the biological roles of the mEH [32],[33]. Traditionally, tritium labeled cis-stilbene oxide ([3H]-cSO) was used as substrate to measure inhibitor potency. While this assay allows the discrimination of the most potent inhibitors, it has the disadvantages of being time-consuming, costly and generating radiochemical waste. Therefore, with the need for testing numerous possible mEH inhibitors, it is necessary to investigate alternative assay strategies. Compared with radioactive and chromatographic-based assays, spectroscopic assays have the advantages of being straightforward in design and execution. With a few exceptions [34], a diol and its parent epoxide have similar spectral properties. Thus, after hydrolysis of an epoxide by an EH, an additional mechanism is usually required to generate an optical signal. To date there are two kinds of methods described in the literature. The first one is based on the oxidative cleavage by periodate of the formed diol to yield an aldehyde with absorbent or fluorescent properties [35]–[37]. Although these methods detect EH activity effectively, they generally require high concentrations of substrate (millimolar range), high amount of diol formed (micro to millimolar range) and rely on external chemical modification steps. An alternate strategy based on intramolecular cyclization following diol formation to release an alcohol couple with suitable chromophores or fluorophores was developed in our laboratory for sEH assays [38],[39]. These substrates are highly sensitive, relatively stable, and show large changes in their UV and fluorescence spectra upon hydrolysis. However, the compounds described to date for this later approach are not good mEH substrates. Thus, we report novel absorbent and fluorescent substrates for mEH. Furthermore, we optimize a kinetic assay for evaluating the potency of novel inhibitors and an end-point assay for the screening of chemical libraries.
Materials and Methods
Reagents
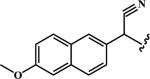
All reagents and solvents were purchased from Sigma-Aldrich (St Louis, MO) or Fisher Scientific (Pittsburg, PA) unless otherwise noted, and were used without further purification. 6-Methoxy-2-naphthaldehyde was obtained from TCI Chemicals (Portland, OR). 2-Hydroxy-2-(2-methoxynaphthalen-6-yl)-acetonitrile was synthesized as described [40]. The inhibitors 2-nonylsulfanyl-propionamide (A), elaidamide (B) and 12-hydroxy-octadecanamide (C) were prepared previously in the laboratory [32],[33]. Melting points (mp) were measured with a Thomas-Hoover apparatus (A. H. Thomas Co., Philadelphia, PA) and are uncorrected. 1H NMR spectra were recorded on a Varian Mercury 300 (Varian Inc., Walnut Creek, CA) in D6-dimethylsulfoxide using tetramethylsilane (TMS) as an internal reference. HPLC analyses were performed on a Waters Alliance 2795 (Bedford, MA, USA) HPLC system equipped with a Waters Symmetry C18, 5 μm, 4.6×150mm, column (Bedford, MA, USA), and a UV-VIS signal detection Waters 996 PDA detector operated in the wave length range of 210–500 nm. Elution was performed at a flow rate of 0.4 mL/min with a gradient over 60 min from 100%of solvent A (H2O:acetonitrile: formic acid 94.5:5:0.5) to 100% of solvent B (acetonitrile: formic acid 99.5:0.5). Accurate mass measurements were performed on a Micromass LCT, an orthogonal acceleration-Time-of-Flight (oa-TOF) mass spectrometer configured with dual sprayer electrospray ion source, a standard Z-spray electrospray (ES) and a Lock-spray ionization sources, operated in alternating polarity mode (Waters, Manchester, UK). Molecular ions of Leucine Enkephalin (L9133, Sigma, MO, USA) at m/z556.2771 Da in positive and m/z554.2615 Da in negative mode were used to obtain accurate masses via standard AMM procedure using MassLynx software (Waters, Manchester, UK).
Synthesis
Substrate and inhibitor structures are given in Tables and boldface numbers throughout the text refer to these compounds. The fluorescent substrates used in this study were synthesized as shown in Scheme 1. All substrates were synthesized as racemic mixtures, and compounds 2, 4 and 5 were prepared as cis/trans mixtures. NMR signals are reported in parts per million (ppm, δ) relative to TMS. For brevity, representative synthetic procedures are listed below. For additional synthetic procedures and spectral characterization, please refer to Table S1 in the accompanying supplemental information.
Scheme 1.

Synthetic routes for the synthesis of A esters, B carbonates and C carbamates substrates used in this study. Reagents and conditions: a: 1-ethyl-3-(3-dimethylaminopropyl) carbodiimide (EDCI) 1.1 eq., trietrhylamine (TEA) 1 Eq., 4-dimethylaminopyridine (DMAP) 0.1 Eq., CH2Cl2, room temperature (r.t.) overnight; b: -meta-chloroperbenzoic acid (mCPBA) 1.3 Eq., 1:1 CH2Cl2: sodium phosphate buffer (0.5 M pH 7.4), r.t. overnight; c: DMAP 0.1 Eq., tetrahydrofuran (THF), r.t. overnight; d: DMAP 0.1 Eq., CH2Cl2, r.t. 2 hours; e: CH2Cl2, r.t. 2 hours.
4-Nitrophenyl (oxiran-2-yl)methyl carbonate (6)
To 370 mg of glycidol (5 mmol) dissolved in 10 mL of chilled dry dichloromethane, 1.0 g of 4-nitrophenylchloroformate (5 mmol) was added. Then, 680 mg of triethylamine (5 mmol) was added slowly. The reaction was allowed to stir at 0°C for 15 minutes and then warmed to room temperature and stirred for an additional 2 hours. The reaction was washed with water until the aqueous phase was colorless. The organic phase was then washed with brine, and dried over MgSO4, filtered and evaporated. The residue was purified by chromatography on SiO2 to give 0.62 g (yield 50%) of the product (elution with 15% ethyl acetate in hexanes) as a yellowish powder. This product yielded a single spot on silica TLC (4:1 haxane:ethyl acetate solvent system). Melting point 41–43 °C. HRMS (m/z):C10H10NO6 [M + H]+ calcd: 240.0508 Da, found: 240.0502 Da. 1H NMR (d6-DMSO, TMS): δ 8.33 (D, J = 9.1 Hz, 2H), 7.59 (d, J = 9.3 Hz, 2H), 4.63 (dd, J = 4.1 Hz, 1H), 4.04 (dd, J = 4.0 Hz, 1H), 3.33 (m, 1H), 2.85 (d, J = 5.0 Hz, 1H), 2.72 (d, J = 5 Hz, 1H) ppm.
Cyano(6-methoxynaphthalen-2-yl)methyl (oxiran-2-ylmethyl) Carbonate (11)
To 106 mg (0.5 mmol) of 2-hydroxy-2-(6-methoxynaphthalen-2-yl)acetonitrile, 120 mg of 4-nitrophenyl (oxiran-2-yl)methyl carbonate (6) (0.5 mmol) was added in chilled anhydrous tetrahydrofuran (2 mL). 4-Dimethylaminopyridine (6 mg) was then added. The reaction was allowed to stir at 0°C for 15 minutes and then warmed to room temperature and stirred for 2 days. Ethyl acetate (5 mL) was added to the reaction. The organic layer was washed with aqueous K2CO3 until the aqueous layer was colourless. The organic layer was dried over MgSO4, filtered and evaporated. The residue was purified by chromatography on SiO2 to give 110 mg (yield 73%) of the product (elution with 30% ethyl acetate in hexanes) as a white powder. This product yielded a single spot on silica TLC (4:1 haxane:ethyl acetate solvent system). Melting point 72–74 °C. m/z: HRMS (m/z): C17H16NO5 [M + H]+ calcd: 314.1028 Da, found: 314.1049 Da; mtheoric for C34H31N2O10 [2M + H]+: 627.1979 Da, mfound: 627.1981 Da. 1H NMR (d6-DMSO, TMS): δ 8.10 (s, 1H), 7.95 (dd, J = 8.7 Hz, 2H), 7.63 (d, J =11.6 Hz, 1H), 7.40 9s, 1H),7.24 (dd, J = 8.7 Hz, 1H), 6.80 (s, 1H), 4.57 (m, 1H), 4.00 (m, 1H), 3.89 (s, 3H), 3.28 (m, 1H),2.80 (t, J = 4.5 Hz, 1H), 2.66 (dd, J = 2.7 Hz, 1H) ppm.
Enzyme preparation
Recombinant rat mEH (RmEH) and human mEH (HmEH) were produced in a polyhedron positive baculovirus expression system, and they were partially purified as described [33]. This purification method allows the recovery of 20 mg protein per liter of culture (40 to 60% yield in activity) with at least a 10-fold increase in purity. No esterase nor glutathione transferase activities, which can interfere with EH assays, were detected in the purified enzyme preparations [40]. The enzyme preparations were kept at 4°C until use; no significant loss of activity was observed over a 3 months period in these conditions. Protein concentration was quantified by using the Pierce BCA assay using Fraction V bovine serum albumin (BSA) as the calibrating standard.
Standard curves
To convert the measured absorbance (in OD) or fluorescence (in RFU) signals into a molar basis, we used appropriate calibration curves. Stock solution of fluorophores and chromophore at 5 mM in DMSO were prepared. Serial dilution was then prepared in DMSO. In clear (for the chromophores) or black (for the fluorophores) polystyrene 96-well plate (Greiner bio-One, Longwood, FL), two microliters of these diluted solutions (pure DMSO was used for the control wells) were added to 8 wells containing 198 μL of Tris/HCl buffer (100 mM pH 9.0) containing 0.1 mg/mL of BSA (final volume 200 μL with 1% DMSO). Absorbance of 4-nitrophenol (for compounds 1 to 7) was measured at 450 nm on a Spectramax M2 (Molecular Devices, Sunnyvale, CA) at 37°C. Fluorescence of 7 hydroxy-4-methylcoumarin (for 8 and 9), and 6-methoxy-2-naphtaldehyde (for 10 and 11) were measured with excitation wavelength of 355, and 330 nm, respectively, and emission wavelength of 450, and 465 nm, respectively. Calibration curves for these three compounds contained at least six points from 0.005 to 0.5 μM with good linearity (r2 > 0.99), in all cases.
Activity measurement
For the purification of the mEH, and to serve as reference substrate, activity was determined using [3H]-cis-stilbene oxide (cSO) as described [33]. To 100 μL of diluted enzyme (0.5 < [Protein]final < 16 μg/mL) in Tris/HCL buffer (100 mM pH 9.0) containing 0.1 mg/mL of BSA, one microliter of stock substrate solution was added ([S]final = 50 μM). The mixture was incubated at 30°C. After 5 min, the reaction was quenched by the addition of 250 μL of isooctane, which extracts the remaining epoxide from the aqueous phase. The activity was followed by quantifying the radioactive diol formed in the aqueous phase using a liquid scintillation counter (TriCarb 2810 TR, PerkinElmer, Downer Grove, IL). Assays were performed in triplicate.
The specific activities for the novel substrates prepared were measured in clear (for compounds 1 to 7) or black (for compounds 8 to 11) polystyrene 96-well plate. In each well, 170 μL of diluted enzyme (0.5 < [E]final < 80 μg/mL) in Tris/HCL buffer (100 mM pH 9.0) containing 0.1 mg/mL of BSA was dispensed and incubated at 37°C for 5 min. To measure the background hydrolysis, buffer was dispensed in the control wells. Thus, 30 μL of substrate working solution (prepared by mixing just before usage 133 μL of substrate stock solution at 5 mM in DMSO and 1860 μL of buffer) was added to each well ([S]final = 50 μM). The amount of product form was measured kinetically for 5 min using the absorbance (1–7) or fluorescence (8–11) mode with the wavelengths described above. Results are the average ± standard deviations of 8 replicates. Assays were run under conditions where product formation was linearly dependent both on the concentration of enzyme and on the time for the course of the assay.
Kinetic constants determination
These assays were performed as per the determination of specific enzyme activity (vide supra). Constant enzyme concentrations of recombinant mEH (rat: 5 μg/mL, human: 16 μg/mL) were tested for their activity with various substrate concentrations (0 ≤ [S]final ≤ 50 μM) at 37°C. Initial velocities of substrate turnover were plotted versus the corresponding substrate concentration (see supplementary material Figure S1 and S2 for examples of plot obtained). The kinetic constants (VM and KM) were calculated by non-linear fitting of the Michaelis-Menten equation to the obtained results using Sigma Plot version 11.0 (Systat Software Inc.; Chicago, IL). Results are means ± SD of three independent determinations of the kinetic constants.
Assay conditions optimization
To optimize the concentration of enzyme for the inhibition potency measurement assays, various concentrations of mEH (0 ≤ [E]final ≤ 10 μg/mL) were incubated in Tris/HCl buffer (0.1 M pH 9.0) containing 0.1 mg/mL of BSA with 25μM of substrate 11 at 37°C. Enzyme activity was monitored by measuring the appearance of 6-methoxy-2-naphthaldehyde as described above. To reduce the relative background hydrolysis, mEH (rat: 0.5 μg/mL, human: 1.6 μg/mL) was incubated with 25μM of substrate 11 in six different buffers and at two different temperature (30 and 37°C). Enzyme activity was monitored as described above for 10 min. Results are means ± SD of three independent measurements.
Inhibition potency assay
The inhibition potency (IC50) of three described mEH inhibitors [32],[33] was measured with compound 11 as substrate and with [3H]-cSO as described [33] for comparison. In black 96-well plates, to 170μL of human mEH (2.0 μg/mL) or rat mEH (0.6 μg/mL) in Tris/HCl buffer (100 mM pH 8.5) containing 0.1 mg/mL of BSA, 2 μL of the inhibitors in DMSO solution were added. The mixture was incubated for 5 min at 30°C. Then, 30 μL of a 167 μM solution of compound 11 in 77:23 buffer:DMSO mixture ([S]final = 25 μM; [E]final: human 1.6 μg/mL rat 0.5 μg/mL; 0 ≤ [I]final ≤ 200 μM). The activity was monitored for 10 min at 30°C by measuring the appearance of 6-methoxy-2-naphthaldehyde as described above. Assays were performed in triplicate. By definition, IC50 values are concentrations of inhibitor that reduce enzyme activity by 50%. IC50 values were determined by regression of at least six datum points located in the linear region of the curve, with a minimum of two data points on either side of the IC50 values. Results are means ± SD of three separate runs, each in triplicate.
High throughput screening assay
The screening of a small library of chemicals [41] was performed using compound 11 as substrate. To black 96-well plates containing 20μL of 10× concentrated test-compound solutions in 99:1 buffer:DMSO, 150 μL of Tris/HCl buffer (100 mM pH 8.5) containing 0.1 mg/mL of BSA were added in wells A1 to D1 (these four wells served as background control, while wells E1 to H1 served as full activity control), and 150 μL of the enzymes diluted in the same buffer were added to the rest of the plate using our Miniprep robotic system (Tecan, Durham, NC). The plate was then mixed and incubated at 30 °C for 5 minutes. Across the plate, 30 μL of a 167 μM solution of compound 11 in 77:23 buffer:DMSO mixture were added quickly ([S]final = 25 μM; [E]final: human 1.6 μg/mL rat 0.5 μg/mL; [I]final = 10 μM). The plate was incubated at room temperature for 30 min in the dark. The amount of formed 6-methoxy-2-naphthaldehyde was then measured by fluorescence detection with an excitation wavelength of 330 nm and an emission wavelength of 465 nm. Results are duplicate averages.
Results and discussion
Design and synthesis
To follow the same mechanism of intramolecular cyclization as reported for sEH substrates NEPC, CMNPC and PHOME [38],[39],[43]; the carbonyl of an ester or a carbonate should be optimally 4 atoms away from the first carbon of the oxirane ring. This allows, upon epoxide hydrolysis by an EH, one of the hydroxyl group of the diol to attack on the carbonyl, resulting in the liberation of the alcohol part of the ester or carbonate, such as 4-nitrophenol for NEPC or a α-cyanohydrin for CMNPC and PHOME [38],[39],[43]. The latter α-cyanohydrin rapidly decomposes to the fluorescent 6-methoxy-2-naphthaldehyde. It is important to verify that the substrates used do not contain appreciable amount of the reaction product. Even trace amount of product would significantly increase the background of the assay and reduce its signal to noise. For simplicity in the synthesis, we first screened a series of substrates with a 4-nitrophenol as reporter (Table 1). Earlier studies suggested that the mammalian mEH prefers mono-and cis-disubstituted epoxides over trans-and gem-disubstituted epoxides, while tri- and tetra-substituted epoxides acted as inhibitors [2]. Furthermore, cycloalkene oxides are slow turnover substrates for mEH [3]. Thus, we synthesized substrates with mono- 1, di-substituted 2–3, and cyclic 4–5 epoxides. For simplicity, compounds 2, 4 and 5 were prepared as cis/trans mixtures, knowing that if they are useful substrates, they could be separated by chromatography. Similarly, all the substrates were synthesized as racemic mixtures. Secondly, we optimized the best substrates with a series of fluorescent leaving groups (Table 2). While we were able to obtain compounds with coumarin 8–9 and α-cyanohydrin 10–11 leaving groups, we were not able to isolate in significant amount fluorescein and resorufin derivatives. These compounds degraded on the silica used during flash-chromatography purification.
Table 1.
Background hydrolysis and specific activity of rat and human mEH for a series of 4-nitrophenyl containing substrates.
 |
background hydrolysis (nmol.min−1) | Rat mEH | Human mEH | ||||||
|---|---|---|---|---|---|---|---|---|---|
| Spec. act. (nmol.min−1.mg−1) | S/B | S/N | Z' | Spec. act. (nmol.min−1.mg−1) | S/B | S/N | Z' | ||

|
0.37 ± 0.02 | 23 ± 1 | 3 | 44 | 0.66 | 72 ± 7 | 4 | 68 | 0.64 |
| 0.18 ± 0.01 | < 5 | 2 | 5 | < 0 | < 2 | 1 | 5 | < 0 | |

|
0.55 ± 0.11 | < 5 | 1 | 2 | < 0 | < 2 | 1 | 2 | < 0 |

|
0.18 ± 0.01 | < 5 | 1 | 12 | < 0 | < 2 | 1 | 15 | < 0 |

|
028 ± 0.04 | < 5 | 1 | 8 | < 0 | < 2 | 1 | 10 | < 0 |

|
0.31 ± 0.02 | 29 ± 2 | 5 | 32 | 0.67 | 51 ± 2 | 3 | 53 | 0.82 |

|
0.18 ± 0.04 | < 5 | 1 | 3 | < 0 | < 2 | 1 | 4 | < 0 |
Notes: S/B: signal to background ratio; S/N: signal to noise ratio; Z': screening window coefficient [42].
Table 2.
Background hydrolysis and specific activity of rat and human mEH for a series of fluorescent substrates.
 |
background hydrolysis (nmol.min−1) | Rat mEH | Human mEH | ||||||||
|---|---|---|---|---|---|---|---|---|---|---|---|
| Spec. act. (nmol.min−1.mg−1) | S/B | S/N | Z' | Spec. act. (nmol.min−1.mg−1) | S/B | S/N | Z' | ||||
| R | X | ||||||||||

|
CH2 | 8 | 0.014 ± 0.001 | 40 ± 2 | 4 | 102 | 0.76 | 17 ± 2 | 4 | 97 | 0.61 |
| O | 9 | 0.016 ± 0.001 | 48 ± 4 | 4 | 62 | 0.67 | 21 ± 2 | 5 | 79 | 0.76 | |
|
CH2 | 10 | 0.011 ± 0.001 | 21 ± 2 | 3 | 67 | 0.62 | 12 ± 1 | 4 | 52 | 0.61 |
| O | 11 | 0.018 ± 0.003 | 68 ± 4 | 5 | 48 | 0.73 | 25 ± 2 | 4 | 30 | 0.66 | |
Substrate selectivity
We first investigated the selectivity of the rat and human mEH for a series of substrates with a 4-nitrophenol as reporter (Table 1). Because the activity of esterases could interfere with the assay by hydrolyzing these compounds, the recombinant mEH were partially purified [33]. The active fraction used did not contain any measurable esterase activity [40]. A simple turbidity test showed that all the substrates have solubility above 50 μM under the assay conditions. Thus, a final substrate concentration of 50 μM, similar to the one described for mEH activity [32], was used. Furthermore, assays were performed at pH 9.0, the reported optimal pH for mEH activity, and at 37°C. The background hydrolysis of all the 4-nitrophenyl ester containing substrates (1–5) are similar (Table 1), and they are an order of magnitude higher than the one reported for NEPC [38] at pH 7.4. While at higher pH, the epoxide should be more stable, one could expect that on the other hand the ester function to be less stable. When looking at the influence of substitution on the epoxide (1–5) on the activity of the enzymes, we obtained measurable activity only for the mono-substituted epoxide 1. These results agree with earlier studies showing that the mammalian mEH prefers mono-substituted epoxides [2]. Nevertheless, compound 1 yielded S/N above 40 for both enzymes, reflecting a small variation in the reporter signal and, thus, the robustness of the assay. We also found a Z' values above 0.60 indicating a good separation band between the enzymes and the background signal [42]. However, its relatively high background hydrolysis rate limits its use. In order to reduce chemical hydrolysis while maintaining enzymatic activity, we first replaced the ester function of 1 by a carbonate 6 and a carbamate 7 (Table 1). While there was a small increase in stability (lower background hydrolysis) for the carbonate, the carbamate was twice as stable as the ester. Unfortunately, we obtained a small hydrolysis rate for compound 7 in presence of both enzymes. It could simply reflect that 7 is not a good substrate for the mEHs. Alternatively, the carbamate stability is such that the di-hydrodiol was not able to generate the chromophore rapidly enough and it became rate limiting. On the other hand, compound 6 was as good as 1 as substrate for the two enzymes tested.
To obtain more stable substrates to generate more sensitive assays, we followed a strategy used for sEH substrates [39]. We replaced the good leaving group 4-nitrophenol of compounds 1 and 6 with two less reactive fluorescent phenols (Table 2). The two umbeliferol derivatives (8 & 9) and the two cyanohydrin derivatives (10 & 11) have similar background hydrolysis that are an order of magnitude smaller than the ones of 1 and 6. The rat mEH yielded specific activities twice higher for the fluorescent substrates (8–11) than for the absorbance-based substrates (1 & 6); while for the human mEH we obtained specific activities 2 to 6 fold smaller for 8–11 than for 1 & 6. Nevertheless, all the fluorescent substrates in Table 2 yielded S/N above 40 for both enzymes, reflecting a small variation in the reporter signal and, thus increased the robustness of the assay. We also found Z' values above 0.60 indicating that these substrates could be easily used in HTS assays [42]. While all four substrates gave good results, we concentrated on the carbonates (9 & 11) that gave higher specific activity than the corresponding esters (8 & 10).
To further characterize the new substrates, we determined the kinetic constants for compounds 9 and 11. In addition, the KM and VM of cSO were also determined for comparison (Table 3). For the rat mEH, the cSO and 9 have similar KMs, while 11's has one order of magnitude lower. On the other end, the VM of cSO is 30 to 50% greater than for 9 and 11. Finally, the specific constants (VM/KM) are similar for cSO and 9, and 10-fold greater for 11. This indicates that for the rat mEH, 11 is a 10-times better substrate than the other substrates tested, and better than previously reported rat mEH substrates [2],[3]. For the human mEH, we observed very high values for the kinetic constants of cSO. Because the mEH has a two-step mechanism involving the formation and hydrolysis of a covalent intermediate [3], KM in this case is not a measurement of the affinity of the substrate for the enzyme, rather, KM reflects the concentration of substrate for which the velocity is half maximal. The obtained KM values should increase in parallel of the VM values [44], as observed with the cSO for the human mEH. While the KM of 9 and 11 were roughly 10 and 40-fold lower than for the cSO, respectively; their VM were also 15 to 30 times lower. Consequently, the specific constant (VM/KM) of 11 is 3 to 6-times larger than the other substrates tested, indicating that 11 overall is a better substrate for the human mEH. Furthermore, this substrate is hydrolyzed similarly or faster than previously described human mEH substrates [2],[4],[37].
Table 3.
Kinetic constants for the rat and human mEH, incubated in Tris/HCl buffer (pH 9.0, 100mM) containing 0.1 mg/mL BSA at 37°C. Results are average ± standard deviation of three independent measurements.
| Rat mEH |
Human mEH |
|||||
|---|---|---|---|---|---|---|
| KM (μM) | VM (nmol.min−1.mg−1) | VM/KM (nmol.min−1.mg−1.μM−1) | KM (μM) | VM (nmol.min−1.mg−1) | VM/KM (nmol.min−1.mg−1.μM−1) | |
| cSO | 35 ± 3 | 115 ± 10 | 3.3 ± 0.4 | 141 ± 9 | 570 ± 40 | 4.0 ± 0.1 |
| 9 | 22 ± 3 | 61 ± 3 | 2.8 ± 0.2 | 12.0 ± 0.7 | 20 ± 1 | 1.7 ± 0.1 |
| 11 | 2.3 ± 0.4 | 89 ± 8 | 40 ± 7 | 3.8 ± 0.6 | 42 ± 3 | 11 ± 1 |
Assay optimization
The development of an assay to evaluate the potency of mEH inhibitors requires appropriate concentrations of substrate and enzyme. For 11 a final substrate concentration of 25 μM was used, which is 10-fold above the KM of both rat and human mEH, and is below 11 maximal solubility in the buffer (≈ 50 μM). The saturated substrate condition is advantageous because it provides stability to the assay and because small variations in the substrate concentration will not affect the enzyme activity. The assay conditions can of course be optimized for different analytical goals. For example, the excess of substrate used here allows a longer assay time and minimized the effect of small technical errors. In contrast, short assay times will increase analytical throughput. In effect, to measure inhibitor potency, a short assay (5–10 min) is preferable; while for library of compounds screening a longer time of incubation (30–60 min) is preferred for automated assays. Thus, we tested the hydrolysis of 11 by various concentrations of the human mEH over 30 min (Figure 1). For 10 min, we observed linear appearance of the fluorescent aldehyde for [HmEH] up to 8 μg/mL. For 30 min, only [HmEH] below 3 μg/mL yielded a linear response. Therefore, we selected a HmEH concentration of 1.6 μg/mL that yields a signal to background ratio (S/B) of ≈ 3, a signal to noise ratio (S/N) of ≈ 40, and a Z' value of 0.75. At this enzyme concentration, the appearance of the fluorescence was linear up to 60 min incubation. Similar results (not shown) were obtained with the rat mEH. Optimal assay performances were obtained with a partially purified rat mEH concentration of 0.5 μg/mL.
Figure 1.

Time course hydrolysis of 25 μM of 11 by various concentration of human mEH in Tris/HCl buffer (pH 9.0, 100mM) containing 0.1 mg/mL BSA at 37°C. Results are average ± standard deviation of eight replicates.
As seen on Figure 1, the background hydrolysis of 11 is still significant. In order to reduce the hydrolysis, we investigated the effect of temperature, pH and buffer salts on the chemical and enzymatic hydrolysis of 11 (Figure 2). As expected, reducing the incubation temperature from 37 to 30 °C decreases the catalytic activity of the human mEH ≈ 30% for all the buffers tested (Figure 2A). However, it also reduced the background hydrolysis by at least 50%, yielding larger signal to background ratio (S/B) at the lower temperature (Figure 2B). For the three pH values tested, higher catalytic activities were obtained for the Tris/HCl buffers with little change in background hydrolysis among the buffers. Using these solutions, the enzymatic activity did not decrease significantly when the pH was reduced from 9.0 to 8.5 as expected [3], while the background hydrolysis was reduced by ≈ 30%. Reducing the pH further to 8.0 resulted in a reduction of the enzyme activity by ≈ 20%. Such reduction in activity was expected, because mEH was previously shown to have an optimal pH around 9.0 and its activity quickly decreases as pH is decreased [1],[3]. Because the background hydrolysis decreases by a similar amount there is no advantage from lowering the pH from 8.5 to 8.0. Therefore, we measured activity in a Tris/HCl buffer at pH 8.5 and at 30°C. This yielded a S/B > 5, a S/N > 50, and a Z' > 0.8.
Figure 2.

Effect of pH and temperature on the hydrolysis of 25 μM of 11 by 1.6 μg/mL of human mEH over a 10 min period. All the buffers contained 0.1 mg/mL BSA. Results are average ± standard deviation of eight replicates.
Inhibitor assays
To evaluate the effectiveness of this new assay, we determined the inhibition potency of three previously described rat mEH inhibitors [32][33]. In Table 4, we report the experimentally determined IC50s using the fluorescent assay described here with compound 11 as substrate and with the standard cSO based radiochemical assay for reference. Overall, similar results were obtained for the rat and human mEH. The results obtained with the cSO are similar to the IC50 values published previously [32][33]. While both assays gave the same relative pattern of inhibition, the IC50 values for each inhibitor are very different with each substrate. These data highlight that IC50 values are very dependent on the method of measurement as shown previously for sEH inhibition [39]. The enzyme concentration used for both assays were similar (Rat mEH: 1.0 and 0.5 μg/mL for cSO and 11, respectively; human mEH: 3.2 and 1.6 μg/mL for cSO and 11, respectively), and the substrate concentrations were in the same range ([cSO] = 50 μM; [11] = 25 μM). However, relative to their respective KM values (Table 3) these [S] are quite different. The cSO concentration is near its KM value for the rat enzyme and 3-fold below the KM for the human mEH. Thus, for cSO the assays are not run under saturation conditions. It is therefore easier to inhibit the enzyme, which yields smaller IC50s. To illustrate this, using a concentration of 11 near its KM ([11] = 2.5 μM), we obtained for the rat mEH an IC50 for inhibitor A of 0.5 μM which is similar to the one obtained with cSO. For the results presented in Table 4, the concentration of substrate 11 is 5 to 10-fold above its KM for both enzymes. Thus, the assays are run at saturation conditions, making it harder for an inhibitor to compete with the substrate to bind to the active site of the enzyme. These conditions result in larger IC50 values. While the inhibitors appeared less potent (larger IC50s), using compound 11 as substrate under the described conditions, the assay has the advantage of giving a better discrimination between potent inhibitors. For example, between inhibitors A and C, the cSO assay yielded only a 2 to 5 fold difference, while the fluorescent assay yielded >30-fold difference. This makes easier to interpret structure-activity data and thus simplifies the design of more potent inhibitors.
Table 4.
Comparison of inhibition potency (IC50) for selected mEH inhibitors. Results are average ± standard deviation of three independent measurements.
| Rat mEH |
Human mEH |
|||
|---|---|---|---|---|
| Inhibitor | cSO | 11 | cSO | 11 |
| IC50 (μM) | ||||
|
|
0.4 ± 0.1 | 4.2 ± 0.7 | 0.5 ± 0.1 | 6.0 ± 0.9 |
|
|
0.5 ± 0.1 | 63 ± 5 | 1.0 ± 0.1 | 140 ± 13 |
|
|
1.1 ± 0.1 | 123 ± 13 | 2.6 ± 0.3 | > 200 |
Finally, we tested the assay based on compound 11 as substrate to screen a small library of chemicals. We screened a library of pesticides we recently prepared [41] at a final concentration of 10 μM. Most HTS assays use endpoint measurement after a relatively long reaction time between the enzyme and substrate [43]. Thus, after addition of the substrate we incubated the enzymatic reactions for 30 min at room temperature before to detect the amount of formed 6-methoxy-2-naphthaldehyde as an endpoint measurement (see Table S2). With these conditions, we obtained on average (n = 4 for each enzyme) S/B = 3.0 ± 0.3, S/N > 30, and Z' = 0.69 ± 0.03. Between duplicates, we observed overall ≈ 5 % variation in mEH inhibition. These values showed that an assay using 11 as substrate is suitable for high throughput screening. At a concentration of 10 μM, four compounds (pyrethrum, Asana, triclosan and BDE47) showed significant inhibition of the mEH from both species. When these four chemicals were retested with 11 in the inhibition potency assay method described above, we confirmed mEH inhibition at 10 μM. However, no inhibition was observed when cSO was used as a substrate, suggesting false positive responses from the fluorescent assay.
To properly use the assay described here, there are a number of cautions to be aware of. First, when preparing the compound, it is critical that the substrate does not contain hydrolysis product that would significantly increase the background. These essays are very attractive for partially purified enzymes. However, trace of esterases, glutathione-S-transferases or other EH activity will lead to high background in the assay and difficulty to interpret results. Thus, in situations where the competing enzymatic reactions cannot be easily inhibited or removed, radiochemical or chromatographic based assays should be used. Certainly, these later assays should be used to characterize novel tissue homogenate. Finally, the assay described here, like all fluorescence based assays [41], are subject to interferences. This is a particular risk when inhibitors are used at high concentrations. It could, for example, quench the reporting signal by interfering with the excitation or emission photons. It may also form micelles that could sequester the substrate away from the enzyme. Such interferences were probably the source of the false positive inhibition we obtained while screening a small chemical library (see above).
Conclusions
We have developed a fluorescent assay for mammalian mEH inhibition studies. We validated the use of this assay for measurement of the potency of mEH inhibitors as well as for high throughput screenings. The new fluorescent assay is a more powerful tool to investigate mEH inhibition than the costly and labor intensive radioactive assays. Thus cyano(6-methoxynaphthalen-2-yl)methyl glycidyl carbonate (11, CMNGC) will be a very useful tool for the development of new mEH inhibitors, which will further investigations into the biological role of mEH.
Supplementary Material
Acknowledgements
We are thankful for Dr. Sung-Hee Hwang for his technical help in the structural characterization of the compounds synthesized herein. This work was partially funded by NIEHS grants ES02710 and ES013933, and NIEHS Superfund Basic Research Program grant P42 ES04699. BDH is a George and Judy Marcus Senior Fellow of the American Asthma Foundation.
Footnotes
Publisher's Disclaimer: This is a PDF file of an unedited manuscript that has been accepted for publication. As a service to our customers we are providing this early version of the manuscript. The manuscript will undergo copyediting, typesetting, and review of the resulting proof before it is published in its final citable form. Please note that during the production process errors may be discovered which could affect the content, and all legal disclaimers that apply to the journal pertain.
References
- [1].Oesch F. Mammalian epoxide hydrases: inducible enzymes catalysing the inactivation of carcinogenic and cytotoxic metabolites derived from aromatic and olefinic compounds. Xenobiotica. 1973;3:305–340. doi: 10.3109/00498257309151525. [DOI] [PubMed] [Google Scholar]
- [2].Newman JW, Morisseau C, Hammock BD. Epoxide hydrolases: Their roles and interactions with lipid metabolism. Prog. Lipid Res. 2005;44:1–51. doi: 10.1016/j.plipres.2004.10.001. [DOI] [PubMed] [Google Scholar]
- [3].Hammock BD, Grant D, Storms D. Epoxide hydrolase. In: Guengerich FP, editor. Comprehensive Toxicology: Vol. 3 biotransformation. Pergamon; Oxford: 1997. pp. 283–305. [Google Scholar]
- [4].Fretland AJ, Omiecinski CJ. Epoxide hydrolases: biochemistry and molecular biology. Chem.-Biol. Interact. 2000;129:41–59. doi: 10.1016/s0009-2797(00)00197-6. [DOI] [PubMed] [Google Scholar]
- [5].Decker M, Arand M, Cronin A. Mammalian epoxide hydrolases in xenobiotic metabolism and signaling. Arch. Toxicol. 2009;83:297–318. doi: 10.1007/s00204-009-0416-0. [DOI] [PubMed] [Google Scholar]
- [6].Tan H, Wang Q, Wang A, Ye Y, Feng N, Feng X, Lu L, Au W, Zheng Y, Xia Z. Influence of GSTs, CYP2E1 and mEH polymorphisms on 1, 3-butadiene-induced micronucleus frequency in Chinese workers. Toxicol. Appl. Pharmacol. 2010;247:198–203. doi: 10.1016/j.taap.2010.07.006. [DOI] [PubMed] [Google Scholar]
- [7].Carlson GP. Metabolism and toxicity of styrene in microsomal epoxide hydrolase-deficient mice. J. Toxicol. Environ. Health. A. 2010;73:1689–1699. doi: 10.1080/15287394.2010.516240. [DOI] [PubMed] [Google Scholar]
- [8].Zheng J, Cho M, Brennan P, Chichester C, Buckpitt AR, Jones AD, Hammock BD. Evidence for quinone metabolites of naphthalene covalently bound to sulfur nucleophiles of proteins of mouse Clara cell after exposure to naphthalene. Chem. Res. Toxicol. 1997;10:1008–1014. doi: 10.1021/tx970061j. [DOI] [PubMed] [Google Scholar]
- [9].Teissier E, Fennrich S, Strazielle N, Daval J-L, Ray D, Schlosshauer B, Gershi-Egea J-F. Drug metabolism in in vitro organotypic and cellular models of mammalian central nervous system: activities of membrane-bound epoxide hydrolase and NADPH-cytochrome P-450 (c) reductase. Neurotoxicology. 1998;19:347–356. [PubMed] [Google Scholar]
- [10].Szeliga J, Dipple A. DNA adducts formation by polycyclic aromatic hydrocarbon dihydrodiol epoxides. Chem. Res. Toxicol. 1998;11:1–11. doi: 10.1021/tx970142f. [DOI] [PubMed] [Google Scholar]
- [11].Miyata M, Kudo G, Lee Y-H, Yang TJ, Gelboin HV, Fernandez-Salguero P, Kimura S, Gonzalez FJ. Targeted disruption of the microsomal epoxide hydrolase gene: microsomal epoxide hydrolase is required for the carcinogenic activity of 7,12-dimethylbenz[α]anthracene. J. Biol. Chem. 1999;274:23963–23968. doi: 10.1074/jbc.274.34.23963. [DOI] [PubMed] [Google Scholar]
- [12].Smith CAD, Harrison DJ. Association between polymorphism in gene for microsomal epoxide hydrolase and suceptibility to emphysema. Lancet. 1997;350:630–633. doi: 10.1016/S0140-6736(96)08061-0. [DOI] [PubMed] [Google Scholar]
- [13].DeMeo DL, Hersh CP, Hoffman EA, Litonjua AA, Lazarus R, Sparrow D, Benditt JO, Criner G, Make B, Martinez FJ, Scanlon PD, Sciurba FC, Utz JP, Reilly JJ, Silverman EK. Genetic determinants of emphysema distribution in the national emphysema treatment trial. Am. J. Respir. Crit. Care Med. 2007;176:42–48. doi: 10.1164/rccm.200612-1797OC. [DOI] [PMC free article] [PubMed] [Google Scholar]
- [14].Castaldi PJ, Hersh CP, Reilly JJ, Silverman EK. Genetic associations with hypoxemia and pulmonary arterial pressure in COPD. Chest. 2009;135:737–744. doi: 10.1378/chest.08-1993. [DOI] [PMC free article] [PubMed] [Google Scholar]
- [15].Kiyohara C, Otsu A, Shirakawa T, Fukuda S, Hopkin JM. Genetic polymorphisms and lung cancer susceptibility: a review. Lung cancer. 2002;37:241–256. doi: 10.1016/s0169-5002(02)00107-1. [DOI] [PubMed] [Google Scholar]
- [16].To-Figueras J, Gené M, Gómez-Catalán J, Piqué E, Borrego N, Caballero M, Cruellas F, Raya A, Dicenta M, Corbella J. Microsomal epoxide hydrolase and glutathione S-transferase polymorphisms in relation to laryngeal carcinoma risk. Cancer Lett. 2002;187:95–101. doi: 10.1016/s0304-3835(02)00406-8. [DOI] [PubMed] [Google Scholar]
- [17].Baxter SW, Choong DYH, Campbell IG. Microsomal epoxide hydrolase polymorphism and susceptibility to ovarian cancer. Cancer Lett. 2002;177:75–81. doi: 10.1016/s0304-3835(01)00782-0. [DOI] [PubMed] [Google Scholar]
- [18].Pande M, Amos CI, Eng C, Frazier ML. Interactions between cigarette smoking and selected polymorphisms in xenobiotic metabolizing enzymes in risk for colorectal cancer: A case-only analysis. Mol. Carcinog. 2010;49:974–980. doi: 10.1002/mc.20682. [DOI] [PMC free article] [PubMed] [Google Scholar]
- [19].Vogel-Bindel U, Bentley P, Oesch F. Endogenous role of microsomal epoxide hydrolase: ontogenesis, induction, inhibition, tissue distribution, immunological behavior and purification of microsomal epoxide hydrolase with 16α,17α-epoxyandrostene-3-one as substrate. Eur. J. Biochem. 1982;126:425–431. [PubMed] [Google Scholar]
- [20].Mésange F, Sebbar M, Kedjouar B, Capdevielle J, Guillemot J-C, Ferrara P, Bayard F, Delarue F, Faye J-C, Poirot M. Microsomal epoxide hydrolase of rat liver is a subunit of the anti-oestrogen-binding site. Biochem. J. 1998;334:107–112. doi: 10.1042/bj3340107. [DOI] [PMC free article] [PubMed] [Google Scholar]
- [21].Wang X, Wang M, Niu T, Chen C, Xu X. Microsomal epoxide hydrolase polymorphism and risk of spontaneous abortion. Epidemiology. 1998;9:540–545. [PubMed] [Google Scholar]
- [22].Laasanen J, Romppanen E-L, Hiltunen M, Helisalmi S, Mannermaa A, Punnonen K, Heinonen S. Two exonic single nucleotide polymorphisms in the microsomal epoxide hydrolase gene are jointly associated with preeclampsia. Eur. J. Hum. Gene. 2002;10:569–573. doi: 10.1038/sj.ejhg.5200849. [DOI] [PubMed] [Google Scholar]
- [23].Mukhtar H, Philpot RM, Bend JR. The postnatal development of microsomal epoxide hydrase, cytosolic glutathione S-transferase, and mitochondrial and microsomal cytochrome P-450 in adrenals and ovaries of female rats. Drugs Metab. Dispos. 1978;6:577–583. [PubMed] [Google Scholar]
- [24].Cannady EA, Dyer CA, Christian PJ, Sipes IG, Hoyer PB. Expression and activity of microsomal epoxide hydrolase in follicles isolated from mouse ovaries. Toxicol. Sci. 2002;68:24–31. doi: 10.1093/toxsci/68.1.24. [DOI] [PubMed] [Google Scholar]
- [25].Popp SL, Abele IS, Buck MB, Stope MB, Blok LJ, Hanifi-Moghaddam P, Burger CW, Fritz P, Knabbe C. Microsomal epoxide hydrolase expression in the endometrial uterine corpus is regulated by progesterone during the menstrual cycle. J. Mol. Histol. 2010;41:111–119. doi: 10.1007/s10735-010-9266-6. [DOI] [PubMed] [Google Scholar]
- [26].Alves C, von Dippe P, Amoui M, Levy D. Bile acid transport into hepatocyte smooth endoplasmic reticulum vesicles is mediated by microsomal epoxide hydrolase, a membrane protein exhibiting two distinct topological orientations. J. Biol. Chem. 1993;268:20148–20155. [PubMed] [Google Scholar]
- [27].Zhu Q, Xing W, Qian B, von Dippe P, Shneider BL, Fox VL, Levy D. Inhibition of human m-epoxide hydrolase gene expression in a case of hypercholanemia. Biochem. Biophys. Act. 2003;1638:208–216. doi: 10.1016/s0925-4439(03)00085-1. [DOI] [PubMed] [Google Scholar]
- [28].Marowsky A, Burgener J, Falck JR, Fritschy JM, Arand M. Distribution of soluble and microsomal epoxide hydrolase in the mouse brain and its contribution to cerebral epoxyeicosatrienoic acid metabolism. Neuroscience. 2009;163:646–661. doi: 10.1016/j.neuroscience.2009.06.033. [DOI] [PubMed] [Google Scholar]
- [29].Imig JD, Hammock BD. Soluble epoxide hydrolase as a therapeutic target for cardiovascular diseases. Nat. Rev. Drug Discov. 2009;8:794–805. doi: 10.1038/nrd2875. [DOI] [PMC free article] [PubMed] [Google Scholar]
- [30].Inceoglu B, Schmelzer KR, Morisseau C, Jinks SL, Hammock BD. Soluble epoxide hydrolase inhibition reveals novel biological functions of epoxyeicosatrienoic acids (EETs) Prostaglandins. Other. Lipid. Mediat. 2007;82:42–49. doi: 10.1016/j.prostaglandins.2006.05.004. [DOI] [PMC free article] [PubMed] [Google Scholar]
- [31].Panigrahy D, Kaipainen A, Greene ER, Huang S. Cytochrome P450-derived eicosanoids: the neglected pathway in cancer. Cancer Metastasis Rev. 2010;29:723–735. doi: 10.1007/s10555-010-9264-x. [DOI] [PMC free article] [PubMed] [Google Scholar]
- [32].Morisseau C, Newman JW, Dowdy DL, Goodrow MH, Hammock BD. Inhibition of microsomal epoxide hydrolases by ureas, amides and amines. Chem. Res. Tox. 2001;14:409–415. doi: 10.1021/tx0001732. [DOI] [PubMed] [Google Scholar]
- [33].Morisseau C, Newman JW, Wheelock CE, Hill Iii T, Morin D, Buckpitt AR, Hammock BD. Development of metabolically stable inhibitors of Mammalian microsomal epoxide hydrolase. Chem. Res. Toxicol. 2008;21:951–957. doi: 10.1021/tx700446u. [DOI] [PubMed] [Google Scholar]
- [34].Wixtrom RN, Hammock BD. Continuous spectrophotometric assays for cytosolic epoxide hydrolase. Anal. Biochem. 1988;174:291–299. doi: 10.1016/0003-2697(88)90548-9. [DOI] [PubMed] [Google Scholar]
- [35].Mateo C, Archelas A, Furstoss R. A spectrophotometric assay for measuring and detecting an epoxide hydrolase activity. Anal. Biochem. 2003;314:135–141. doi: 10.1016/s0003-2697(02)00646-2. [DOI] [PubMed] [Google Scholar]
- [36].Doderer K, Schmid RD. Fluorometric assay for determining epoxide hydrolase activity. Biotechnol. Lett. 2004;26:835–839. doi: 10.1023/b:bile.0000025887.36874.33. [DOI] [PubMed] [Google Scholar]
- [37].Shen W, Zhang J, Mao G, Jiang K, Zhu Q. A long-wavelength, fluorogenic probe for epoxide hydrolase: 7-(2-(oxiran-2-yl)ethoxy) resorufin. Biol. Pharm. Bull. 2009;32:1496–1499. doi: 10.1248/bpb.32.1496. [DOI] [PubMed] [Google Scholar]
- [38].Dietze EC, Kuwano E, Hammock BD. Spectrophotometric substrates for cytosolic epoxide hydrolase. Anal. Biochem. 1994;216:176–187. doi: 10.1006/abio.1994.1023. [DOI] [PubMed] [Google Scholar]
- [39].Jones PD, Wolf NM, Morisseau C, Whetstone P, Hock B, Hammock BD. Fluorescent substrates for soluble epoxide hydrolase and application to inhibition studies. Anal. Biochem. 2005;343:66–75. doi: 10.1016/j.ab.2005.03.041. [DOI] [PMC free article] [PubMed] [Google Scholar]
- [40].Shan G, Hammock BD. Development of sensitive esterase assays based on alpha-cyano-containing esters. Anal. Biochem. 2001;299:54–62. doi: 10.1006/abio.2001.5388. [DOI] [PubMed] [Google Scholar]
- [41].Morisseau C, Merzlikin O, Lin A, He G, Feng W, Padilla I, Denison MS, Pessah IN, Hammock BD. Toxicology in the fast lane: application of high-throughput bioassays to detect modulation of key enzymes and receptors. Environ. Health. Perspect. 2009;117:1867–1872. doi: 10.1289/ehp.0900834. [DOI] [PMC free article] [PubMed] [Google Scholar]
- [42].Zhang JH, Chung TD, Oldenburg KR. A simple statistical parameter for use in evaluation and validation of high throughput screening assays. J. Biomol. Screen. 1999;4:67–73. doi: 10.1177/108705719900400206. [DOI] [PubMed] [Google Scholar]
- [43].Wolf NM, Morisseau C, Jones PD, Hock B, Hammock BD. Development of a high throughput screen for soluble epoxide hydrolase inhibition. Anal. Biochem. 2006;355:71–80. doi: 10.1016/j.ab.2006.04.045. [DOI] [PMC free article] [PubMed] [Google Scholar]
- [44].Segel IH. Enzyme kinetics: behavior and analysis of rapid equilibrium and steady-state enzyme systems. John Wiley & Sons Inc.; New York: 1993. [Google Scholar]
Associated Data
This section collects any data citations, data availability statements, or supplementary materials included in this article.