

Abstract
This study tests the hypothesis that executive dysfunction, common in temporal lobe epilepsy (TLE), is associated with an abnormal frontostriatal network. Structural and diffusion tensor MR scans, Wisconsin Card Sorting Test (WCST) targeting cognitive flexibility and Trails B test examining parallel sequencing were obtained from 9 left TLE and 17 healthy controls. The five major findings are: 1) Caudate volume is reduced on the left side in TLE. 2) The atrophy involves dorsal and ventral head of caudate. 3) These atrophic caudate regions have corresponding high probability of connections to dorsal prefrontal, anterior cingulate, and orbitofrontal cortex. 4) Smaller caudate volumes are linked to greater numbers of WCST perseverative errors. 5) Reduced connections between caudate and dorsal prefrontal cortex correlated with poorer scores on Trails B test. The results suggest that atrophy in the dorsal head of caudate might disrupt frontostriatal networks that are critical for executive functioning in TLE.
Keywords: temporal lobe epilepsy, executive function, caudate, frontostriatal, DTI, shape analysis
1. Introduction
While individuals with unilateral temporal lobe epilepsy (TLE) have a confined epileptogenic zone within the limbic network, widespread structural abnormalities exist outside this region [1–3]. Not surprisingly, in concert with the diffuse anatomical abnormalities, individuals with TLE not only have memory impairments [4], but also deficits in executive function [5–7]. However, the anatomical underpinnings of this executive dysfunction in TLE are not fully understood. Compelling evidence suggests that disturbances in the frontostriatal network might be a candidate mechanism, as these brain regions are critical for executive functioning [8]. In functional imaging studies, tests of executive function consistently activate the prefrontal cortex and the caudate nucleus [9]. Note too that discrete lesions in the caudate nucleus can produce isolated deficits in executive function [10–12]. Although individuals with TLE have reduced caudate volume and dopamine binding [13, 14], little data exist delineating which caudate regions are atrophied, the precise frontostriatal connections that are affected, and the relationship that these structural changes have with executive behaviors. The current study uses shape analysis, diffusion tensor imaging (DTI), and cognitive tests that target executive function to address these issues.
The first goal of the current study was to define the exact extent and location of atrophy within the caudate nucleus in individuals with left TLE. The caudate nucleus is structurally asymmetric, with larger right-sided volumes [15, 16]. Analyzing the caudate nucleus, according to the side of seizure-onset (i.e., combining left and right TLE subjects) might obscure this normal asymmetry. Therefore, we selected only patients with left TLE for this study in order to maintain normal anatomical asymmetry and to test whether the caudate atrophy is unilateral or bilateral. The study first measured global caudate volume and then used shape analysis to visualize spatial profiles of caudate atrophy in TLE. Such computational analyses localized specific caudate sub-regions in which TLE patients might have greater atrophy, compared to healthy controls. Using this approach, the study aimed to test two competing hypotheses. On one hand, if the overall caudate volume reduction seen in TLE is simply a result of diffuse brain atrophy, then the distribution of caudate atrophy should be randomly distributed throughout the entire caudate nucleus. On the other hand, if the caudate atrophy pattern reflects a disruption of specific frontostriatal circuits, then atrophy should be localized to specific regions within the caudate.
The second goal of the study was to investigate frontostriatal connections that are affected in TLE. The caudate nucleus is topographically organized into distinct functional zones based on its connections to the cortex [17]. The present study used DTI and probabilistic tractography to examine the topographic organization and the relative connection strength between the caudate nucleus and the prefrontal cortex in TLE and healthy controls [18].
The third goal of this study was to determine the degree to which caudate atrophy is related to executive dysfunction in TLE. Prior studies have focused on hippocampal and neocortical contributions to such impairment, but a role for caudate has not been previously studied. Indeed, a number of studies [5, 6, 19] have provided convergent evidence that executive system dysfunction in TLE is related to changes in networks outside the epileptogenic temporal lobe, but the precise anatomy of such changes is unresolved. The current study tests the hypothesis that executive deficits in TLE are related to an aberrant frontostriatal network by investigating how reductions in caudate volume and decreased frontostriatal connections, as measured by DTI connectivity, are related to reduced performances on behavioral tasks that target executive function.
2. Methods
2.1. Subjects
We recruited 9 patients with medically intractable left TLE (age = 37.7 ± 4 years, mean ± SEM, range: 21–53; Female/Male = 5/4) and 17 healthy controls (HC, 29.8 ± 2.5 years, range: 20–51; Female/Male = 9/8) for this study, using an approved protocol from our Institutional Review Board. All subjects gave their informed consents prior to being included in this study. Entry criteria for patients included the ability to undergo an MRI, plus a diagnosis of definite or probable unilateral left TLE. The exclusion criteria included 1) evidence of extratemporal epilepsy, demonstrated either with brain MRI or EEG, 2) evidence of brain abnormalities that might confound normal brain development such as a) below average I.Q. (I.Q. < 70), b) history of hypoxic ischemic encephalopathy, c) intrauterine exposure to recreational drugs or alcohol, and 3) psychiatric history of chronic psychosis or suicidality.
The diagnosis of left TLE was confirmed in 8 patients using continuous video-EEG monitoring, demonstrating unilateral ictal temporal EEG discharges of theta frequency or higher, within 30 seconds after onset and thus were classified as definite TLE [20]. One patient did not undergo video-EEG monitoring, but had evidence of hippocampal sclerosis on an MRI with unilateral left temporal interictal epileptiform discharges on an EEG, and thus was classified as probable TLE. In 8 out of 9 patients the diagnosis of TLE was also supported by MRI evidence of mesial temporal sclerosis and/or unilateral temporal lobe hypometabolism on fluorodeoxyglucose positron emissions tomography. Patient clinical information, obtained from chart review as well as direct patient interview, is outlined in Supplemental Table.
The control subjects were recruited through response to advertisements. Criteria for control subjects included 1) no neurological or psychiatric diagnoses, 2) no family member with epilepsy, 3) no history of a loss of consciousness for >5 minutes, and 4) ability to undergo MRI.
2.2. Image acquisition
MRI data was obtained with a 3-Tesla Achieva scanner (Philips Medical Systems, Best, Netherlands) using a SENSE coil. T1-weighted MP-RAGE images were acquired using the following parameters: TR = 8.4 ms TE = 3.7 ms, flip angle = 8°, 190 axial slices, 1 mm isotropic voxels, no interslice gap, SENSE factor 2.4. DTI data was obtained using an echo planar sequence with the following parameters: TR = 11194 ms, TE = 55 ms, 2 mm isotropic voxels, no interslice gap, 60 axial slices, acquisition matrix = 112 mm × 110 mm (FOV = 224 mm), 64 diffusion directions with b-value 800 s/mm2. Two sets DTI images were obtained in order to increase signal-to-noise ratio (SNR).
2.3. Image processing
Image processing and analysis was performed using tools from the Oxford Center for Functional MRI of the Brain (FMRIB, FSL version 4.1.5, http://www.fmrib.ox.ac.uk/fsl). T1-weighted images were initially skull-stripped using the Brain Extraction Tool (BET) [21] and each image was visually inspected for proper brain extraction. Brain extracted images were then processed using FMRIB’s Automated Segmentation Tool (FAST) [22] in order to correct for spatial intensity variations and segment images into gray matter, white matter, and CSF.
Automated segmentation of the caudate nucleus was performed using FMRIB’s Integrated Registration and Segmentation Tool (FIRST) [23]. FIRST is a segmentation tool that is based on a template originating from manually segmented images, with subcortical labels parameterized as surface meshes. This process first registered the T1 images to the template via 12 degrees of freedom affine transformation, and then 12 degrees of freedom registration to a standard MNI 152 template subcortical mask. This subcortical mask was then used to label and segment subcortical structures based on T1 image intensity. Image registration and subcortical segmentations were visually inspected to confirm accuracy of the results.
Diffusion weighted images were processed using FMRIB’s Diffusion Toolbox (FDT v2.0) [24]. First, the two sets of DTI images were corrected for eddy current distortions and head motion artifacts by way of an affine registration to the first scan’s b0 volume [25]. Then the two sets of images were averaged in order to increase SNR. FSL’s BEDPOSTX program was then used to generate probability distributions of diffusion parameters at each voxel, including modeling for diffusion of crossing fibers along two directions [24].
Diffusion weighted connectivity-based caudate parcellation was performed using probabilistic tractography initiated from the subjects’ caudate mask to the five target regions in the prefrontal cortex obtained from Freesurfer (see below under cortical mask generation). In this method, 5000 streamline samples were sent out from each caudate voxel, and the number of times a sample connected to one of the five prefrontal cortex target regions was recorded. The relative strength of connection between the caudate nucleus and each of the regions in the prefrontal cortex were calculated in the following two steps. First, we threshold the connectivity results to include only voxels in the caudate in which 5% streamline samples pass through any of the target regions in the prefrontal cortex. Second, we calculated the number of projections that reached each region in the prefrontal cortex as a proportion of samples that reached all of the prefrontal cortex target regions and thus deriving a mean proportional connectivity for each brain region in the prefrontal cortex. Such calculation normalizes the strength of connection across all subjects, regardless of the size of individual’s caudate or prefrontal cortex and allows one to combine proportion of connections between brain regions to reduce type 1 error (see statistical analysis below).
In order to visualize which regions of the caudate have the greatest probability of connectivity to each cortical mask, individual subject caudate masks were summed, and the voxel with highest probability of connectivity was recorded [26]. A threshold of 50% of this maximum connectivity was then applied to each group mask in order to visualize the regions of caudate with greatest likelihood of connectivity to each cortical mask.
2.4. Cortical mask generation
Cortical parcellation was carried out using the Freesurfer image analysis suite (http://surfer.nmr.mgh.harvard.edu/). Technical details have been described previously [27–38]. Briefly, T1-weighted images were first registered to the Talairach atlas using an affine registration, bias-field corrected, and then skull-stripped. Classification of voxels as white matter was performed based on signal intensity and neighbor constraints. The cortical surface was generated for each hemisphere by first tiling the outside of the white matter, and then refined to follow the intensity gradients between white and gray matter. Segmentation of cortical regions was based on a subject-independent probabilistic atlas (generated by hand labeling a set of subjects) and subject-specific measured values. Point correspondence for all subjects was achieved by mapping these labels into Talairach space. Each point was then classified as belonging to a given label based on the probability that it belongs to each of the label classes, informed by neighboring values and the probability distribution function of the measured value.
The above process generated an atlas, providing labels for both cortical and subcortical regions. From these labels, the caudate and five regions of the prefrontal cortex (Figure 1) were isolated as masks for diffusion tensor tractography, namely the ventrolateral prefrontal cortex (generated by combining pars triangularis and pars opercularis labels), the dorsolateral prefrontal cortex (generated by combining rostral and caudal middle frontal labels), the dorsomedial prefrontal cortex (generated by the superior frontal cortex label), the anterior cingulate (generated by combining rostral anterior cingulate and caudal anterior cingulate labels), and the lateral orbitofrontal cortex. The boundaries for each mask have been previously described [39]. Each subject’s caudate and cortical masks were then transformed into DTI space using FMRIB’s Linear Image Registration Tool (FLIRT) to be used as masks for tractography.
Figure 1.
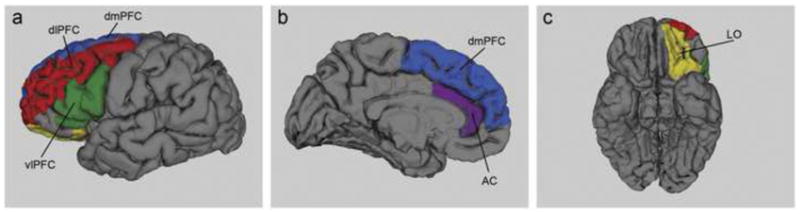
Target regions in the prefrontal cortex for diffusion tractography illustrated on a single subject’s brain. The color codes are as follows: dorsomedial (dmPFC) in blue, dorsolateral prefrontal (dlPFC) in red, ventrolateral prefrontal (vlPFC) in green, anterior cingulate (AC) in purple and lateral orbitofrontal (LO) in yellow.
2.5. Neuropsychological tests
The Wisconsin Card Sorting Test (WCST) perseverative errors and Trail Making Test B (Trails B) were selected as the cognitive endpoints for the current study because of its sensitivity for evaluating executive function. The WCST is a measure of cognitive flexibility involving abstract reasoning, the ability to shift strategies and modulate impulsive responding with new environmental feedback [40]. In particular, perseverative errors are considered to indicate poor frontal lobe function. Trails B involves psychomotor speed as well as the complexity of divided attention between dual parallel sequencing processes[41]. These tests been extensively used to detect changes in executive function in TLE [6, 19, 42–44].
2.6. Statistical analysis
2.6.1. Volumetric analysis
Following segmentation via FIRST, volumes for right and left caudate were determined for each subject. Total intracranial volume (TIV) was calculated by summing the volumes of gray matter, white matter, and CSF, as generated by FAST. In order to correct for individual differences in brain volume, proportional caudate volume to TIV ratio was also calculated (caudate volume divided by TIV and multiplied by 100). A one-way ANOVA, with age as a covariate, comparing TLE and healthy controls, was performed for the raw and normalized volumes to assess for group differences.
2.6.2. Shape analysis
A multivariate Gaussian model of vertex location and intensity variation was employed to automatically generate the most probable surface mesh for the caudate of each subject. The same number and labeling of vertices was used to enable point-to-point comparisons across all subjects. Following generation of caudate surface meshes for each subject, corresponding vertex points were aligned to the mean surface of the template caudate in MNI152 space. F statistics were then carried out in order to compare shape differences between TLE and healthy controls [23, 45].
2.6.3. Correlations between caudate volume, connectivity and executive function
Right and left caudate volumes (corrected for TIV) were correlated with two cognitive endpoints: 1) WCST perseverative errors and 2) Trails B. Correlation analyses were performed using Spearman’s rho, with Bonferroni correction for multiple comparisons (significance level set at p<0.05/2).
Statistical testing for correlations between mean proportion of connections of in each prefrontal region and the above two cognitive endpoints was performed using Spearman’s rho. To reduce the number of comparisons (type 1 error), the proportion of connections from the caudate to the dorsolateral and dorsomedial prefrontal cortices were combined to form dorsal prefrontal cortex (Figure 1). Such anatomical parcellation of the prefrontal cortex is in line with previous DTI connectivity studies [26, 46] as well as primate connectivity studies [47]. Therefore, a total of 8 regions in the prefrontal cortex (4 from each hemisphere) were used to correct for multiple comparisons (Bonferoni corrections, p <0.05/8 = 0.006).
3. Results
3.1. Reduced caudate volumes in TLE subjects
To assess the degree of global caudate atrophy in TLE, the right and left total caudate volumes were analyzed. Significantly smaller left caudate volume was present in TLE, when compared to healthy controls (Figure 2a, left caudate mean reduction 11%, p=0.046). These results remained significant after correcting for total intracranial volumes (caudate volume as percent of TIV, TLE left = 0.2257 ± 0.0059, mean ± SEM, HC left = 0.3493 ± 0.0097, p=0.036). The right caudate was only trend level smaller in TLE, when compared to healthy controls (Figure 2d, mean reduction 10%, p=0.098). Post-hoc analysis revealed that in the TLE group, there was no significant difference between caudate volumes ipsilateral (i.e. left) and contralateral (i.e., right) to the side of seizure onset. A similar degree of rightward asymmetry is present in both TLE and control groups (TLE = 2.95 ± 0.73%; HC = 2.52 ± 0.54%; p=0.56). No significant correlation was found between left or right caudate volume and several epilepsy-related clinical parameters, namely, age of epilepsy onset, duration of epilepsy, and number of antiepileptic drugs.
Figure 2.
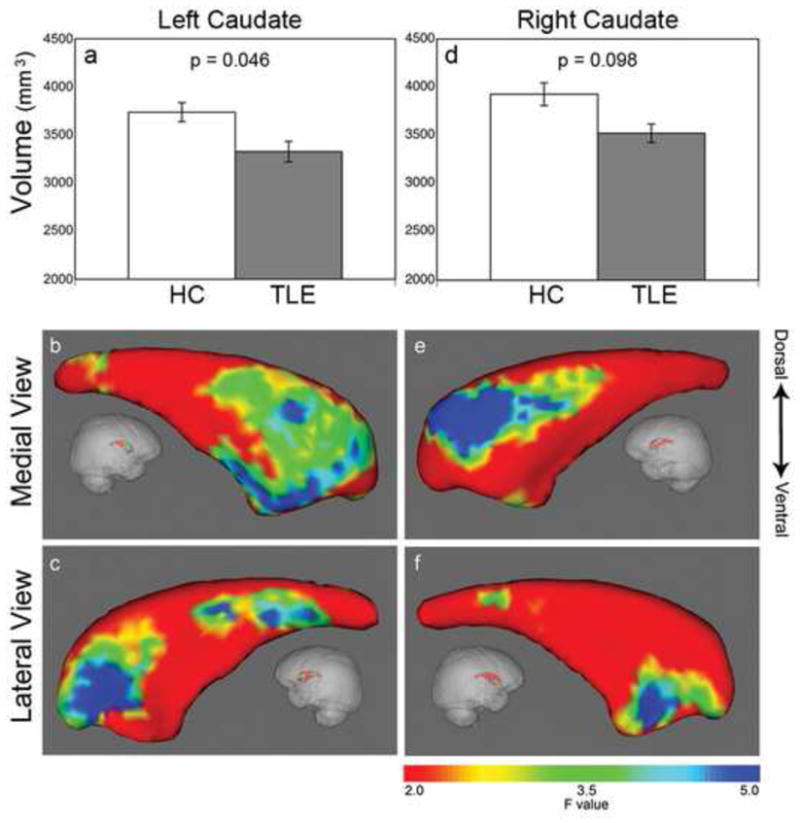
Reduced caudate volumes and regional caudate atrophy profiles. Left caudate volume is significantly reduced in TLE (gray bar) while right caudate showed a trend level reduction, when compared to health controls (white bar) (a, d). Shape analysis showed atrophy is selective mainly for the caudate head. On the left side, the shrinkage is located in the anterodorsal and anteroventral caudate head as well as a smaller region in the tail (b, c). Similarly, on the right side, the atrophy is located in the anterodorsal and anteroventral caudate head (e, f). Color bar on the right indicates F-statistics for the shape analysis, with degrees of freedom of 3, 22, giving corresponding F=2 (red area), p=0.14; F=3.5 (green), p=0.03; F=5 (blue), p=0.009.
3.2. Caudate atrophy profiles
Shape analysis revealed that for each hemisphere, caudate atrophy in TLE subjects was predominately located in specific subregions within the caudate head. Specifically, in the left caudate, there were three specific sub-regions of shrinkage: on the medial view, 1) a large region of shrinkage extended from anterodorsal to anteroventral caudate (Figure 2b); on the lateral view, 2) in the anterodorsal and 3) the tail of the caudate (Figure 2c). In the right caudate, there were two sub-regions of atrophy: on the medial view, 1) a region of atrophy was detected in the anterodorsal caudate (Figure 2e); on the lateral view, 2) a region of atrophy was located in the anteroventral caudate (Figure 2f).
3.3. Caudate connections with prefrontal cortex
In order to better interpret the selective caudate atrophy pattern found in TLE, connectivity analysis was performed between the caudate and five prefrontal sub-regions in TLE (Figure 3). The resultant maps provided a probabilistic atlas of prefrontal connections to these atrophic caudate regions. The ventrolateral prefrontal cortex had a high probability of connectivity extending from central to posterior aspects of the caudate (Figure 3a,b). Both dorsolateral and dorsomedial prefrontal cortices had strong evidence of connectivity with the anterodorsal caudate (Figure 3c–f). The anterior cingulate and lateral orbitofrontal cortex had high probability of connection with the most anteroventral aspects of the caudate head (Figure 3g–j). These results clearly demonstrated that the caudate nucleus is organized along a rostral/caudal and medial/lateral gradient, across these prefrontal sub-regions. Spatial comparison between the TLE-associated atrophic caudate regions and the connectivity maps revealed that the anterodorsal shrinkage (Figure 2b,e) corresponded to caudate areas that are connected to the dorsolateral and dorsomedial prefrontal cortices, while the anteromedial regions of atrophy (Figure 2c,f) have a high likelihood of connection to the anterior cingulate and lateral orbitofrontal cortex.
Figure 3.
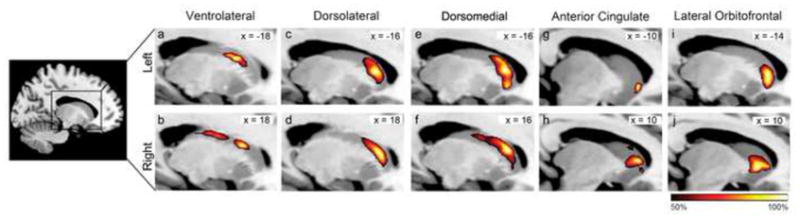
Group probability maps of DTI connectivity between the caudate nucleus and the five targeted regions in the prefrontal cortex of TLE subjects. Dark red indicates regions with 50% of subjects have connectivity in common, while bright yellow indicates regions with 100% of subjects have connectivity in common. Slices are shown at the MNI X-coordinate of the voxel with the greatest probability of connectivity for each cluster (denoted on the top right of each image).
3.4. Caudate volume, frontostriatal connections and executive function relationships
Whereas the caudate nucleus and its corresponding prefrontal connections are affected by TLE, the link between structural and functional abnormalities is not fully characterized. In the current study, TLE subjects showed a trend towards making more perseverative errors (TLE = 8.77 ± 2.35; HC = 5.13 ± 0.33; p=0.06) and had a significantly longer Trails B test completion time (TLE = 63.4 ± 9.6 seconds; HC = 42.8 ± 3.9; p=0.03), when compared to controls. Significant associations were found between caudate volumes and performance on the WCST (Figure 4). Thus, in TLE, smaller caudate volumes on the right side correlated significantly with a greater number of WCST perseverative errors (Spearman’s r=−0.82, p=0.007). Similar trend level significance was found on the left side, when corrected for multiple comparisons (r=−0.67, p=0.047). No significant relationship was found between caudate volume and Trails B test completion times or sequencing errors.
Figure 4.
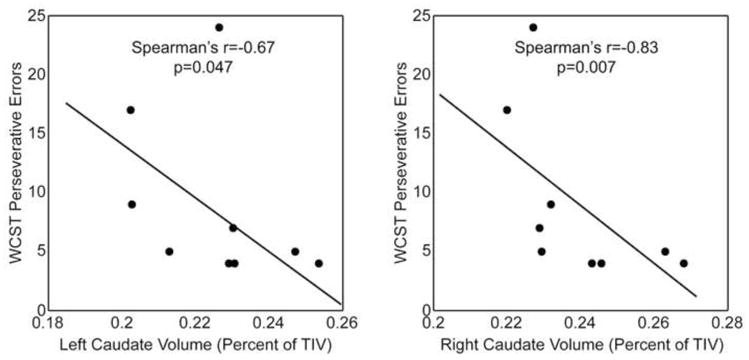
Caudate volumes are linked to executive function in TLE. The left (a) and right (b) caudate volume (corrected for total intracranial volume) is negatively correlated with Wisconsin Card Sorting Test perseverative errors.
Mean proportion of connectivity between the left caudate nucleus and the left dorsal prefrontal cortices was negatively correlated with Trials B making time (r = −0.88, p = 0.0016). Specially, lower left caudate to dorsal prefrontal connectivity was associated with slower Trials B test completion time (Figure 5). No other significant correlations were found between Trails B test and other prefrontal regions. No correlation was found between WCST perseverative errors and caudate to prefrontal connectivity. Post-hoc analysis showed no significant correlations between Trails B sequencing errors and prefrontal connectivity. No significant correlation was found between caudate to prefrontal connectivity and several clinical parameters (listed above).
Figure 5.
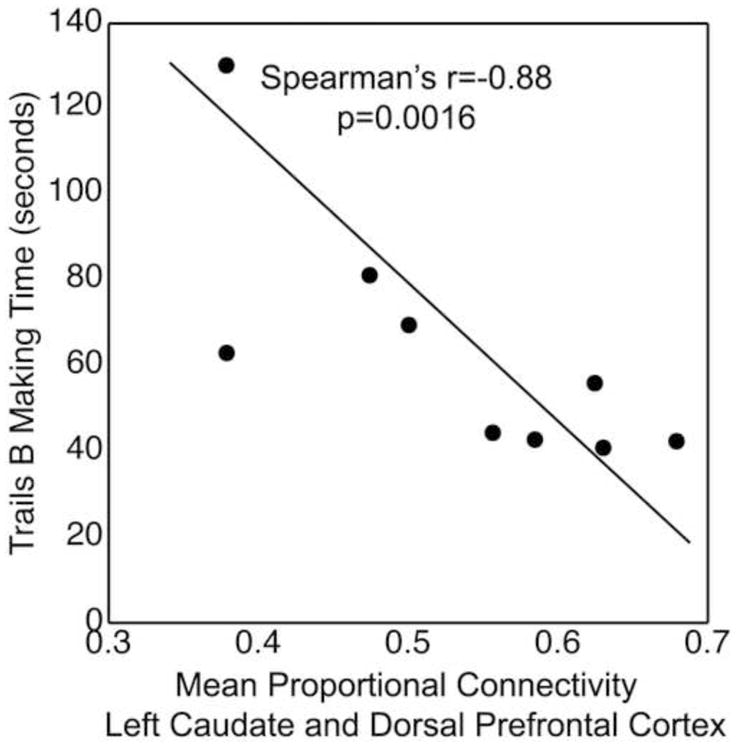
Mean proportion of connectivity between the left caudate nucleus and the left dorsal prefrontal cortex was negatively correlated with Trials B making time. Specially, lower left caudate to dorsal prefrontal connectivity was associated with slower Trials B test completion time.
4. Discussion
This study aimed to define the impact of impaired frontostriatal networks on executive functioning in TLE. The four major findings are as follows: 1) The total volume of the caudate is reduced predominately on the left side in TLE, the side ipsilateral to seizure onset. 2) The atrophy is discretely located in specific caudate subregions, i.e., the dorsal and ventral head of the caudate nucleus. 3) These atrophic caudate regions have corresponding high probability of connections to the dorsolateral and dorsomedial prefrontal cortices as well as anterior cingulate and orbitofrontal cortex. 4) The degree of caudate atrophy and frontostriatal connections are linked to performances on executive functioning tasks. Together, these results suggest that unilateral temporal lobe epilepsy is associated with abnormalities in specific frontal cortical-basal ganglionic circuits as well as with deficits in corresponding executive behavior.
4.1 Methodological issues
This study has several limitations. First, the sample size is small and a larger population would be needed to validate these findings. Within this small sample size, however, we acquired a complicated dataset, including multi-modality high resolution imaging (volumetric MRI and 64-direction DTI on 3 Telsa scanner) as well as tests of executive function. This dataset provided a detailed multifaceted examination of our hypotheses. Despite the small sample size, the neuroanatomical and behavior effects reached statistical significance. Second, only left TLE patients were included in the current study to evaluate if the caudate atrophy was unilateral or bilateral. Thus it is unknown if frontostriatal circuits are differentially affected in right TLE. Third, this is a cross sectional study and causality of executive dysfunction in TLE cannot be inferred from correlations between structure and function. It is also unknown if frontostriatal abnormalities found in the current study are part of a more diffuse network of structural abnormalities in TLE. In summary, we are cautious regarding the interpretation and application of our findings, given the small sample size and only inclusion of left TLE subjects. We therefore suggest that these findings should be confirmed in larger samples of right and left TLE subjects as well as age-matched controls.
In addition to examining the association between caudate volume and cognitive performance, we also correlated the strength of connection between caudate and prefrontal lobe with executive functioning. We chose connection strength instead of the more widely used fractional anisotropy as a measure of DTI connectivity for two reasons. First, connection strength might be a more accurate measurement of tract integrity than fractional anisotropy in pathways between cortical and subcortical gray matter (see Ramnani et. al. for a review[48]). As a tract approaches a gray matter structure, there is a decrement in fractional anisotropy, leading to considerable fiber divergence. Indeed, an overall calculation of fractional anisotropy is most reliable in a well-defined large white matter tract such as the arcuate fasciculus, where the fractional anisotropy in each voxel remains relatively high throughout the pathway. In the current study, however, the frontostriatal tract is not well defined and fiber divergence might be present in regions of low fractional anisotropy, near frontal lobe and caudate. Second, using connection strength allows us to assess the relative integrity of frontostriatal connections across subjects, regardless of individual variability in the seed (caudate) and target (regions in the prefrontal lobe) area volume [46, 49, 50]. The connection strength of a particular frontostriatal pathway (i.e. caudate to dorsal prefrontal lobe) is calculated as a proportion of overall connectivity to any region of the prefrontal lobe. Using this normalized value to calculate strength of projection adjusts for seed and target volumes and thus would not bias TLE subjects with smaller caudate or prefrontal cortex. Such an approach has been employed in human and primates to map parietal cortex connection patterns [50] as well as subcortical regions to frontal [46, 49] lobe network. More recently, the strength of connection has been correlated with scores on a personality questionnaire, measuring reward dependent and novelty seeking characteristics [51]. Whereas the strength of connection between the frontal lobe and the striatum predicted reward dependent behavior, the strength of connection between the subcortical regions (amygdala and hippocampus) was associated with novelty seeking traits.
4.2. Neurobiological considerations
The first goal of this study was to determine the overall caudate volume and then map the three-dimensional caudate atrophy pattern. These two analyses provided complementary information regarding the nature of caudate degeneration in TLE. The volumetric measurement provided the global degree of caudate atrophy while shape analysis localized regional changes within the caudate nucleus [45]. The overall caudate volume reduction, predominately on the side of seizure onset, found in this study is consistent with prior reports [13, 14]. Of note, although the right caudate volume was only trend level smaller in TLE than controls, the shape analysis showed significant atrophy in subregions of the caudate. Shape analysis and other similar surface mapping techniques have been found to be more sensitive to disease specific differences, when compared to analysis of overall volume [52, 53]. Importantly, the current study revealed that such atrophy is not diffuse, but selective, mainly for the dorsal and ventral regions of the caudate head. Such regional specificity has significant cognitive consequences. Patients with strokes in the caudate head have selective difficulties with executive dysfunction, such as planning, organizing and shifting strategies [11, 12]. These behavioral disturbances are also common in TLE [5, 6] and contribute to poor quality of life and increased suicide risks [44, 54].
The second goal of this study was to employ DTI tractography between prefrontal regions and the caudate nucleus in order to provide further understanding of the caudate atrophy profile in TLE. The atrophy in the dorsal caudate head has corresponding high probability of connections to dorsal prefrontal regions, namely the dorsomedial and dorsolateral prefrontal cortices, while ventral regions of caudate atrophy are related to mesial frontal regions, including the lateral orbitofrontal and anterior cingulate cortices. These distinct frontostriatal networks subserve complementary and non-overlapping aspects of executive function. The dorsal prefrontal circuit is critical for relating current information to stored data in working memory [55], whereas the orbitofrontal and anterior cingulate regions are important for reward-based decision making [56]. Impairment of these coordinated frontostriatal circuits might result in disruption of information transfer and therefore may contribute to executive dysfunction in TLE.
The third goal of this study was to investigate the structural-functional link between caudate volume, frontostriatal connectivity, and executive function in TLE. Although there is converging evidence that executive dysfunction in TLE is due to structural abnormalities outside the temporal lobe, the role of the frontostriatal network has not been studied. Corcoran and Upton reported that the presence of hippocampal sclerosis was associated with poorer performance on a modified WCST [42]. However, this association has not been reproduced in subsequent studies [6, 19]. Hermann and Seidenberg found that TLE subjects who were seizure-free after epilepsy surgery had improved WCST scores [5]. Based on this result, they proposed that the epileptogenic temporal lobe disrupts distant extratemporal lobe structures that mediate executive function. Martin and colleagues found no association between temporal lobe volumes (mesial and neocortical) and performances on WCST [6]. A history of secondary generalized seizures, perhaps reflecting a more widespread epileptogenic network, was related to poorer performances on this task. From these results, they postulated that executive dysfunction in TLE involves a distributed network outside of the temporal lobes, such as the frontostriatal network. More recently, Keller and colleagues found that dorsal prefrontal cortex atrophy in TLE was related to deficits in several executive function tasks [57], but a more widespread frontostriatal circuit was not investigated.
The current study linked caudate volume to performances on WCST. The WCST is frequently used in functional MRI studies to probe a subject’s ability to shift strategies, according to positive or negative feedbacks. Interestingly, the caudate nucleus is activated only during negative feedback [55, 58], suggesting it plays an important role in generating new responses when presented with unknown rules. Impairment in this ability might result in producing persistently incorrect answers despite negative feedback, as reflected in the increased rate of perseverative errors on the WCST, associated with caudate atrophy, observed in the current study. The current study also demonstrated that altered connectivity between caudate and dorsal prefrontal cortex is associated with impaired performances on Trails B test in TLE. It is important to note that this structural-functional relationship is selective for connectivity to the dorsal prefrontal cortex, a brain region critical for attention, working memory and executive functioning [56]. In summary, caudate atrophy and altered caudate-dorsal prefrontal connectivity in TLE might disrupt vital anatomical networks necessary for response generation and working memory during novel, complex, or conflicting situations, with consequential deficits in executive function.
4.3. Conclusions
The current study combines shape analysis, DTI, and cognitive testing to emphasize the selective nature of caudate atrophy, its corresponding frontostriatal connections, and links to executive function in TLE. This study provides an important initial characterization of frontostriatal abnormalities in TLE and new insights into the biological mechanism of executive dysfunction in this epilepsy syndrome.
Supplementary Material
Acknowledgments
Funding
This work was supported by grants from National Institutes of Health (NIH K23 NS060993, PI: Lin, J. J.; NIH T32 NS45540, PI: Baram, T. Z.) and Epilepsy Foundation Target Initiative for Mood Disorders (PI: Lin, J. J.).
Footnotes
Publisher's Disclaimer: This is a PDF file of an unedited manuscript that has been accepted for publication. As a service to our customers we are providing this early version of the manuscript. The manuscript will undergo copyediting, typesetting, and review of the resulting proof before it is published in its final citable form. Please note that during the production process errors may be discovered which could affect the content, and all legal disclaimers that apply to the journal pertain.
References
- 1.Bernasconi N, et al. Whole-brain voxel-based statistical analysis of gray matter and white matter in temporal lobe epilepsy. Neuroimage. 2004;23(2):717–23. doi: 10.1016/j.neuroimage.2004.06.015. [DOI] [PubMed] [Google Scholar]
- 2.Lin JJ, et al. Reduced neocortical thickness and complexity mapped in mesial temporal lobe epilepsy with hippocampal sclerosis. Cereb Cortex. 2007;17(9):2007–18. doi: 10.1093/cercor/bhl109. [DOI] [PubMed] [Google Scholar]
- 3.Bonilha L, et al. Voxel-based morphometry reveals gray matter network atrophy in refractory medial temporal lobe epilepsy. Arch Neurol. 2004;61(9):1379–84. doi: 10.1001/archneur.61.9.1379. [DOI] [PubMed] [Google Scholar]
- 4.Oyegbile TO, et al. The nature and course of neuropsychological morbidity in chronic temporal lobe epilepsy. Neurology. 2004;62(10):1736–42. doi: 10.1212/01.wnl.0000125186.04867.34. [DOI] [PubMed] [Google Scholar]
- 5.Hermann B, Seidenberg M. Executive system dysfunction in temporal lobe epilepsy: effects of nociferous cortex versus hippocampal pathology. J Clin Exp Neuropsychol. 1995;17(6):809–19. doi: 10.1080/01688639508402430. [DOI] [PubMed] [Google Scholar]
- 6.Martin RC, et al. Wisconsin Card Sorting performance in patients with temporal lobe epilepsy: clinical and neuroanatomical correlates. Epilepsia. 2000;41(12):1626–32. doi: 10.1111/j.1499-1654.2000.001626.x. [DOI] [PubMed] [Google Scholar]
- 7.Hermann BP, et al. The emerging architecture of neuropsychological impairment in epilepsy. Neurol Clin. 2009;27(4):881–907. doi: 10.1016/j.ncl.2009.08.001. [DOI] [PMC free article] [PubMed] [Google Scholar]
- 8.Alexander GE, DeLong MR, Strick PL. Parallel organization of functionally segregated circuits linking basal ganglia and cortex. Annu Rev Neurosci. 1986;9:357–81. doi: 10.1146/annurev.ne.09.030186.002041. [DOI] [PubMed] [Google Scholar]
- 9.Postuma RB, Dagher A. Basal ganglia functional connectivity based on a meta-analysis of 126 positron emission tomography and functional magnetic resonance imaging publications. Cereb Cortex. 2006;16(10):1508–21. doi: 10.1093/cercor/bhj088. [DOI] [PubMed] [Google Scholar]
- 10.Divac I, Rosvold HE, Szwarcbart MK. Behavioral effects of selective ablation of the caudate nucleus. J Comp Physiol Psychol. 1967;63(2):184–90. doi: 10.1037/h0024348. [DOI] [PubMed] [Google Scholar]
- 11.Nys GM, et al. Neuropsychological and neuroanatomical correlates of perseverative responses in subacute stroke. Brain. 2006;129(Pt 8):2148–57. doi: 10.1093/brain/awl199. [DOI] [PubMed] [Google Scholar]
- 12.Mendez MF, Adams NL, Lewandowski KS. Neurobehavioral changes associated with caudate lesions. Neurology. 1989;39(3):349–54. doi: 10.1212/wnl.39.3.349. [DOI] [PubMed] [Google Scholar]
- 13.Dreifuss S, et al. Volumetric measurements of subcortical nuclei in patients with temporal lobe epilepsy. Neurology. 2001;57(9):1636–41. doi: 10.1212/wnl.57.9.1636. [DOI] [PubMed] [Google Scholar]
- 14.Bouilleret V, et al. Basal ganglia involvement in temporal lobe epilepsy: a functional and morphologic study. Neurology. 2008;70(3):177–84. doi: 10.1212/01.wnl.0000297514.47695.48. [DOI] [PubMed] [Google Scholar]
- 15.Ifthikharuddin SF, et al. MR volumetric analysis of the human basal ganglia: normative data. Acad Radiol. 2000;7(8):627–34. doi: 10.1016/s1076-6332(00)80579-6. [DOI] [PubMed] [Google Scholar]
- 16.Watkins KE, et al. Structural asymmetries in the human brain: a voxel-based statistical analysis of 142 MRI scans. Cereb Cortex. 2001;11(9):868–77. doi: 10.1093/cercor/11.9.868. [DOI] [PubMed] [Google Scholar]
- 17.Draganski B, et al. Evidence for segregated and integrative connectivity patterns in the human Basal Ganglia. J Neurosci. 2008;28(28):7143–52. doi: 10.1523/JNEUROSCI.1486-08.2008. [DOI] [PMC free article] [PubMed] [Google Scholar]
- 18.Behrens TE, et al. Non-invasive mapping of connections between human thalamus and cortex using diffusion imaging. Nat Neurosci. 2003;6(7):750–7. doi: 10.1038/nn1075. [DOI] [PubMed] [Google Scholar]
- 19.Trenerry MR, Jack CR. Wisconsin Card Sorting Test Performance Before and After Temporal Lobectomy. Journal of Epilepsy. 1994;7(4):313–17. [Google Scholar]
- 20.Risinger MW, et al. Ictal localization of temporal lobe seizures with scalp/sphenoidal recordings. Neurology. 1989;39(10):1288–93. doi: 10.1212/wnl.39.10.1288. [DOI] [PubMed] [Google Scholar]
- 21.Smith SM. Fast robust automated brain extraction. Hum Brain Mapp. 2002;17(3):143–55. doi: 10.1002/hbm.10062. [DOI] [PMC free article] [PubMed] [Google Scholar]
- 22.Zhang Y, Brady M, Smith S. Segmentation of brain MR images through a hidden Markov random field model and the expectation-maximization algorithm. IEEE Trans Med Imaging. 2001;20(1):45–57. doi: 10.1109/42.906424. [DOI] [PubMed] [Google Scholar]
- 23.Patenaude B, et al. FMRIB Technical Report TR07BP1. Oxford, Bayesian Shape and Appearance Models. 1989:1–23. [Google Scholar]
- 24.Behrens TE, et al. Probabilistic diffusion tractography with multiple fibre orientations: What can we gain? Neuroimage. 2007;34(1):144–55. doi: 10.1016/j.neuroimage.2006.09.018. [DOI] [PMC free article] [PubMed] [Google Scholar]
- 25.Jenkinson M, Smith S. A global optimisation method for robust affine registration of brain images. Med Image Anal. 2001;5(2):143–56. doi: 10.1016/s1361-8415(01)00036-6. [DOI] [PubMed] [Google Scholar]
- 26.Klein JC, et al. Topography of connections between human prefrontal cortex and mediodorsal thalamus studied with diffusion tractography. Neuroimage. 2010;51(2):555–64. doi: 10.1016/j.neuroimage.2010.02.062. [DOI] [PMC free article] [PubMed] [Google Scholar]
- 27.Fischl B, Dale AM. Measuring the thickness of the human cerebral cortex from magnetic resonance images. Proc Natl Acad Sci U S A. 2000;97(20):11050–5. doi: 10.1073/pnas.200033797. [DOI] [PMC free article] [PubMed] [Google Scholar]
- 28.Dale AM, Fischl B, Sereno MI. Cortical surface-based analysis. I. Segmentation and surface reconstruction. Neuroimage. 1999;9(2):179–94. doi: 10.1006/nimg.1998.0395. [DOI] [PubMed] [Google Scholar]
- 29.Fischl B, Sereno MI, Dale AM. Cortical surface-based analysis. II: Inflation, flattening, and a surface-based coordinate system. Neuroimage. 1999;9(2):195–207. doi: 10.1006/nimg.1998.0396. [DOI] [PubMed] [Google Scholar]
- 30.Fischl B, et al. High-resolution intersubject averaging and a coordinate system for the cortical surface. Hum Brain Mapp. 1999;8(4):272–84. doi: 10.1002/(SICI)1097-0193(1999)8:4<272::AID-HBM10>3.0.CO;2-4. [DOI] [PMC free article] [PubMed] [Google Scholar]
- 31.Jovicich J, et al. Reliability in multi-site structural MRI studies: effects of gradient non-linearity correction on phantom and human data. Neuroimage. 2006;30(2):436–43. doi: 10.1016/j.neuroimage.2005.09.046. [DOI] [PubMed] [Google Scholar]
- 32.Han X, et al. Reliability of MRI-derived measurements of human cerebral cortical thickness: the effects of field strength, scanner upgrade and manufacturer. Neuroimage. 2006;32(1):180–94. doi: 10.1016/j.neuroimage.2006.02.051. [DOI] [PubMed] [Google Scholar]
- 33.Fischl B, et al. Automatically parcellating the human cerebral cortex. Cereb Cortex. 2004;14(1):11–22. doi: 10.1093/cercor/bhg087. [DOI] [PubMed] [Google Scholar]
- 34.Segonne F, et al. A hybrid approach to the skull stripping problem in MRI. Neuroimage. 2004;22(3):1060–75. doi: 10.1016/j.neuroimage.2004.03.032. [DOI] [PubMed] [Google Scholar]
- 35.Fischl B, et al. Sequence-independent segmentation of magnetic resonance images. Neuroimage. 2004;23(Suppl 1):S69–84. doi: 10.1016/j.neuroimage.2004.07.016. [DOI] [PubMed] [Google Scholar]
- 36.Fischl B, et al. Whole brain segmentation: automated labeling of neuroanatomical structures in the human brain. Neuron. 2002;33(3):341–55. doi: 10.1016/s0896-6273(02)00569-x. [DOI] [PubMed] [Google Scholar]
- 37.Fischl B, Liu A, Dale AM. Automated manifold surgery: constructing geometrically accurate and topologically correct models of the human cerebral cortex. IEEE Trans Med Imaging. 2001;20(1):70–80. doi: 10.1109/42.906426. [DOI] [PubMed] [Google Scholar]
- 38.Dale AM, Sereno MI. Improved localization of cortical activity by combining EEG and MEG with MRI cortical surface reconstruction: a linear approach. J Cogn Neurosci. 1993;5:162–176. doi: 10.1162/jocn.1993.5.2.162. [DOI] [PubMed] [Google Scholar]
- 39.Desikan RS, et al. An automated labeling system for subdividing the human cerebral cortex on MRI scans into gyral based regions of interest. Neuroimage. 2006;31(3):968–80. doi: 10.1016/j.neuroimage.2006.01.021. [DOI] [PubMed] [Google Scholar]
- 40.Heaton RK, et al. Wisconsin Card Sorting Test (WCST) manual, revised and expanded. Odessa, FL: Psychological Assessment Resources; 1993. [Google Scholar]
- 41.Kortte KB, Horner MD, Windham WK. The trail making test, part B: cognitive flexibility or ability to maintain set? Appl Neuropsychol. 2002;9(2):106–9. doi: 10.1207/S15324826AN0902_5. [DOI] [PubMed] [Google Scholar]
- 42.Corcoran R, Upton D. A role for the hippocampus in card sorting? Cortex. 1993;29(2):293–304. doi: 10.1016/s0010-9452(13)80182-7. [DOI] [PubMed] [Google Scholar]
- 43.Hermann BP, Wyler AR, Richey ET. Wisconsin Card Sorting Test performance in patients with complex partial seizures of temporal-lobe origin. J Clin Exp Neuropsychol. 1988;10(4):467–76. doi: 10.1080/01688638808408253. [DOI] [PubMed] [Google Scholar]
- 44.Garcia Espinosa A, et al. Wisconsin Card Sorting Test performance and impulsivity in patients with temporal lobe epilepsy: suicidal risk and suicide attempts. Epilepsy Behav. 2010;17(1):39–45. doi: 10.1016/j.yebeh.2009.09.010. [DOI] [PubMed] [Google Scholar]
- 45.Zarei M, et al. Combining shape and connectivity analysis: an MRI study of thalamic degeneration in Alzheimer’s disease. Neuroimage. 2010;49(1):1–8. doi: 10.1016/j.neuroimage.2009.09.001. [DOI] [PubMed] [Google Scholar]
- 46.Croxson PL, et al. Quantitative investigation of connections of the prefrontal cortex in the human and macaque using probabilistic diffusion tractography. J Neurosci. 2005;25(39):8854–66. doi: 10.1523/JNEUROSCI.1311-05.2005. [DOI] [PMC free article] [PubMed] [Google Scholar]
- 47.Petrides M. Lateral prefrontal cortex: architectonic and functional organization. Philos Trans R Soc Lond B Biol Sci. 2005;360(1456):781–95. doi: 10.1098/rstb.2005.1631. [DOI] [PMC free article] [PubMed] [Google Scholar]
- 48.Ramnani N, et al. New approaches for exploring anatomical and functional connectivity in the human brain. Biol Psychiatry. 2004;56(9):613–9. doi: 10.1016/j.biopsych.2004.02.004. [DOI] [PubMed] [Google Scholar]
- 49.Tomassini V, et al. Diffusion-weighted imaging tractography-based parcellation of the human lateral premotor cortex identifies dorsal and ventral subregions with anatomical and functional specializations. J Neurosci. 2007;27(38):10259–69. doi: 10.1523/JNEUROSCI.2144-07.2007. [DOI] [PMC free article] [PubMed] [Google Scholar]
- 50.Rushworth MF, Behrens TE, Johansen-Berg H. Connection patterns distinguish 3 regions of human parietal cortex. Cereb Cortex. 2006;16(10):1418–30. doi: 10.1093/cercor/bhj079. [DOI] [PubMed] [Google Scholar]
- 51.Cohen MX, et al. Connectivity-based segregation of the human striatum predicts personality characteristics. Nat Neurosci. 2009;12(1):32–4. doi: 10.1038/nn.2228. [DOI] [PubMed] [Google Scholar]
- 52.Apostolova LG, et al. Subregional hippocampal atrophy predicts Alzheimer’s dementia in the cognitively normal. Neurobiol Aging. 2010;31(7):1077–88. doi: 10.1016/j.neurobiolaging.2008.08.008. [DOI] [PMC free article] [PubMed] [Google Scholar]
- 53.Apostolova LG, et al. Hippocampal, caudate, and ventricular changes in Parkinson’s disease with and without dementia. Mov Disord. 2010;25(6):687–8. doi: 10.1002/mds.22799. [DOI] [PMC free article] [PubMed] [Google Scholar]
- 54.Sherman EM, Slick DJ, Eyrl KL. Executive dysfunction is a significant predictor of poor quality of life in children with epilepsy. Epilepsia. 2006;47(11):1936–42. doi: 10.1111/j.1528-1167.2006.00816.x. [DOI] [PubMed] [Google Scholar]
- 55.Monchi O, et al. Wisconsin Card Sorting revisited: distinct neural circuits participating in different stages of the task identified by event-related functional magnetic resonance imaging. J Neurosci. 2001;21(19):7733–41. doi: 10.1523/JNEUROSCI.21-19-07733.2001. [DOI] [PMC free article] [PubMed] [Google Scholar]
- 56.Buckley MJ, et al. Dissociable components of rule-guided behavior depend on distinct medial and prefrontal regions. Science. 2009;325(5936):52–8. doi: 10.1126/science.1172377. [DOI] [PubMed] [Google Scholar]
- 57.Keller SS, et al. Quantitative MRI of the prefrontal cortex and executive function in patients with temporal lobe epilepsy. Epilepsy Behav. 2009;15(2):186–95. doi: 10.1016/j.yebeh.2009.03.005. [DOI] [PubMed] [Google Scholar]
- 58.Graham S, et al. Role of medial cortical, hippocampal and striatal interactions during cognitive set-shifting. Neuroimage. 2009;45(4):1359–67. doi: 10.1016/j.neuroimage.2008.12.040. [DOI] [PubMed] [Google Scholar]
Associated Data
This section collects any data citations, data availability statements, or supplementary materials included in this article.