Abstract
Structurally deciphering complex neural networks requires technology with sufficient resolution to allow visualization of single cells and their intimate surrounding connections. Scanning electron microscopy (SEM), coupled with serial ion ablation (SIA) technology, presents a new avenue to study these networks. SIA allows ion ablation to remove nanometer sections of tissue for SEM imaging, resulting in serial section data collection for three-dimensional reconstruction. Here we highlight a method for preparing retinal tissues for imaging of photoreceptors by SIA-SEM technology. We show that this technique can be used to visualize whole rod photoreceptors and the internal disc elements from wild-type (wt) mice. The distance parameters of the discs and photoreceptors are in good agreement with previous work with other methods. Moreover, we show that large planes of retinal tissue can be imaged at high resolution to display the packing of normal rods. Finally, SIA-SEM imaging of retinal tissue from a mouse model (Nrl−/−) with phenotypic changes akin to the human disease enhanced S-cone syndrome (ESCS) revealed a structural profile of overall photoreceptor ultrastructure and internal elements that accompany this disease. Overall, this work presents a new method to study photoreceptor cells at high structural resolution that has a broad applicability to the visual neuroscience field.
Keywords: Cone photoreceptor, enhanced S-cone syndrome, focused ion beam, Nrl, retina, rod photoreceptor, serial ion ablation, vision
1. Introduction
Structurally deciphering complex neural networks requires technology with sufficient resolution to allow visualization of single cells and their intimate surrounding connections. Techniques relying on light microscopy (Livet et al., 2007) in most cases cannot resolve neural network components that have diameters that are substantially below the wavelength of light (Helmstaedter et al., 2008). Electron microscopy, on the other hand, provides the resolution required to visualize and structurally characterize neural networks (Harris et al., 2006, Urban, 2008). Transmission electron microscopy (TEM) has high lateral resolution, but is limited by less resolution in the z-direction. This distortion limits the reliability of reconstructions resulting from serial sectioning.
Scanning electron microscopy (SEM) coupled with focused ion beam (FIB) technology (Reyntjens and Puers, 2001) alleviates the distortion that accompanies TEM serial sectioning because each tissue slice is imaged before sectioning. FIB technology, although widely used earlier in material sciences (Glanville, 1989, Young, 1993, Walker et al., 1996, Brugger et al., 1997), has only recently been applied to the biological sciences (Young et al., 1993, Kamino et al., 2004, Danelon et al., 2006, Heymann et al., 2006, Knott et al., 2008, Bittermann et al., 2009, Hekking et al., 2009, Heymann et al., 2009, Kidd et al., 2010). The dual beam system is a scanning microscope with an electron beam column and an ion beam column mounted on the same specimen chamber. The advantage of this dual beam technology is that the focused ion beam can be used for milling whereas the electron beam is used for SEM imaging. The ion source (gallium) removes material from the surface of the specimen uniformly so it can be repeatedly imaged by the scanning electron beam. As a result, a trench is created, thus enabling imaging of the specimen’s interior (Kamino et al., 2004, Sugiyama and Sigesato, 2004, Heymann et al., 2006, Moghadama et al., 2006). We refer to this technique henceforth as serial ion ablation SEM (SIA-SEM).
The neural tissue of the eye, the retina, is composed of two types of light-sensitive neurons: rod and cone photoreceptors. Neural signals from these photoreceptors travel through a series of neurons to eventually reach the visual cortex of the brain (Rodieck, 1998). Understanding of their structures and internal architecture can not only elucidate differences in rod and cone signaling (Luo et al., 2008, Mustafi et al., 2009), but also provide insight into the structural changes that accompany retinal diseases. Cryoelectron tomography elucidated the three-dimensional structure of the vitrified murine rod photoreceptor (Nickell et al., 2007), but this was restricted by the size limit of the method, thus necessitating development of methods with a viewing area large enough to visualize photoreceptors at high resolution to decipher their internal architecture.
In this work we demonstrate a methodology for preparation and examination of photoreceptor ultrastructure using SIA-SEM technology. SIA-SEM analysis of wild-type (wt) retinal tissue at various magnification and ablation conditions allowed sufficient field of view and resolution to reveal the larger scale packing architecture of rod photoreceptors and also the more detailed packing of internal photoreceptor disc elements. Examination and analysis of retinal tissue from a mouse with phenotypic changes seen in the human retinopathy enhanced S-cone syndrome (ESCS) revealed the structural disruptions that accompany this disease. The methodology in this work presents a new way to study the neuronal cells of the eye and can be extended to other neuronal tissues for more detailed structural characterizations, especially those changes that occur in the face of disease.
2. Materials and Methods
2.1 Eye Tissue Preparation
All animal procedures and experiments were approved by the Case Western Reserve University Animal Care Committees and conformed to both the recommendations of the American Veterinary Medical Association Panel on Euthanasia and the Association of Research for Vision and Ophthalmology. Wt mice of the strain C57/BL6 were obtained from The Jackson Laboratory (Bar Harbor, Maine). Nrl-deficient mice were from Dr. Anand Swaroop (University of Michigan) and genotyped as described previously (Mears et al., 2001). Wt and Nrl−/− mice at age 4 weeks were sacrificed and eye cups were dissected under a surgical microscope. The cornea was cut and lens removed. Retinas and retinal pigmented epithelium (RPE) layers were carefully separated. Tissues were then fixed in a solution of 2.5% glutaraldehyde, 0.1 M cacodylate buffer, 2% sucrose, pH 7.4, for 24 h at 4 °C. Samples were washed the next day in 0.1 M cacodylate buffer, 2% sucrose, pH 7.4, and subsequently fixed in 1% OsO4 in 0.06 M cacodylate buffer, 5% sucrose, pH 7.4, for 2 h. The samples were then washed and dehydrated with ethanol and dried by a critical point drying method (Bray et al., 1993). The retina and RPE were separately mounted on standard SEM stubs with carbon tape and the edges covered with silver paste as needed and stored overnight at 30 °C. The cured samples were finally sputter-coated with a 5–10 nm thick gold layer.
2.2 Sectioning and Imaging
The prepared retina or RPE sample was placed inside an xT Nova Nanolab 200 or Helios Nanolab 650 (FEI, Eindhoven, The Netherlands) dual beam microscope system fitted with a field emission gun for scanning electron imaging and a focused ion beam of gallium ions for milling. Once the area of interest was identified, a ~1–2 µm thick layer of platinum (Pt) was deposited at ion currents ranging from 1 to 7 nA by a gas injection system using a Pt organometallic vapor specie. The current used to layer Pt was dependent on the experiment. In cases where cells were tightly packed and were sufficiently sputter coated that there were not empty patches, Pt was deposited at high current (3–7 nA) in a short time (1–5 min) to coat the area of interest. In cases where the cells were not sufficiently packed and thus exhibited uneven sputter coating, Pt was deposited at lower current (0.4–3 nA) over a longer time (15–30 min) to fill in the empty patches and generate an even Pt coat over the area of interest.
The imaging face was prepared by setting up a cleaning cross section using the FIB at 30 kV. To allow imaging of the internal architecture with the electron beam, a trench was created in front of the Pt protected region of interest by milling away with the ion beam at currents ranging from 7 to 30 nA. The milled face was larger in both x and y directions than the area to be imaged, to prevent any ion deposition that could interfere with imaging. Once the trench was milled to the edge of the first protected sample face to be imaged, a 0.2 µm high fiducial pad was patterned at a current of 0.79 nA away from the field of interest to provide a landmark for microscopic alignment before each cut.
Image collection parameters were set up using ‘slice-and-view’ G2 and G3 imaging software (FEI). Ion beam parameters were set to mill layers from the region of interest, i.e., 35–50 nm thick for these experiments. Different milling sizes were achieved by varying the deflection of the ion beam. After each layer was removed, a secondary electron image was collected in the immersion lens mode. Secondary electron or backscatter electron scanning images were typically recorded at accelerating voltages of 2 to 3 kV and detected via either the in-lens detector or the ETD detector in the field free mode. Images were collected with a dwell time of 10–30 µs/pixel at a resolution of 4096 × 3536 pixels. For each image collected, the contrast was adjusted automatically. Milling and image acquisition time for each section averaged ~4 min. A typical experiment ranged from 100–500 collected slices over 6 to 30 h of acquisition time. Automation and drift adjustment allowed collection of serial sections overnight without any operator present.
2.3 Image Alignment and Three-dimensional Reconstructions
Acquired SEM images were opened with Fiji-win32 (free for use released under the General Public License) and merged to form a stack. The stack was registered by using a rigid feature extraction model that accounted for translation and rotation of sections over the time course of the experiment. The software extracted key objects from a set of reference images and found candidate matching features based on Euclidean distance of their feature vectors over the time course of experiment. In cases where the collected image files were too large to open in Fiji-win32 running at full memory capacity, stacks were virtually registered. Registered images were saved and then imported into the Reconstruct program (Fiala, 2005) and the distance between each section was specified.
Individual photoreceptors and their disc elements were mapped in Reconstruct. With the ‘Autotracing’ tab in ‘Series Options’, the pixel intensity values were adjusted in the ‘Wildfires’ tools window for the program to recognize the boundaries of each photoreceptor disc. Once these parameters were set (these varied for each experiment, based on brightness and contrast), the Wildfire tool was used to fill in each individual disc and subsequently render it in 3D. Individual photoreceptor cell outlines were manually traced by hand because the sensitivity of the Wildfire tool did not always allow contrast distinction between cells.
3. Results
3.1 Retinal sample preparation and SIA-SEM imaging
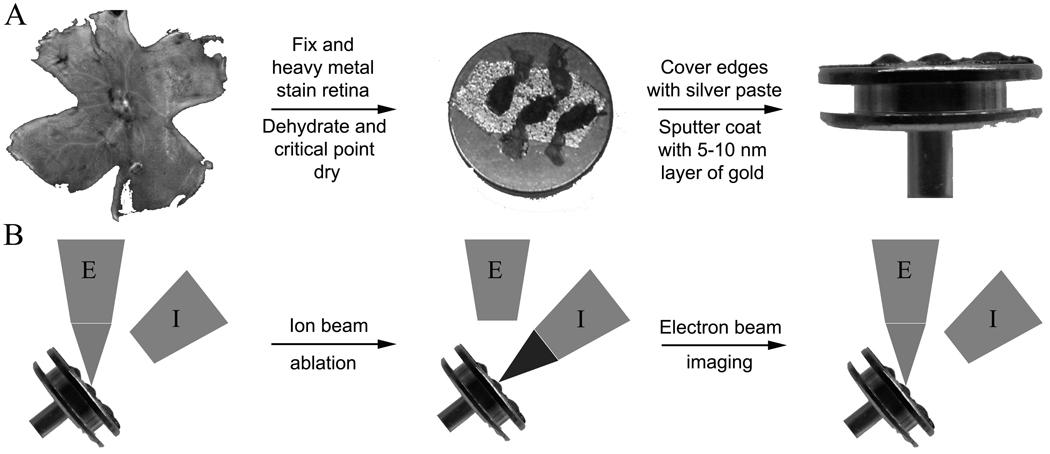
Mouse retinas were prepared for SIA-SEM analysis by the steps outlined in Fig. 1A. Isolated retinas were subjected to chemical fixation to preserve the photoreceptor architecture. In SEM the outermost structures are examined, which are first in contact with the fixative and therefore are fixed immediately to avoid artifacts. Moreover, dried samples are preferred for investigating external structures of cells, such as photoreceptors, whereas for cases of cell ultrastructure, such as whole eye mounts, samples can be embedded in plastic (Leser et al., 2009). Heavy metal incubations with osmium and uranium were done to increase contrast during imaging. In addition, once the retinas were critical point dried and mounted on SEM stubs, the edges of the tissue were covered with silver paste and the whole stub sputter coated with a thin layer of gold. The FIB milling process introduces highly energetic gallium ions to the sample surface, which can induce surface damage. To minimize such damage the sample surface was protected by 10 nm of sputtered gold film (Drobne et al., 2007) as well as having the regions of interest initially Pt coated with the electron beam followed by a thicker ion beam Pt depostion.
Fig. 1. Schematics of retinal sample preparation and FIB-SEM based experimentation.
(A) Enucleated mouse eyes were dissected and the retina carefully removed and separated from the retinal pigmented epithelium. The retina was then chemically fixed and incubated with heavy metal solutions consisting of osmium and uranium. Samples were dehydrated, critical point dried and placed on SEM stubs, the edges covered with conducting silver paste, and finally sputter coated with a 5–10 nm layer of gold to remove any charge build up at the surface. (B) Samples then were placed inside the FIB-SEM and tilted to 52° to accommodate accurate ion ablation (the ion column is positioned at 52° to the electron column). The principle is to image the surface with the electron beam, ablate off a thin layer (35–50 nm) with the ion beam, and then reimage the new surface with the electron beam.
Prepared retinal samples were loaded into an xT Nova Nanolab 200 or a Helios Nanolab 650 Quanta 200 3D FEI FIB-SEM instrument for analysis. The principles of SIA-SEM imaging are outlined in Fig. 1B. The FIB-SEM allowed collection of serial sections by sequential scans of electron and ion beams. The electron beam provides an image of the initial surface. The gallium ion beam in our experiments was set to remove layers by ablation ranging from 35–50 nm in thickness. By using a deposited fiducial landmark, ablation with the FIB was repeated due to the ion beam drift control correction with an overall variation of <0.5% between the predicted and actual thickness of material removed. After each ion beam section, the newly exposed surface was imaged with the electron beam. Each image provided a view of photoreceptor architecture and internal disc elements and thus the stack of successive images provided an informative three-dimensional map of photoreceptors.
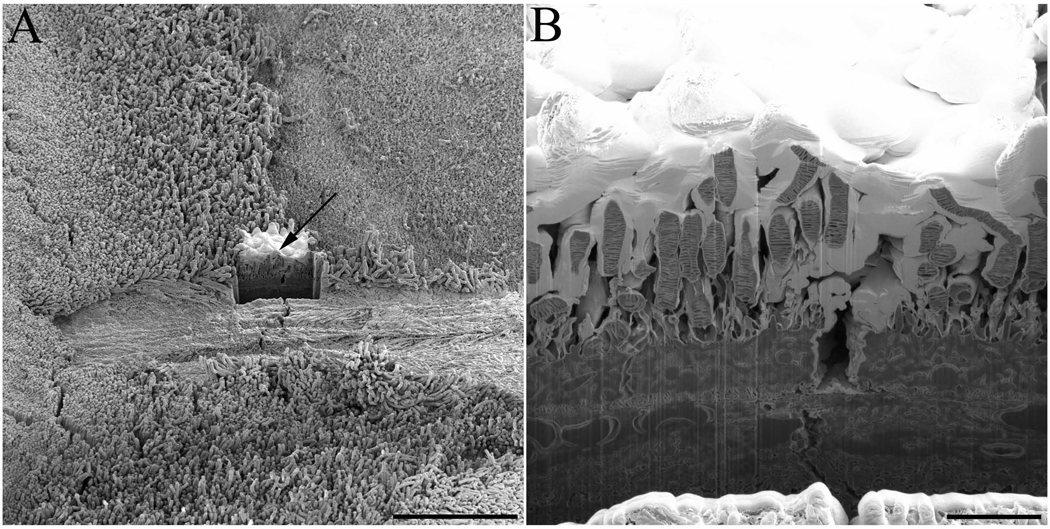
Once an area of interest in the retinal tissue was located using the electron beam for visualization, this region was further protected with deposition of platinum, using the ion beam to smooth out the photoreceptor surface topography (Fig. 2A). This ‘smoothing out’ ensured that the photoreceptors were evenly milled and remained parallel to the direction of the ion beam, thereby limiting any curtaining effects (Heymann et al., 2006, Knott et al., 2008). A cleaning cross section was used to create a trench that allowed visualization of the photoreceptor internal elements (Fig. 2B). SEM imaging was done using secondary electron detection since our interest was visualization of topographic information. Low beam energies were employed to limit the depth of electron penetration and accurately image the surface of each face (Hennig and Denk, 2007).
Fig. 2. Experimental set-up for photoreceptor observation with FIB-SEM technology.
(A) Once an area of interest in critical point dried sample of wt mouse retina was selected it was protected by application of a thin layer of platinum inside the FIB-SEM (indicated by arrow), a trench was created by application of an ion beam cleaning cross section. (B) A close-up view of the created trench reveals interior elements of rod photoreceptors that can be imaged by the electron beam. Scale bars in panels A and B are 50 and 5 µm, respectively.
3.2 Insights from SIA-SEM imaging of rod outer segments
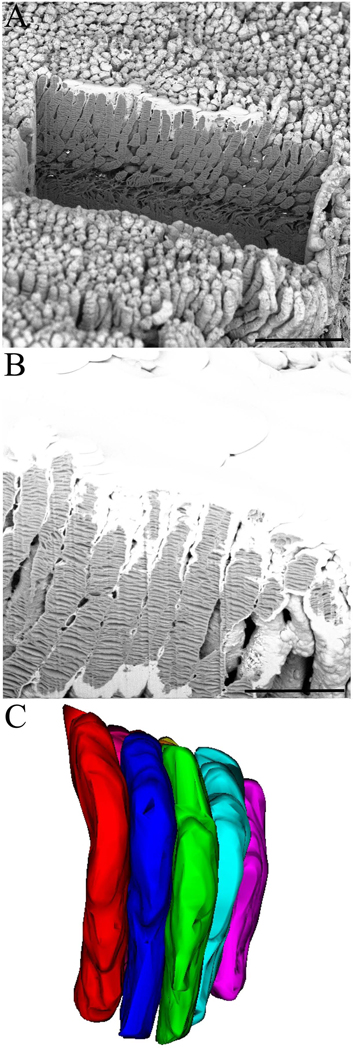
Preparation of wt mouse retina, which is predominantly populated by rod photoreceptors, allowed structural analysis of these specialized neuronal cells. By varying the magnification and step size of the ion beam cuts, we were able to examine different structural aspects of rod photoreceptors. The first set of experiments entailed examining the wt mouse retina sample at lower magnifications to discern the overall arrangement of individual rod cells and their packing. As outlined before, the created trench in front of the area of interest allowed visualization of the internal architecture of the rod photoreceptors (Fig. 3A) and revealed the intimate packing of these cells next to each other (Fig. 3B). The SIA serial sectioned data set was loaded into Fiji-win32 for stack alignment and registration. The data was then loaded into Reconstruct for three-dimensional reconstruction of individual photoreceptor cells (Fig. 3C, also see Movie 1). The SIA-SEM data and subsequent reconstructions revealed that the rod photoreceptors had diameter of 1.2 µm ±0.1 µm, in agreement with previously published data (Liang et al., 2003, Liang et al., 2004, Nickell et al., 2007).
Fig. 3. Layers of neatly stacked rod photoreceptors in wt mouse retina.
(A) A view of the trench created at the beginning of an experiment designed to visualize the interiors of the rod photoreceptors. (B) An electron beam image showing the outlines of each rod photoreceptor and the internal disc elements. (C) The resulting three-dimensional reconstruction of rods showing how neatly and tightly these cells are stacked in mouse retina. Scale bars in panels A and B are 10 and 5 µm, respectively.
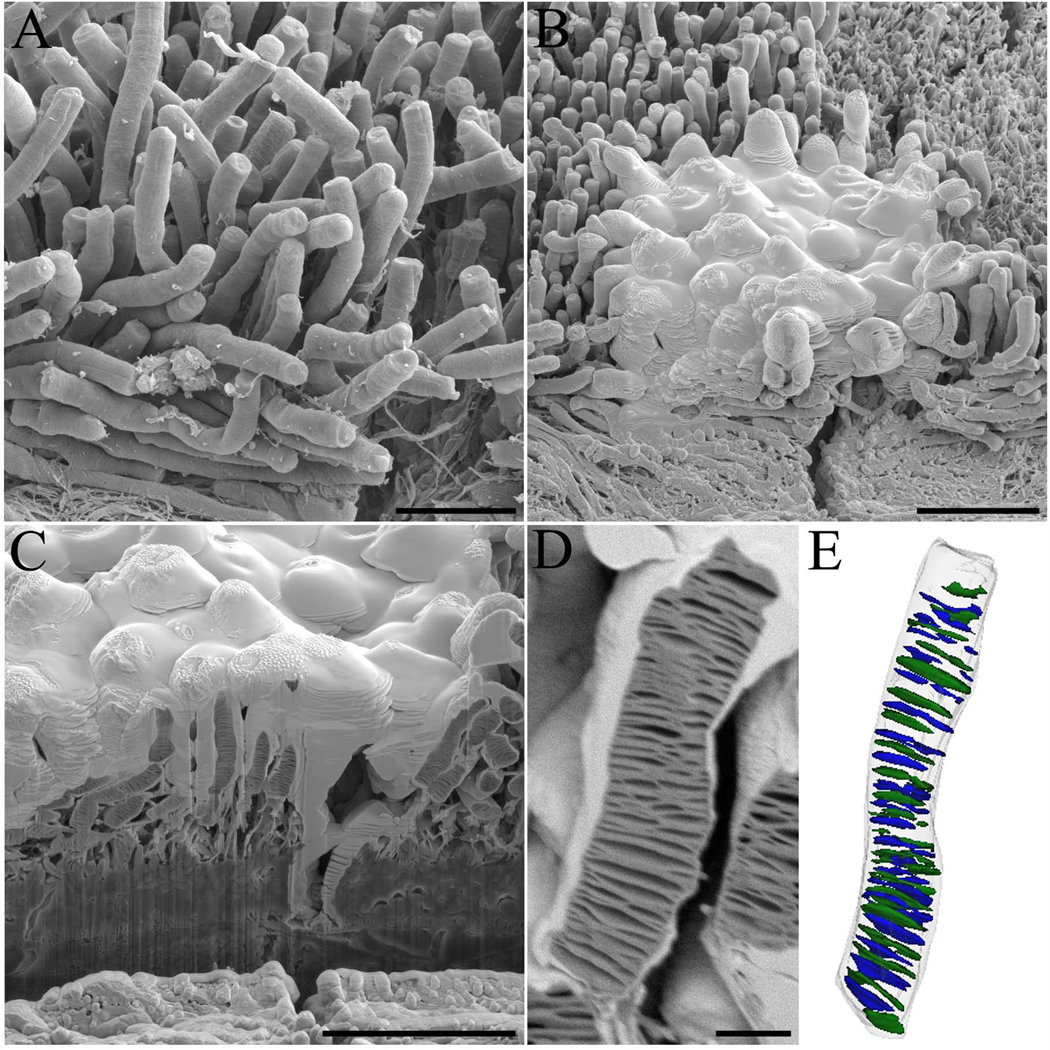
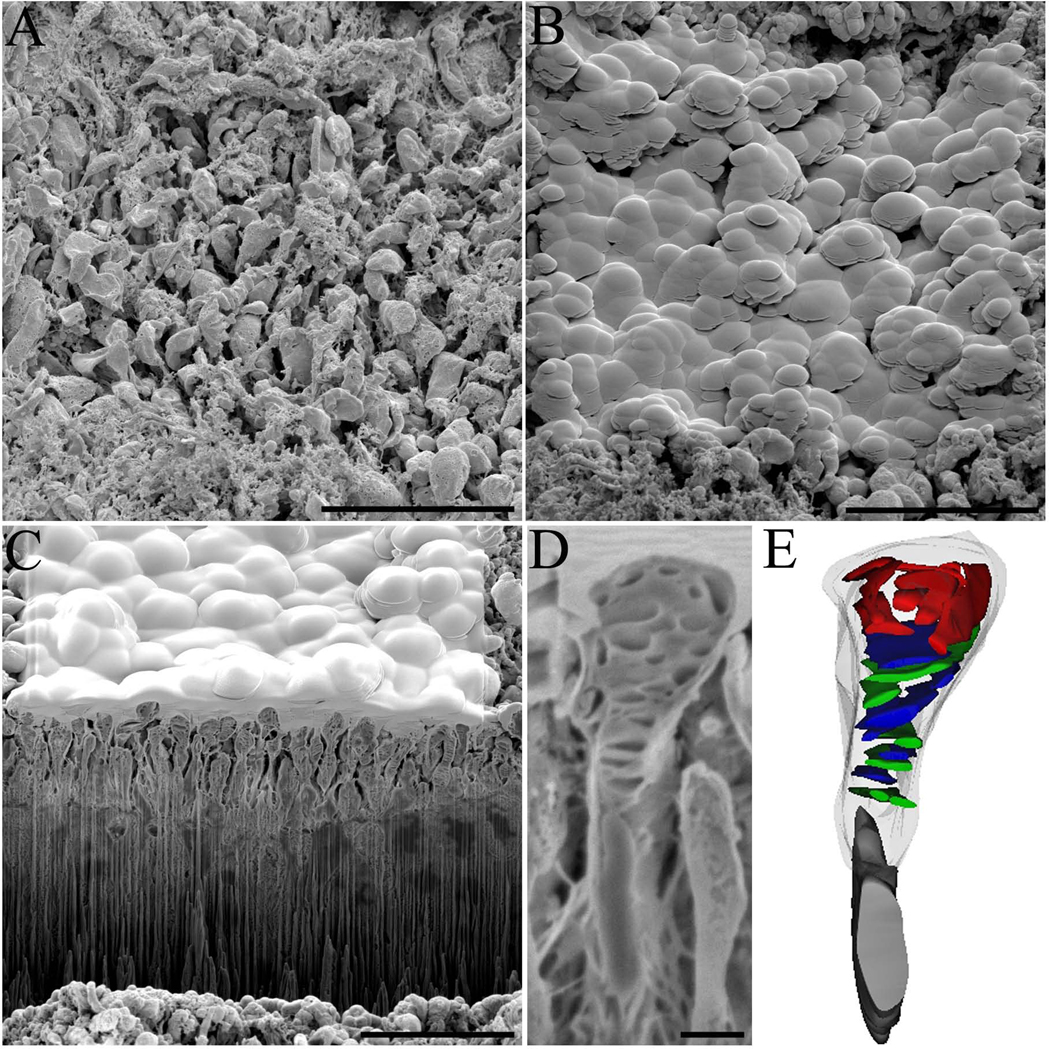
To better examine the internal photoreceptor disc architecture, rod photoreceptors were imaged at higher magnification with more precise ion beam cuts (35 nm) to accurately identify and reconstruct the discs. Because rod photoreceptors of a critical point-dried sample do not form an even surface (Fig. 4A), the area of interest was protected with a thick layer of deposited platinum (Fig 4B) to minimize milling artifacts such as excessive streaking or vertical stripes along the block face known as curtaining (Knott et al., 2008). Again, the trench created allowed visualization of the internal disc elements of rod photoreceptor outer segments (Fig. 4C). Moreover, at this resolution, one could examine the rod cell and view the intimate internal disc structures (Fig. 4D) and three-dimensionally reconstruct a portion of the rod outer segment complete with internal disc structures (Fig. 4E). The reconstructed discs had an disc diameter of 1.1 µm ±0.3 µm (n=41 discs), in agreement with previously published data (Liang et al., 2003, Liang et al., 2004, Nickell et al., 2007).
Fig. 4. Internal architecture of wt mouse rod photoreceptors.
(A) A view of rod photoreceptors in a critical point-dried sample of wt mouse retina and (B) subsequent deposition of platinum on top of the region of interest to protect its surface from milling artifacts during sectioning. (C) The created trench allows visualization of the internal architecture of rod photoreceptors with (D) a zoomed image of a single rod photoreceptor used for reconstruction shown. (E) The resulting three-dimensional reconstruction of the rod photoreceptor and internal disc elements. The rod cell outer segment membrane is outlined in a transparent gray color with the internal discs shown in blue and green colors. Scale bars in panels A, B, C and D are 5, 10, 10, and 1 µm, respectively.
3.3 Structural understanding of visual disease phenotypes
After examining rod photoreceptors, we sought to apply this technique to understand the structural changes in a retinopathy. We used the mouse with a knockout of the neural retina leucine zipper transcription factor (Nrl−/−), which has a retina that is almost exclusively populated with S-cone like cells (Mears et al., 2001, Daniele et al., 2005) and shares phenotypic features with the human condition ESCS (Jacobson et al., 1990, Jacobson et al., 1991, Hood et al., 1995, Milam et al., 2002). Nrl−/− mouse retinas were similarly prepared as wt mouse retinas and analyzed by SIA-SEM. Initial imaging of Nrl−/− photoreceptors highlighted an abnormal phenotype wherein the photoreceptor outer segments adopted a bulbous appearance (Fig. 5A). These photoreceptors did not exhibit tight packing, so platinum application for even milling was done at low current (0.4 nA) for longer periods (15–30 min) to get an uniform coating (Fig. 5B). To visualize the Nrl−/− photoreceptor outer segments (Fig. 5C), an ion-beam cleaning cross section pattern was used. The photoreceptors displayed aberrant packing, but even more striking was the disorganization of the internal architecture of the outer segments (Fig. 5D). Three-dimensional reconstructions of the sections (Fig. 5E) revealed that whereas the discs near the photoreceptor inner segment retained normal morphology, and had some connections to the photoreceptor membrane akin to normal S-cones, the photoreceptor outer segment head exhibited a collection of disorganized structures that could explain the abnormal outer segment phenotype. The disorganized structures ranged in size from 0.4–0.8 µm, and thus most likely do not represent normal photoreceptor disc membranes.
Fig. 5. Internal architecture of Nrl−/− photoreceptors.
Shown are (A) Photoreceptors from a critical point dried sample of Nrl−/− mouse retina and (B) subsequent deposition of platinum on top of a region of interest to protect the surface from milling artifacts during sectioning. (C) A created trench allows visualization of the internal architecture of Nrl−/−photoreceptors with (D) a zoomed image of a single Nrl−/−photoreceptor used for reconstruction shown. (E) The resulting three-dimensional reconstruction of an Nrl−/−photoreceptor and its disrupted internal disc elements. Towards the inner segment, the disc elements stack normally and retain some connection to the outer segment. The Nrl−/−photoreceptor inner segment is shown in gray and the outer segment in transparent gray. Disc elements inside the outer segment are shown in blue and green with the disrupted elements in red. Scale bars in panels A, B, C and D are 10, 10, 10, and 1 µm, respectively.
4. Discussion
Photoreceptors are unique neuronal cell types that respond to light and mediate normal visual function in the retina. With photoreceptor diameters on the micrometer scale and internal disc element structures even smaller, high resolution techniques are required to study these fine structures. Moreover, with retinal dystrophies caused by photoreceptor degeneration as the major cause of familial blindness (den Hollander et al., 2010), it is of great importance to understand the structural architecture of photoreceptors, and the changes that accompany disease.
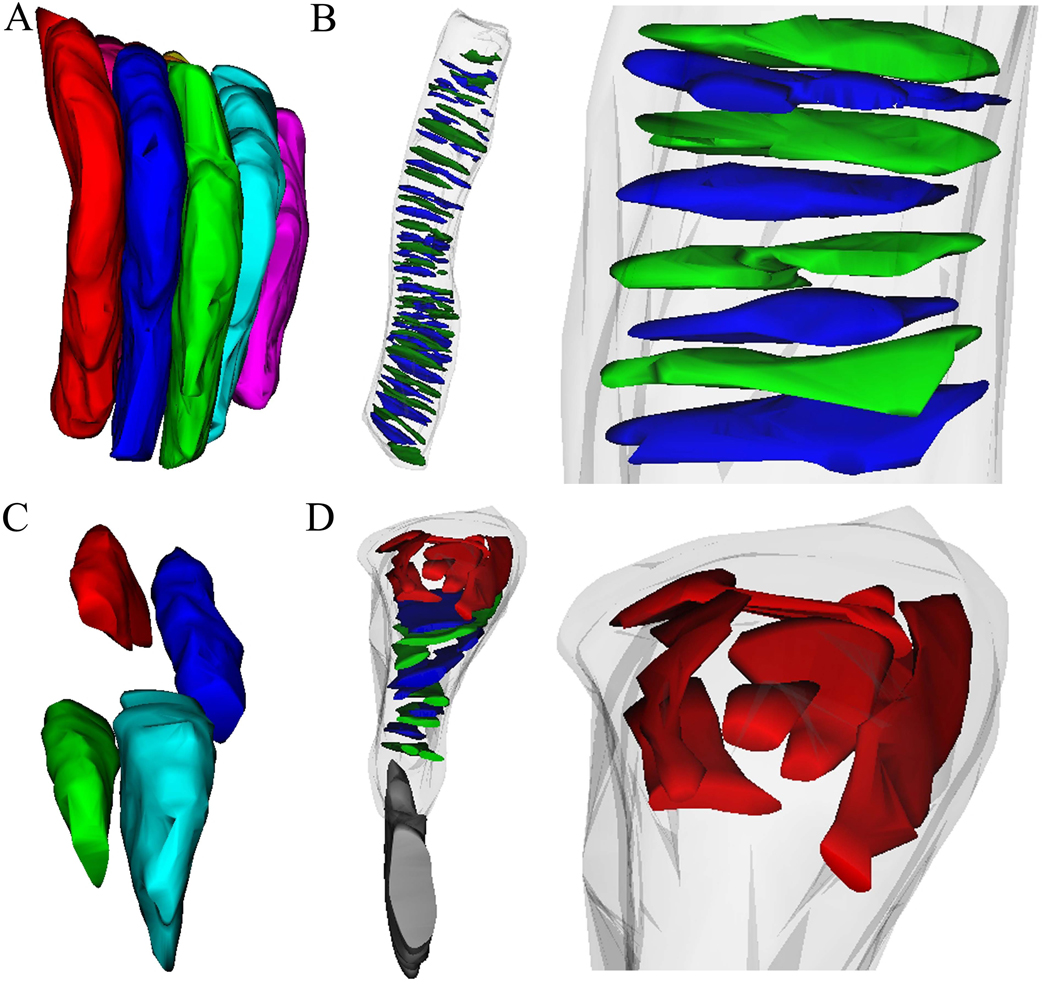
A dual beam scanning electron microscope coupled with a focused ion beam presents a new avenue for structural probing of photoreceptors. SEM imaging allows collection of topographic images because the secondary-electron signal depends strongly on the orientation of the surface. However, this technology alone can only reveal exposed surface topography, thus excluding it from examining the internal architecture of cells. However, coupled FIB technology allows serial sectioning of tissue by ion ablation and exposure of interior surfaces for SEM imaging. Moreover, precise and controlled sectioning by the FIB allows one to reconstruct photoreceptor cell types and examine their internal disc elements. When looking at overall photoreceptor architecture (Fig. 6A–B), our results for photoreceptor diameters and disc structure distances for wt mouse rod cells agree well with previously published data, and even with those that used non-fixed, vitrified photoreceptor samples (Nickell et al., 2007). Once we had established this method in wt mice, we examined a mouse model that recapitulates the phenotype seen in the human ESCS retinopathy. SIA-SEM examination of photoreceptors from the Nrl−/− mouse revealed structural changes that accompany this disease. Photoreceptor packing was severely disrupted, with Nrl−/− photoreceptors more loosely packed (Fig. 6C) than rods in wt mouse retina. Furthermore, reconstructions of individual Nrl−/−photoreceptors revealed that there was considerable disruption in the normal packing of internal photoreceptor discs, with abnormal structures collected at the head of photoreceptor outer segments at the RPE interface (Fig. 6D).
Fig. 6. Three-dimensional reconstructions from SIA-SEM data reveal packing architecture and internal elements of photoreceptors and the changes that accompany a disease.
(A) Reconstructed rod photoreceptors from wt mouse retina with a diameter of 1.2 ± 0.1 µm are shown to align and pack tightly together. Reconstructions of photoreceptor internal elements reveal that (B) discs in wt mouse rods stack orderly with an average disc diameter of 1.1 µm ± 0.3 µm (n=41 discs). (C) The photoreceptor packing density is greatly reduced in the Nrl−/−retina, mainly due to the aberrant shapes of the outer segments, which have a diameter of 1.0 µm ± 0.2 µm. Meanwhile, (D) The Nrl−/−photoreceptor reveals abnormal structures at the RPE interface with these elements ranging in size from 0.4–0.8 µm.
These results highlight the applicability of SIA-SEM to visual science research. Recently another hybrid SEM technique was introduced that utilizes cutting of serial sections with an ultramicrotome rather than ion ablation in the SEM chamber. This serial block face (SBF) SEM (Denk and Horstmann, 2004) is a complementary approach to SIA-SEM. Although the FIB can image voxels of 4 × 4 × 10 nanometers compared to the 20 × 20 × 25 nanometer resolution limit of SBF-SEM, the SBF-SEM can image much greater volumes, on the order of 2–3 orders of magnitude, making the two complementary tools to probe biological architecture. Compared to SBF-SEM, SIA-SEM is less sensitive to electron-beam induced damage of the sample, and thus allows more precise cutting. This allows the use of higher electron doses allowing higher resolution and a greater signal-to-noise ratio (Helmstaedter et al., 2008, Knott et al., 2008). Critical point-dried samples, such as we used, cannot be examined using SBF technology, which requires block-embedded samples, presenting FIB as a unique technique to visualize surface topography and internal architecture of such biological tissue.
Sample preparation that relies on fixation, heavy metal staining, and dehydration, can introduce artifacts, raising the prospect of using cryo-substituted samples (Rosenkra, 1970). Critical point dried samples of biological tissue can undergo swelling and collapse of smaller structures, but these can be overcome with improved fixation techniques (Kietzmann, 1991). Despite this, our results with critical point dried wt mouse retina are in good agreement with distance measurements for photoreceptors obtained from vitrified samples examined by cryoelectron tomography. Furthermore, even as the prospect of imaging frozen cells in principle offers unique opportunities to investigate subcellular architecture in the absence of artifacts introduced by fixatives and stains, there are many obstacles such as specimen charging that must be overcome for this approach to be successful, and sublimation of ice near the surface is still required to generate useful image contrast. So for exploring subcellular architecture at resolutions in the range of tens of nanometers, there remains considerable value to using fixed and stained cells. The SIA-SEM presents a new avenue to investigate prepared neuronal tissues at nanometer resolution for structural characterization.
Supplementary Material
Data collection and reconstruction of rod photoreceptors. The first view shows data collected during a SIA-SEM experiment in the left panel, whereas subsequent reconstructions of those same sections in Reconstruct are shown in the right panel. Three rods stacked next to each other are traced and then three that stack behind those three begin to appear and are traced. The final view is a three-dimensional reconstruction of 9 rod cells, stacked 3by3, to reveal how tightly these cells pack in the retina.
Acknowledgements
This research was supported by NIH grants EY009339, GM079191, EY019478, and by an unrestricted grant from Amgen Inc. D.M. was supported in part by the CWRU Medical Scientist Training Program grant T32GM007250 from the National Institutes of Health, the Visual Sciences Training Grant T32EY007157 from the National Institutes of Health, and the Maurice E. Müller Foundation of Switzerland.
Abbreviations
- ESCS
enhanced S-cone syndrome
- FIB
focused ion beam
- Nrl
neural retina leucine zipper
- SBF
serial block face
- SIA
serial ion ablation
- SEM
scanning electron microscopy
- TEM
transmission electron microscopy
- wt
wild-type
Footnotes
Publisher's Disclaimer: This is a PDF file of an unedited manuscript that has been accepted for publication. As a service to our customers we are providing this early version of the manuscript. The manuscript will undergo copyediting, typesetting, and review of the resulting proof before it is published in its final citable form. Please note that during the production process errors may be discovered which could affect the content, and all legal disclaimers that apply to the journal pertain.
References
- Bittermann AG, Burkhardt C, Hall H. Imaging of cell-to-material interfaces by SEM after in situ focused ion beam milling on flat surfaces and complex 3D-fibrous structures. Adv Eng Mater. 2009;11:B182–B188. [Google Scholar]
- Bray DF, Bagu J, Koegler P. Comparison of hexamethyldisilazane (HMDS), Peldri II, and critical-point drying methods for scanning electron microscopy of biological specimens. Microsc Res Tech. 1993;26:489–495. doi: 10.1002/jemt.1070260603. [DOI] [PubMed] [Google Scholar]
- Brugger J, Beljakovic G, Despont M, deRooij NF, Vettiger P. Silicon micro/nanomechanical device fabrication based on focused ion beam surface modification and KOH etching. Microelectronic Engineering. 1997;35:401–404. [Google Scholar]
- Danelon C, Santschi C, Brugger J, Vogel H. Fabrication and functionalization of nanochannels by electron-beam-induced silicon oxide deposition. Langmuir. 2006;22:10711–10715. doi: 10.1021/la061321c. [DOI] [PubMed] [Google Scholar]
- Daniele LL, Lillo C, Lyubarsky AL, Nikonov SS, Philp N, Mears AJ, Swaroop A, Williams DS, Pugh EN. Cone-like morphological, molecular, and electrophysiological features of the photoreceptors of the Nrl knockout mouse. Investigative Ophthalmology & Visual Science. 2005;46:2156–2167. doi: 10.1167/iovs.04-1427. [DOI] [PMC free article] [PubMed] [Google Scholar]
- den Hollander AI, Black A, Bennett J, Cremers FPM. Lighting a candle in the dark: advances in genetics and gene therapy of recessive retinal dystrophies. J Clin Invest. 2010;120:3042–3053. doi: 10.1172/JCI42258. [DOI] [PMC free article] [PubMed] [Google Scholar]
- Denk W, Horstmann H. Serial block-face scanning electron microscopy to reconstruct three-dimensional tissue nanostructure. Plos Biology. 2004;2:1900–1909. doi: 10.1371/journal.pbio.0020329. [DOI] [PMC free article] [PubMed] [Google Scholar]
- Drobne D, Milani M, Leser V, Tatti F. Surface damage induced by FIB milling and imaging of biological samples is controllable. Microscopy Research and Technique. 2007;70:895–903. doi: 10.1002/jemt.20494. [DOI] [PubMed] [Google Scholar]
- Fiala JC. Reconstruct: a free editor for serial section microscopy. J Microsc-Oxford. 2005;218:52–61. doi: 10.1111/j.1365-2818.2005.01466.x. [DOI] [PubMed] [Google Scholar]
- Glanville J. Focused ion-beam technology for integrated-circuit modification. Solid State Technology. 1989;32:270–272. [Google Scholar]
- Harris KM, Perry E, Bourne J, Feinberg M, Ostroff L, Hurlburt J. Uniform serial sectioning for transmission electron microscopy. Journal of Neuroscience. 2006;26:12101–12103. doi: 10.1523/JNEUROSCI.3994-06.2006. [DOI] [PMC free article] [PubMed] [Google Scholar]
- Hekking LHP, Lebbink MN, De Winter DAM, Schneijdenberg C, Brand CM, Humbel BM, Verkleij AJ, Post JA. Focused ion beam-scanning electron microscope: exploring large volumes of atherosclerotic tissue. J Microsc-Oxford. 2009;235:336–347. doi: 10.1111/j.1365-2818.2009.03274.x. [DOI] [PubMed] [Google Scholar]
- Helmstaedter M, Briggman KL, Denk W. 3D structural imaging of the brain with photons and electrons. Current Opinion in Neurobiology. 2008;18:633–641. doi: 10.1016/j.conb.2009.03.005. [DOI] [PubMed] [Google Scholar]
- Hennig P, Denk W. Point-spread functions for backscattered imaging in the scanning electron microscope. J Appl Phys. 2007;102:123101. [Google Scholar]
- Heymann JAW, Hayles M, Gestmann I, Giannuzzi LA, Lich B, Subramaniam S. Site-specific 3D imaging of cells and tissues with a dual beam microscope. Journal of Structural Biology. 2006;155:63–73. doi: 10.1016/j.jsb.2006.03.006. [DOI] [PMC free article] [PubMed] [Google Scholar]
- Heymann JAW, Shi D, Kim S, Bliss D, Milne JLS, Subramaniam S. 3D Imaging of mammalian cells with ion-abrasion scanning electron microscopy. Journal of Structural Biology. 2009;166:1–7. doi: 10.1016/j.jsb.2008.11.005. [DOI] [PMC free article] [PubMed] [Google Scholar]
- Hood DC, Cideciyan AV, Roman AJ, Jacobson SG. Enhanced S-cone-syndrome - evidence for an abnormally large number of S-cones. Vision Res. 1995;35:1473–1481. doi: 10.1016/0042-6989(95)98727-q. [DOI] [PubMed] [Google Scholar]
- Jacobson SG, Marmor MF, Kemp CM, Knighton RW. Sws (blue) cone hypersensitivity in a newly identified retinal degeneration. Investigative Ophthalmology & Visual Science. 1990;31:827–838. [PubMed] [Google Scholar]
- Jacobson SG, Roman AJ, Roman MI, Gass JDM, Parker JA. Relatively enhanced S-cone function in the Goldmann-Favre syndrome. Am J Ophthalmol. 1991;111:446–453. doi: 10.1016/s0002-9394(14)72379-7. [DOI] [PubMed] [Google Scholar]
- Kamino T, Yaguchi T, Ohnishi T, Ishitani T, Osumi M. Application of a FIB-STEM system for 3D observation of a resin-embedded yeast cell. Journal of Electron Microscopy. 2004;53:563–566. doi: 10.1093/jmicro/dfh063. [DOI] [PubMed] [Google Scholar]
- Kidd GJ, Avishai A, Yin X, Trapp BD. Three-Dimensional Analysis of Optic Nerve Axons Using a Focused Ion Beam-Based Approach. Microscopy Today. 2010;18:18–22. [Google Scholar]
- Kietzmann GE. Effects of Air Drying and Critical-Point Drying on Morphology of Trichomonas-Gallinae. T Am Microsc Soc. 1991;110:172–177. [Google Scholar]
- Knott G, Marchman H, Wall D, Lich B. Serial section scanning electron microscopy of adult brain tissue using focused ion beam milling. Journal of Neuroscience. 2008;28:2959–2964. doi: 10.1523/JNEUROSCI.3189-07.2008. [DOI] [PMC free article] [PubMed] [Google Scholar]
- Leser V, Drobne D, Pipan Z, Milani M, Tatti F. Comparison of different preparation methods of biological samples for FIB milling and SEM investigation. J Microsc-Oxford. 2009;233:309–319. doi: 10.1111/j.1365-2818.2009.03121.x. [DOI] [PubMed] [Google Scholar]
- Liang Y, Fotiadis D, Filipek S, Saperstein DA, Palczewski K, Engel A. Organization of the G protein-coupled receptors rhodopsin and opsin in native membranes. Journal of Biological Chemistry. 2003;278:21655–21662. doi: 10.1074/jbc.M302536200. [DOI] [PMC free article] [PubMed] [Google Scholar]
- Liang Y, Fotiadis D, Maeda T, Maeda A, Modzelewska A, Filipek S, Saperstein DA, Engel A, Palczewski K. Rhodopsin signaling and organization in heterozygote rhodopsin knockout mice. Journal of Biological Chemistry. 2004;279:48189–48196. doi: 10.1074/jbc.M408362200. [DOI] [PMC free article] [PubMed] [Google Scholar]
- Livet J, Weissman TA, Kang HN, Draft RW, Lu J, Bennis RA, Sanes JR, Lichtman JW. Transgenic strategies for combinatorial expression of fluorescent proteins in the nervous system. Nature. 2007;450:56–62. doi: 10.1038/nature06293. [DOI] [PubMed] [Google Scholar]
- Luo DG, Xue T, Yau KW. How vision begins: An odyssey. Proc Natl Acad Sci U S A. 2008;105:9855–9862. doi: 10.1073/pnas.0708405105. [DOI] [PMC free article] [PubMed] [Google Scholar]
- Mears AJ, Kondo M, Swain PK, Takada Y, Bush RA, Saunders TL, Sieving PA, Swaroop A. Nrl is required for rod photoreceptor development. Nature Genetics. 2001;29:447–452. doi: 10.1038/ng774. [DOI] [PubMed] [Google Scholar]
- Milam AH, Rose L, Cideciyan AV, Barakat MR, Tang WX, Gupta N, Aleman TS, Wright AF, Stone EM, Sheffield VC, Jacobson SG. The nuclear receptor NR2E3 plays a role in human retinal photoreceptor differentiation and degeneration. Proc Natl Acad Sci U S A. 2002;99:473–478. doi: 10.1073/pnas.022533099. [DOI] [PMC free article] [PubMed] [Google Scholar]
- Moghadama SH, Dinarvand R, Cartilier LH. The focused ion beam technique: A useful tool for pharmaceutical characterization. International Journal of Pharmaceutics. 2006;321:50–55. doi: 10.1016/j.ijpharm.2006.05.006. [DOI] [PubMed] [Google Scholar]
- Mustafi D, Engel AH, Palczewski K. Structure of cone photoreceptors. Prog Retin Eye Res. 2009;28:289–302. doi: 10.1016/j.preteyeres.2009.05.003. [DOI] [PMC free article] [PubMed] [Google Scholar]
- Nickell S, Park PSH, Baumeister W, Palczewski K. Three-dimensional architecture of murine rod outer segments determined by cryoelectron tomography. J Cell Biol. 2007;177:917–925. doi: 10.1083/jcb.200612010. [DOI] [PMC free article] [PubMed] [Google Scholar]
- Reyntjens S, Puers R. A review of focused ion beam applications in microsystem technology. J Micromech Microeng. 2001;11:287–300. [Google Scholar]
- Rodieck RW. The first steps in seeing. Sunderland, Mass: Sinauer Associates; 1998. [Google Scholar]
- Rosenkra J. On the fine structure of the frog's rod outer segments, observed by the freeze-etching technique. Cell and Tissue Research. 1970;111:228–262. doi: 10.1007/BF00339787. [DOI] [PubMed] [Google Scholar]
- Sugiyama M, Sigesato G. A review of focused ion beam technology and its applications in transmission electron microscopy. Journal of Electron Microscopy. 2004;53:527–536. doi: 10.1093/jmicro/dfh071. [DOI] [PubMed] [Google Scholar]
- Urban KW. Studying atomic structures by aberration-corrected transmission electron microscopy. Science. 2008;321:506–510. doi: 10.1126/science.1152800. [DOI] [PubMed] [Google Scholar]
- Walker JF, Moore DF, Whitney JT. Focused ion beam processing for microscale fabrication. Microelectronic Engineering. 1996;30:517–522. [Google Scholar]
- Young RJ. Micromachining using a focused ion-beam. Vacuum. 1993;44:353–356. [Google Scholar]
- Young RJ, Dingle T, Robinson K, Pugh PJA. An application of scanned focused ion-beam milling to studies on the internal morphology of small arthropods. J Microsc-Oxford. 1993;172:81–88. [Google Scholar]
Associated Data
This section collects any data citations, data availability statements, or supplementary materials included in this article.
Supplementary Materials
Data collection and reconstruction of rod photoreceptors. The first view shows data collected during a SIA-SEM experiment in the left panel, whereas subsequent reconstructions of those same sections in Reconstruct are shown in the right panel. Three rods stacked next to each other are traced and then three that stack behind those three begin to appear and are traced. The final view is a three-dimensional reconstruction of 9 rod cells, stacked 3by3, to reveal how tightly these cells pack in the retina.


