

Abstract
A mass spectrometric method was developed to elucidate the N-glycan structures of serum glycoproteins and utilize fucosylated glycans as potential markers for pancreatic cancer. This assay was applied to haptoglobin in human serum where N-glycans derived from the serum of 16 pancreatic cancer patients were compared with those from 15 individuals with benign conditions (5 normals, 5 chronic pancreatitis, and 5 type II diabetes). This assay used only 10uL of serum where haptoglobin was extracted using a monoclonal antibody and quantitative permethylation was performed on desialylated N-glycans followed by MALDI-QIT-TOF MS analysis. Eight desialylated N-glycan structures of haptoglobin were identified where a bifucosylated tri-antennary structure was reported for the first time in pancreatic cancer samples. Both core and antennary fucosylation were elevated in pancreatic cancer samples compared to samples from benign conditions. Fucosylation degree indices were calculated and show a significant difference between pancreatic cancer patients of all stages and the benign conditions analyzed. This study demonstrates that a serum assay based on haptoglobin fucosylation patterns using mass spectrometric analysis may serve as a novel method for the diagnosis of pancreatic cancer.
1. Introduction
Pancreatic cancer is the fourth leading cause of cancer deaths in the United States with the worst prognosis among all cancers. One of the causes of poor prognosis is the lack of a reliable early-detection method of the disease. Currently, the most widely used serum-based marker is CA 19-9 whose diagnostic value is limited because of a high false positive rate, further it does not allow early detection and can not readily discriminate between chronic pancreatitis and pancreatic cancer.1, 2 Thus, there is an urgent need for reliable noninvasive methods for early detection of pancreatic cancer.
Unique protein glycosylation patterns have recently been explored as a potential target for cancer biomarker detection. Distinctive serum glycomic patterns have been reported to be associated with various types of cancers and other malignancies.3–7 Unlike proteins which have genetic templates that determine the structures, glycans have greater variability which is determined by both genetic polymorphisms and the physiological environment of the cells.8 The microheterogeneity of glycans depends on activities of glycosidases and glycosyltransferases which are influenced by the physiological and pathological states of cells.9 In general, changes of branching, and alternation of levels of sialylation and fucosylation are the most common tumor-associated glycan aberrations.9, 10 The most common types of fucosylation in human serum glycoproteins are core fucosylation where fucoses attach to the core N-acetylglucosamine (GlcNAc) via α 1–6 linkage and antennary fucosylation where fucoses attach to terminal GlcNAc via α 1–3 or α 1–4 linkage. Fucosylation is controlled by fucosyltransferases capable of different types of linkages where it has been reported that the activity of fucosyltransferases are related to cancer progression.11–13 The potential clinical utility of fucosylation changes as a cancer marker has been explored.14, 15
Acute phase proteins (APP) secreted by the liver are attractive potential markers because they display changes in both protein levels and glycosylation modification in response to inflammation and diseases including cancer.16 Haptoglobin is one of the APPs which binds to liver hemoglobin and plays an important role in defense response to inflammation and infection.17 There has been increasing evidence that the glycosylation status of haptoglobin is associated with various cancers such as prostate cancer, ovarian cancer, liver cancer, and colon cancer.18–22 In particular, the elevation of haptoglobin fucosylation in pancreatic cancer using various methods such as lectin blot, lectin-antibody microarray and lectin-antibody ELISA has been shown.23–25 The structures of 2-aminopyridine-labeled N-glycans were elucidated with MALDI-TOF MS and NP-HPLC analysis.24, 26 Site-specific glycan analysis was also performed with LC-ESI-MS, revealing that fucosylated glycans are markedly increased at N211.26 However, in their study, mass spectrometric analysis of haptoglobin glycans was performed in a qualitative instead of quantitative manner and was not performed on every individual sample.
In the current study, we have examined the unique fucosylation patterns of haptoglobin in serum samples obtained from patients with pancreatic cancer, chronic pancreatitis, type II diabetes, and normal controls using a mass spectrometry based approach. A method has been developed to assay fucosylation using an antibody to extract the protein from serum followed by deglycosylation, desialylation and extraction of the N-glycan units. The N-glycans were then permethylated to increase the sensitivity of the assay. The MALDI-QIT MS was then used to study the fucosylation pattern of the glycans in MS and MS/MS modes for all stages of cancer versus chronic pancreatitis, type II diabetes and normal controls. We found that there were distinct changes in the level of both core and antennary fucosylation associated with all stages of cancer compared to the noncancerous samples. An index comparing the changes in fucosylated glycans has been developed and the results over a limited analytical test set show the potential of using haptoglobin fucosylation changes as a marker of disease state for pancreatic cancer.
2. Experimental Section
2.1 Serum samples
Human normal serum (n=5, 3 females and 2 males, median age 59), chronic pancreatitis serum (n=5, 3 females and 2 males, median age 59), type II diabetes serum(n=5, 4 females and 1 male, median age 58) and pancreatic cancer serum(n=16, 1 stage IA, 3 stage IIA, 4 stage IIB, 4 stage III, and 4 stage IV, 7 females and 9 males, median age 69) were provided by the University Hospital, Ann Arbor, Michigan and the University of Pittsburgh according to IRB approval.
The samples were aliquoted and stored in a −80°C freezer until further use. All samples were frozen and thawed only once except for the freeze-thaw study. In the freeze-thaw study, serum from a pancreatic cancer IIB patient was aliquoted into three fractions, frozen in a −80°C freezer, and then thawed at room temperature. The freeze-thaw cycles were repeated for once, twice and four times, respectively.
2.2 Separation of haptoglobin from serum
10uL of human serum was thawed and diluted to 250uL using coupling buffer (10mM sodium phosphate, 150mM sodium chloride, pH7.2) in Cross-link IP kit (Pierce Scientific, Rockford, IL). IgG is the most abundant glycoprotein in serum with a concentration of 8–16 mg/mL and may interfere with protein A/G based immunoprecipitation. Hence, IgG was depleted prior to haptoglobin capture using Protein A/G agarose beads (Pierce Scientific, Rockford, IL). In this procedure, 100uL bead slurry was incubated with diluted serum samples at 4 °C for 3 hours in a 900uL spin column on an end-to-end rotator. The depleted serum dilution was spun down in a centrifuge at 1000×g for 1 minute. The beads were washed once with 100uL coupling buffer.
Immunoprecipitation was performed using the Cross-link IP kit according to the supplier protocol. Briefly, 10ug monoclonal haptoglobin antibody (Abcam, Cambridge, MA) was bound to 20uL protein A/G plus agarose slurry at room temperature for 30 minutes, and cross-linked with the beads by 1×disuccinmidyl suberate (DSS) crosslinker at room temperature for 30 minutes. Unbound antibody that was not cross-linked was removed by extensive washing with coupling buffer and elution buffer (100mM Glycine-HCl, pH 2.8) respectively. The antibody-conjugated beads were then incubated with IgG depleted serum at 4 °C overnight and elution was carried out with 60uL elution buffer. The eluted haptoglobin was dried down in a SpeedVac concentrator (Labconco, Kansas city, MO) at room temperature, redissolved in 10uL water, and desalted by 75uL Zeba desalting spin columns (Pierce Scientific, Rockford, IL) according to the protocol supplied.
Fast on-plate digestion and mass spectrometric analysis were performed for identification of haptoglobin. 0.5uL desalted haptoglobin was spotted on a MALDI plate, and dried in air. 0.4ug (1uL) trypsin (Promega, Madison, WI) was added to 10uL 100mM ammonium bicarbonate solution with 20% acetonitrile. 0.5uL trypsin solution was deposited on top of the haptoglobin spot and the plate was placed in a covered humid chamber at 37 °C for 10 minutes. 10mg/mL 2,5-dihydroxybenzoic acid (DHB) (Laser Biolabs, France) was prepared in 50% acetonitrile and added on top of the dried spot. Mass spectrometric analysis was carried out using an Axima MALDI quadrupole ion trap-TOF instrument (Shimadzu Biotech, Manchester, UK). Ionization was performed with a pulsed N2 laser (337nm) at 5HZ where two laser shots generated one profile. Helium was used to cool the trapped ions and Argon was used for CID fragmentation. MALDI spectra were recorded only in positive ion mode. The TOF detector was calibrated with 1nmol/uL peptide mixtures of Angiotensin II (m/z 1046.54), Angiotensin I (m/z 1296.68), Substance P (m/z 1347.74), Bombesin (m/z 1619.82), ACTH 1–17 (m/z 2093.09), and ACTH 18–39 (m/z 2465.20). The mass accuracy with calibration was 50ppm. The peptide peaks were searched in the Mascot database with methionine oxidation as the variable modification.
SDS-PAGE followed by silver staining was used to evaluate the yield of haptoglobin. 1/4 of the haptoglobin eluant was boiled for 3 minutes and separated by 4–20% precast gel (Bio-Rad, Hercules, CA) in a MINI-PROTEAN cell (Bio-Rad, Hercules, CA) at 120V supplied by Power Pac3000 (Bio-Rad, Hercules, CA). 5uL of the Kaleidoscope protein marker (Bio-Rad, Hercules, CA) was used. Silver staining was performed according to the protocol provided by the manufacturer.
2.3 Deglycosylation and desialylation of haptoglobin
The denaturing solution (0.2% SDS, 100mM 2-mercaptoethanol) was added to 10uL haptoglobin solution to make the final denature solution concentration 10%. The mixture was incubated in a 60 °C oven for 30 minutes. Ammonium bicarbonate solution was then added to make a final concentration of 15mM. 1U of N-glycosidase F (PNGase F) (New England Biolabs, Ipswich, MA) was added. Deglycosylation was performed at 37°C for 18 hours. PNGase F was deactivated by boiling for 5 minutes and the protein-glycan mixture was dried down in a SpeedVac and reconstituted in 30uL 20mM ammonium acetate solution. 40mU neuraminidase from Clostridium perfrigens (Sigma Aldrich, St. Louis, MO) was added. Desialylation was performed at 37 °C for 20 hours.
2.4 Extraction of desialylated glycans
Desialylated glycans and the protein mixture was dried in a SpeedVac and redissolved in 10uL water (with 0.1% TFA). 10uL porous graphitized carbon tips (PGC tips) (Sigma Aldrich, St. Louis, MO) were used to separate glycans from proteins and other impurities. The tip was activated by 50% acetonitrile (with 0.1% TFA) and equilibrated by water (with 0.1% TFA). The samples were then loaded and the tips were washed with water (with 0.1% TFA) to remove non-specific binding. 10uL 10% acetonitrile (with 0.1% TFA) and 10uL 25% acetonitrile (with 0.1% TFA) were used for glycan elution where the two elutions were combined and dried with the SpeedVac.
2.5 Permethylation of glycans
Permethylation was performed according to the procedure of Kang in the literature.27 3mg grounded sodium hydroxide powder was added to the glycans, and mixed with 20uL DMSO, 3.8uL methyl iodide and 0.2uL water at room temperature for 10 minutes. 24uL water and 24uL chloroform were added, and the chloroform phase was washed with 24uL water for 5 times. The water phase was discarded and the permethylated glycans were dried and redissolved in 2uL 20% acetonitrile for mass spectrometric analysis.
2.6 MALDI-QIT-TOF instrument
0.5uL of permethylated glycans were spotted on a MALDI plate and allowed to dry in air. 0.5uL of sodiated DHB (10mg/mL DHB in 50% acetonitrile with 100mM sodium chloride) was added on top. The parameters of the MALDI-QIT-TOF were the same as previously described. Glycomod tool (http://www.expasy.org/tools/glycomod) was utilized to predict the glycan composition. Only glycan structures included in GlycoSuite database (http://glycosuitedb.expasy.org/glycosuite/glycodb) were selected. The glycan compositions were further confirmed by MS/MS analysis. All glycans were sodiated and analyzed in positive ion mode in this study.
2.7 Data evaluation
The MALDI MS data were acquired and processed in Launch-pad software (Karatos, Manchester, UK). The m/z values and intensities were exported as ASCII files and plotted in SigmaPlot (San Jose, CA) and peak intensities were scaled with the highest peak as 100%. Glycan peak area integration was performed with Matlab (Natick, MA). The peak area of each glycan was the addition of both permethylated glycan peak and the most abundant underpermethylated glycan peak detected 14 Da lower than the fully permethylated peak. For data visualization, a column scatter plot of the calculated fucosylation index was generated with Prism (La Jolla, CA).
3. Results and Discussion
In our work, we sought to develop a mass spectrometric assay to identify and evaluate haptoglobin fucosylation patterns to discriminate pancreatic cancer samples from benign pancreatic diseases and normal controls. The work flow of this study is outlined in Figure 1. Briefly, haptoglobin was immunoprecipitated from IgG depleted human serum. On-plate digestion followed by MALDI-QIT MS peptide analysis was used to verify the success of immunoprecipitation. The haptoglobin yield was evaluated by SDS-PAGE analysis and silver staining. The haptoglobin was then deglycosylated and desialylated and the glycans were purified using the PGC tips and permethylated. Permethylated glycans were subject to mass spectrometric analysis for structural elucidation. Analysis of fucosylation degrees was performed by Matlab and visualized with Prism.
Figure 1.

Strategy used to characterize N-glycan structures of haptoglobin and study fucosylation differences between pancreatic cancer and other benign pancreatic diseases/normal controls.
3.1 Purification of haptoglobin from human serum
Prior to immunoprecipitation with antibody-conjugated protein A/G agarose, depletion of IgG is required where IgG will bind to unoccupied protein A/G and coelute with the target protein, interfering with subsequent glycomic analysis. Haptoglobin is one of the plasma acute-phase proteins produced in liver with a molecular weight around 45 kDa. It is a tetramer composed of α-1, α-2 and two β chains. Haptoglobin has four potential N-glycosylation sites at N184, N207, N211 and N241 which are all located in the β chain. In this study, haptoglobin was purified from the sera of 5 normal volunteers, 5 chronic pancreatitis patients, 5 type II diabetes patients, and 16 pancreatic cancer patients (1 Stage IA, 3 Stage IIA, 4 Stage IIB, 4 Stage III, and 4 Stage IV). 10-minute on-plate digestion and MALDI-QIT analysis were performed to confirm the identity and purity of haptoglobin. The mass spectrum as shown in Figure 2a was searched in the Mascot database and returned human haptoglobin as the only significant protein with 13 matched peptides. SDS-PAGE followed by silver staining was used to visualize the yield of haptoglobin (Figure 2b). 1/4 of the eluent from immunoprecipitation was used for silver-staining analysis. Haptoglobin β chain (~42 kDa), α-2 chain (~18 kDa) and α-1 chain (~13 kDa) were all observed. As shown in Figure 2b, there was no contamination from other proteins in the eluted haptoglobin, and the total yield of haptoglobin β chain was estimated to be around 1–2ug per 10uL serum. The yield of immunoprecipitation was limited by the starting volume of serum and amount and efficiency of haptoglobin antibody. In this method, 1ug of protein is sufficient for subsequent glycan analysis.
Figure 2.


Purification of haptoglobin from 10uL of human serum. (a) Tryptic peptide profile of haptoglobin resulted from 10-min on-plate digestion followed by MALDI-QIT-TOF MS analysis. 1/20 of an individual immunoprecipitation elution was used. (b) Patterns of haptoglobin α-1, α-2 and β chain. 1/4 of an individual immunoprecipitation elution was subjected to 4–20% SDS-PAGE, and bands were visualized by silver staining.
3.2 N-glycan profiles of haptoglobin with and without desialylation reveal elevated fucosylation in pancreatic cancer
After purification of haptoglobin glycans, in-solution permethylation was performed. Permethylation stabilizes the relatively labile sialic acids and fucoses, and significantly improves the sensitivity and signal-over-noise ratio of glycans (comparison not shown), so that 10uL of serum aliquot and 1~2 ug of haptoglobin suffice for the identification of glycan structures.
Glycan structures of haptoglobin were first analyzed without desialylation. N-glycans were extracted from two 10uL pooled serum samples of 5 normal controls and 5 pancreatic cancers respectively. The representative spectra are shown in Figure 3a. All glycans observed from haptoglobin are complex-type. The major glycans are nonfucosylated mono- and disialylated bi-antennary structures for both normal controls and pancreatic cancer patients. Minor peaks corresponding to tri-antennary nonfucosylated glycans with one, two and three sialic acids are also observed in both samples. The abundances of two bi-antennary fucosylated glycans and one tri-antennary fucosylated glycan with three sialic acids (m/z 2605.21, m/z 2966.50 and m/z 3776.89 respectively) are elevated in pancreatic cancer. More strikingly, tri-antennary fucosylated glycans with one and two sialic acids (m/z 3052.39 and m/z 3415.73) only appear in pancreatic cancer but not in normal samples. However, tetra-antennary glycans and bifucosylated glycans with molecular weight higher than 3800Da were not detected due to low abundances.
Figure 3.


(a) MALDI-QIT-TOF MS spectra of haptoglobin glycans from pooled serum of normal controls (upper panel) and pancreatic cancer patients (lower panel). Glycans were released by PNGase F, purified with PGC tips and permethylated. (b) MALDI-QIT-TOF spectrum of desialylated haptoglobin glycans from serum of a normal control (upper panel) and a stage IV pancreatic cancer patient (lower panel). Glycans were released by PNGase F, desialylated with neuraminidase, purified with PGC tips and permethylated. Each glycan has a minor peak 14Da ahead of it due to under-permethylation. Composition of each glycan is confirmed with both MS/MS analysis and knowledge of biosynthesis pathway. (red triangle-Fuc, blue square-GlcNAc, green circle-Man, yellow circle-Gal, purple diamond-NeuAc)
Since preliminary studies indicated that the fucosylation level is different between pancreatic cancer and normal controls, we cleaved the sialic acids from the glycans in order to: (1) merge glycans with sialic acid contents as the only difference into one peak so that sensitivity would be improved; and (2) eliminate the complicated heterogeneity of sialic acids so that the glycan spectrum and subsequent analysis would be simplified. However, it should be noted that glycan sialylation information which may serve as a potential cancer biomarker is lost with this approach. A typical desialylated N-glycan profile of human haptoglobin from a normal control and a pancreatic cancer patient is shown in Figure 3b. The nonfucosylated bi-antennary complex type glycan (m/z 2070.10) was the most abundant structure as previously discussed. Eight glycan structures in total were identified as listed in table 1. Compared with the results without desialylation (Figure 3a), the tri-antennary bifucosylated glycan (glycan 5) and three additional tetra-antennary glycans (glycan 6–8) were identified as shown in Figure 3b.
Table 1.
Eight desialylated N-glycans identified in human serum
| Peak NO. | m/z | structure |
|---|---|---|
| 1 | 2070.10 |
|
| 2 | 2244.20 |
|
| 3 | 2519.36 |

|
| 4 | 2693.45 |
|
| 5 | 2867.46 |
|
| 6 | 2968.53 |

|
| 7 | 3142.59 |

|
| 8 | 3316.60 |

|
We examined each glycan peak for structures which were increased or decreased in pancreatic cancer compared to healthy controls, type II diabetes patients and chronic pancreatitis patients. A zoom-in peak comparison illustrates that the fucosylated tri-antennary and tetra-antennary structures resulted in the best performance in discriminating pancreatic cancer from non-cancers. A representative zoom-in comparison of tri-antennary and tetra-antennary structures of normal control, type II diabetes, chronic pancreatitis and pancreatic cancer is shown in Figure 4. Both the fucosylated tri-antennary (m/z 2693.45) and tetra-antennary (m/z 3142.59) glycans were elevated in pancreatic cancer. The most striking finding was that bifucosylated tri-antennary (m/z 2867.46) and tetra-antenary (m/z 3316.60) glycans were present in 12 of 16 pancreatic cancer samples but never in non-cancerous samples. These two glycans may serve as possible markers for pancreatic cancer. The bifucosylated tetra-antennary glycan was reported to be unique at site N211 in pancreatic cancer in a site-specific study of haptoglobin by ESI-MS method. 26 However, the tri-antennary glycan of human haptoglobin (m/z 2867.46) with both core and antennary fucosylation has not been reported previously with either the NP-HPLC or MALDI-TOF MS analysis16, 24 or ESI-MS approach for glycopeptide analysis26. Our method detects this structure probably because desialylation reduces heterogeneity of glycans and improves sensitivity.
Figure 4.

Zoom-in MALDI-QIT-TOF mass spectra showing fucosylation difference in tri-antennary and tetra-antennary N-glycans of haptoglobin from serum of pancreatic cancer, normal control, chronic pancreatitis and type II diabetes.
3.3 Fucosylation degree indices
In order to quantify the degree of fucosylation, Imre and coworkers developed a fucosylation index for α-1-acid glycoprotein N-glycans to discriminate between healthy, lymphoma and ovarian tumors.28 The fucosylation index gives the average number of fucose units for a group of oligosaccharides. It is defined as:
Where glycanF1 denotes the sum of abundances of singly-fucosylated glycans, glycanF2 denotes that of bifucosylated glycans, and Σglycans denotes the sum of abundances of all glycans. In our study, we used this index to characterize the fucosylation level of tri-antennary and tetra-antennary glycans because they illustrated the greatest differences between pancreatic cancer and non-cancer in mass spectra depiction as discussed above. Hence the local fucosylation degree in our study is:
The abundance of each glycan was normalized by the sum of all glycan abundances. The overall fucosylation degree ranges from 0.06 to 0.95 for all samples. Non-cancer groups (normal, chronic pancreatitis and type II diabetes) have low fucosylation degree (mean is 0.27, 0.18 and 0.30 respectively), but fucosylation degrees are elevated in early stage pancreatic cancer (stage IIA and prior) with a mean of 0.40, and this index increases significantly for later stages (mean is 0.68, 0.63 and 0.64 for IIB, III and IV respectively). Fucosylation degree is generally lower in other pancreatic diseases such as chronic pancreatitis and in type II diabetes. A general comparison of fucosylation degrees between non-cancer and pancreatic cancer is shown in Figure 5. A student’s t-test was also performed, indicating statistically significant differences between pancreatic cancer and non-cancer with a low p-value of 1.9×10⁻⁷. If the cutoff value is set at 0.40, the sensitivity of the test is 94% while the specificity is 100% for this limited sample set. The result is that none of the benign samples was misidentified, however, one of the stage IIA cancer samples was below the index limit, as shown in Table 3 which summarizes numbers of correct classification with this fucosylation degree index. A high false positive rate is currently a major issue in diagnosis with the markers CA19-9 and CEA. With the use of haptoglobin fucosylation as a potential diagnostic marker, an individual with high fucosylation degree is likely to suffer from pancreatic cancer while pancreatic cancer is unlikely for an individual with low fucosylation degree.
Figure 5.
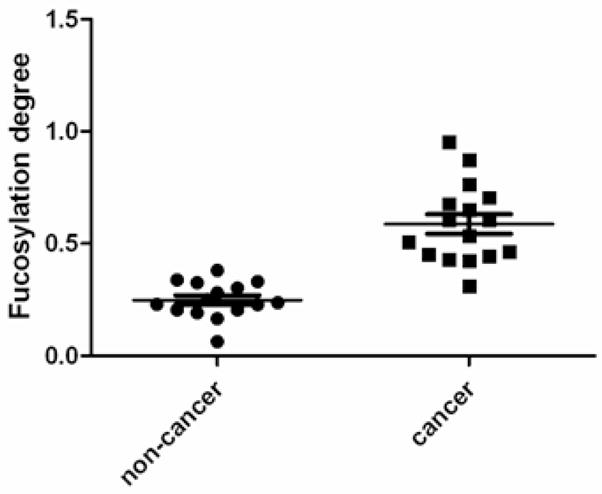
Scatter plot of fucosylation degrees of haptoglobin N-glycans of pancreatic cancer patients and non-cancer samples. Fucosylation degrees are elevated in pancreatic cancer. P-value of pair-wise t-test is 1.9×10⁻⁷.
Table 3.
(a) Reproducibility test of the assay for four aliquots of one normal serum sample processed following the workflow in Figure 1, (b) Influence of freeze/thaw cycles evaluated for three aliquots of one pancreatic cancer serum sample frozen/thawed once, twice and four times, and processed independently
| Table 3a | |||||
|---|---|---|---|---|---|
| Aliquot1 | Aliquot2 | Aliquot3 | Aliquot4 | RSD | |
| Fucosylation degree | 0.3311 | 0.2876 | 0.2988 | 0.2949 | 6.3% |
| Table 3b | ||||
|---|---|---|---|---|
| Aliquot1 | Aliquot2 | Aliquot3 | RSD | |
| Fucosylation degree | 0.7641 | 0.7240 | 0.6964 | 4.7% |
3.4 Reproducibility study and influence of freeze/thaw cycles
In order to utilize glycan structures as biomarkers for cancers and other malignancies, it is essential to develop a method for comprehensive, informative and quantitative glycan profile mapping (GPM). High-throughput methods such as lectin assay and antibody assay are able to quantify specific types of glycosylation patterns, but they are of low specificity for glycan epitopes, and detailed structural information is missing. HPLC or HPLC-ESI-MS methods provide both quantitative measurement and structural elucidation of glycans, but these existing approaches are time-consuming and do not have the potential for utilization in a high-throughput assay. MALDI (matrix-assisted laser desorption-ionization) MS has the attributes of simplicity in application and accuracy in composition assignment of glycans.29 Moreover, application of permethylation procedure minimizes ion suppression by enabling glycans to have equivalent hydrophobic properties, thus quantitative power is enhanced. Permethylation also improves the reproducibility and sensitivity of glycan analysis,30 and the spin-column based permethylation makes it more attractive in high-throughput analysis27. According to a comparative study conducted by HUPO HGPI (Human Proteome Organization Human Disease Glycomics/Proteome Initiative) participated in by 20 research groups, MALDI-TOF MS analysis of permethylated glycans yields equivalent performance as the HPLC method with reductive amination.31 In this study, MALDI-TOF MS analysis of permethylated glycans was claimed to be highly repeatable and reproducible.
In order to evaluate the analytical reproducibility of our method and especially the repeatability of the fucosylation degree index, we processed four aliquots of a normal control sample as described in the experimental section, and calculated the fucosylation degree of each aliquot as listed in Table 3a. The relative standard deviation (RSD) is only 6.3% for these four replicates, indicating high analytical reproducibility of this assay. Intra-assay variability has several possible sources: (1) losses or degradation of glycans during deglycosylation, desialylation or glycan purification; (2) peeling reactions at high pH during permethylation; (3) sample loss during liquid-liquid extraction in permethylation; (4) glycans were unevenly distributed on the MALDI plate due to uneven crystal formation of matrix. Although the reproducibility is excellent, special attention should be paid to sample handling to improve the stability of analysis.
In order to determine how repetitive freeze-thaw effects glycan stability, we performed one, two and four freeze-thaw cycles on three aliquots of the same serum sample from a pancreatic cancer Stage IIB patient. On the protein level, we did not identify any significant differences in the on-plate tryptic digestion spectrum. There were no missing peptides and there was no significant change in relative intensities of the peptides (data not shown). On the glycan level all 8 glycans were identified. Fucosylation degrees of three aliquots as displayed in Table 3b are consistent for the three aliquots, and the RSD is 4.6%. Our study indicates that freeze-thaw cycles did not exert significant modifications at either the peptide level or glycan level, up to four freeze-thaw cycles analyzed.
3.5 MS/MS study confirms glycan composition and location of fucosylation
While accurate masses can provide the oligosaccharide composition such as numbers of Hex (hexose), HexNAc (N-acetylhexosamine) and Fuc (fucose), MS2 was performed to confirm oligosaccharide composition. At low energy CID, the predominant fragments are y- ions resulting from the cleavage of labile GlcNAc-Hex glycosidic bond, thus the oligosaccharide composition can be inferred from mass differences of fragment ions.32 Permethylation also allows one to obtain branching information of a glycan because only unoccupied hydroxyl groups can be permethylated.30 Fucosylation occurs during maturation of N-glycans and fucoses are usually attached to the N-glycan innermost core GlcNAc via α 1–6 linkage, or to subterminal GlcNAc via α 1–3 or α 1–4 linkage. While the fragmentation from CID could not provide detailed linkage information, one is able to discriminate between core fucosylation and antennary fucosylation based on diagnostic ions.
The CID spectrum of the newly identified bifucosylated tri-antennary glycan (m/z 2867.46) is shown in Figure 6a, demonstrating that it is a tri-antennary structure with both core and antennary fucosylation. The trimannosyl core fragment ion at m/z 852.24 carries the information that three antenna are originally attached.30 The fragment ion at m/z 2404.05 is the product after loss of one non-reducing terminal Gal-GlcNAc. From the fact that the ion at m/z 2404.05 is able to lose another non-reducing terminal Gal-GlcNAc, producing an ion at m/z 1940.79 with high intensity, we know that for the majority of the glycans, one of the two fucoses must be attached to the core GlcNAc. Core fucosylation is also confirmed by the presence of a fragment ion at m/z 1303.46 corresponding to a fucosylated pentasaccharide core structure. A peak at m/z 1489.49 resulting from loss of core Fuc-GlcNAc unambiguously indicates antennary fucosylation. We cannot rule out the possibility that a minority of the glycan structures have both fucoses at the antenna as reported in Sarrats’ work16 since there is a minor peak at m/z 2590.03 corresponding to loss of core GlcNAc only from the parent ion.
Figure 6.


MALDI-QIT-TOF MS/MS spectra of glycans at m/z 2867.46 (a), m/z 2244.20 (b), and m/z 3142.59 (c). Potential structures of fragment ions are labeled. Fragment ions at m/z 1303.46, 1489.49 and 1940.79 (a) indicate both core and antennary fucosylation for glycan at m/z 2867.65. Fragment ions at 1317.40 and 1329.41 (b) imply core fucosylation for glycan at m/z 2244.20. Fragment ion at m/z 1939.08 (c) confirms antennary fucosylation for glycan at m/z 3142.59.
Similarly, we could conclude that glycan 2 (m/z 2244.20) as in Figure 6b is core fucosylated because of a diagnostic fragment at 1317.40 which corresponds to a fucosylated pentasaccharide core. This conclusion is also supported by an ion at 1329.40 resulting from loss of core Fuc-GlcNAc. Likewise, glycan 7 (m/z 3142.59) in Figure 6c is antennary fucosylated. A diagnostic peak at m/z 1939.08 is the cleavage product of peak at 2216.25 after loss of core GlcNAc, revealing that there is no core fucose attached originally. The glycan is only able to sequentially lose three antennary Gal-GlcNAc, resulting in fragments at m/z 2679.38, 2216.25 and 1753.14. The loss of the fourth antennary Gal-GlcNAc (theoretical m/z at 1290.01) is not observed, revealing that the fucose is located at this fourth antennary GlcNAc. Thus, MS/MS analysis reveals that both core fucosylation and antennary fucosylation are present in the elevated haptoglobin fucosylation in pancreatic cancer.
Conclusion
In our study, a highly-sensitive analytical strategy is developed to elucidate N-glycan structures and evaluate fucosylation for target proteins in human cancer serum. A volume of 10uL human serum is sufficient for total analysis. This strategy consists of five steps: immunoprecipitation of target protein, deglycosylation and desialylation, purification of glycans, permethylation, and mass spectrometric analysis for structure elucidation of glycans. Glycans of haptoglobin from pancreatic cancer serum, control disease states, and normal controls were used to evaluate this method. Compared with the lectin miroarray method, the mass spectrometric method on permethylated glycans yields more abundant structural information and has improved reproducibility. However, the large numbers of glycans discovered and great overlap of glycans between cancer and non-cancer makes subsequent data analysis challenging. In our work, preliminary studies revealed fucosylated N-glycans as the indicative pancreatic cancer biomarker, hence desialylation was performed to simplify the glycan profile without losing fucosylation information. Due to the high sensitivity nature of our method, a tri-antennary complex type glycan with both core and antennary fucosylation was identified for the first time in haptoglobin in pancreatic cancer. This glycan as well as another bifucosylated tetra-antennary glycan are unique in pancreatic cancer, and do not appear in normal controls, chronic pancreatitis or type II diabetes. Besides, singly-fucosylated tri-antennary and tetra-antennary glycans were also found to be increased in pancreatic cancer.
Fucosylation degree index which measures the degree of fucosylation and hence activity of fucosyltransferase was utilized to provide a numerical depiction of haptoglobin glycomic differences between pancreatic cancer and other pancreas chronic diseases/normal controls. The predictive power of fucosylation degree index was evaluated with a sensitivity of 94% and a specificity of 100%. Elevation of haptoglobin fucosylation is present in all stages of pancreatic cancer including the early stage, revealing the potential of early detection, though this result has to be verified in a larger sample cohort. Because pancreatic cancer is a relatively rare disease, this method is most likely to be applied to high risk cohorts such as those with a genetic predisposition or those identified through risk stratification modeling. In the future, we plan to carry out this assay in an easily used and high-throughput format for larger sample size screening. Agarose bead-based immunoprecipitation can be performed in a 96-well filter plate. Sample incubation, purification with porous graphitized carbon resin and derivatization can also be carried out in a 96-well filter plate platform in analogy to what is described in previous work.33
Table 2.
Summary of sample disease states and number of correct classifications with fucosylation degree index
| Disease states | Number of samples | Number of correct classifications |
|---|---|---|
| Normal | 5 | 5 |
| Chronic pancreatitis | 5 | 5 |
| Type II diabetes | 5 | 5 |
| Cancer stage IIA and prior | 4 | 3 |
| Cancer stage IIB | 4 | 4 |
| Cancer stage III | 4 | 4 |
| Cancer stage IV | 4 | 4 |
Acknowledgments
We acknowledge support of this work from the National Cancer Institute under grant 1 R01 CA154455 01 (DML) and the SPORE program grant 1 P50CA130810 (DML, DMS, MTR) and from the National Institutes of Health under grant R01 GM49500 (DML) and grant K23 DK082097 (MAA).
We would also like to thank Dr. Chen Li and Dr. Jianhui Zhu for technical assistance during the course of this work.
References
- 1.Li DH, Xie KP, Wolff R, Abbruzzese JL. Pancreatic cancer. Lancet. 2004;363(9414):1049–1057. doi: 10.1016/S0140-6736(04)15841-8. [DOI] [PubMed] [Google Scholar]
- 2.Rosty C, Goggins M. Early detection of pancreatic carcinoma. Hematol Oncol Clin N. 2002;16(1):37–52. doi: 10.1016/s0889-8588(01)00007-7. [DOI] [PubMed] [Google Scholar]
- 3.Hammoud ZT, Mechref Y, Hussein A, Bekesova S, Zhang M, Kesler KA, Novotny MV. Comparative glycomic profiling in esophageal adenocarcinoma. J Thorac Cardiovasc Surg. 2010;139(5):1216–1223. doi: 10.1016/j.jtcvs.2009.12.045. [DOI] [PubMed] [Google Scholar]
- 4.Kirmiz C, Li BS, An HJ, Clowers BH, Chew HK, Lam KS, Ferrige A, Alecio R, Borowsky AD, Sulaimon S, Lebrilla CB, Miyamoto S. A serum glycomics approach to breast cancer biomarkers. Mol Cell Proteomics. 2007;6(1):43–55. doi: 10.1074/mcp.M600171-MCP200. [DOI] [PubMed] [Google Scholar]
- 5.Zhao J, Qiu WL, Simeone DM, Lubman DM. N-linked glycosylation profiling of pancreatic cancer serum using capillary liquid phase separation coupled with mass spectrometric analysis. J Proteome Res. 2007;6(3):1126–1138. doi: 10.1021/pr0604458. [DOI] [PubMed] [Google Scholar]
- 6.Yang ZP, Harris LE, Palmer-Toy DE, Hancock WS. Multilectin affinity chromatography for characterization of multiple glycoprotein biomarker candidates in serum from breast cancer patients. Clin Chem. 2006;52(10):1897–1905. doi: 10.1373/clinchem.2005.065862. [DOI] [PubMed] [Google Scholar]
- 7.Meany DL, Zhang Z, Sokoll LJ, Zhang H, Chan DW. Glycoproteomics for Prostate Cancer Detection: Changes in Serum PSA Glycosylation Patterns. J Proteome Res. 2009;8(2):613–619. doi: 10.1021/pr8007539. [DOI] [PMC free article] [PubMed] [Google Scholar]
- 8.Dube DH, Bertozzi CR. Glycans in cancer and inflammation. Potential for therapeutics and diagnostics. Nat Rev Drug Discov. 2005;4(6):477–488. doi: 10.1038/nrd1751. [DOI] [PubMed] [Google Scholar]
- 9.Pucic M, Pinto S, Novokmet M, Knezevic A, Gornik O, Polasek O, Vlahovicek K, Wang W, Rudd PM, Wright AF, Campbell H, Rudan I, Lauc G. Common aberrations from the normal human plasma N-glycan profile. Glycobiology. 2010;20(8):970–975. doi: 10.1093/glycob/cwq052. [DOI] [PubMed] [Google Scholar]
- 10.An HJ, Kronewitter SR, de Leoz MLA, Lebrilla CB. Glycomics and disease markers. Curr Opin Chem Biol. 2009;13(5–6):601–607. doi: 10.1016/j.cbpa.2009.08.015. [DOI] [PMC free article] [PubMed] [Google Scholar]
- 11.Mas E, Pasqualini E, Caillol N, El Battari A, Crotte C, Lombardo D, Sadoulet MO. Fucosyltransferase activities in human pancreatic tissue: comparative study between cancer tissues and established tumoral cell lines. Glycobiology. 1998;8(6):605–613. doi: 10.1093/glycob/8.6.605. [DOI] [PubMed] [Google Scholar]
- 12.Staudacher E, Altmann F, Wilson IBH, Marz L. Fucose in N-glycans: from plant to man. BBA-Gen Subjects. 1999;1473(1):216–236. doi: 10.1016/s0304-4165(99)00181-6. [DOI] [PubMed] [Google Scholar]
- 13.Ogawa J, Inoue H, Koide S. Expression of alpha-1,3-fucosyltransferase type IV and VII genes is related to poor prognosis in lung cancer. Cancer Res. 1996;56(2):325–329. [PubMed] [Google Scholar]
- 14.Sterling RK, Jeffers L, Gordon F, Sherman M, Venook AP, Reddy KR, Satomura S, Schwartz ME. Clinical utility of AFP-L3% measurement in North American patients with HCV-related cirrhosis. Am J Gastroenterol. 2007;102(10):2196–2205. doi: 10.1111/j.1572-0241.2007.01405.x. [DOI] [PubMed] [Google Scholar]
- 15.Xiong L, Regnier FE. Use of a lectin affinity selector in the search for unusual glycosylation in proteomics. J Chromatogr B. 2002;782(1–2):405–418. doi: 10.1016/s1570-0232(02)00671-2. [DOI] [PubMed] [Google Scholar]
- 16.Sarrats A, Saldova R, Pla E, Fort E, Harvey DJ, Struwe WB, de Llorens R, Rudd PM, Peracaula R. Glycosylation of liver acute-phase proteins in pancreatic cancer and chronic pancreatitis. Proteom Clin Appl. 2010;4(4):432–448. doi: 10.1002/prca.200900150. [DOI] [PubMed] [Google Scholar]
- 17.Dobryszycka W. Biological functions of haptoglobin - New pieces to an old puzzle. Eur J Clin Chem Clin Biochem. 1997;35(9):647–654. [PubMed] [Google Scholar]
- 18.Ang IL, Poon TCW, Lai PBS, Chan ATC, Ngai SM, Hui AY, Johnson PJ, Sung JJY. Study of serum haptoglobin and its glycoforms in the diagnosis of hepatocellular carcinoma: A glycoproteomic approach. J Proteome Res. 2006;5(10):2691–2700. doi: 10.1021/pr060109r. [DOI] [PubMed] [Google Scholar]
- 19.Fujimura T, Shinohara Y, Tissot B, Pang PC, Kurogochi M, Saito S, Arai Y, Sadilek M, Murayama K, Dell A, Nishimura ST, Hakomori SI. Glycosylation status of haptoglobin in sera of patients with prostate cancer vs. benign prostate disease or normal subjects. Int J Cancer. 2008;122(1):39–49. doi: 10.1002/ijc.22958. [DOI] [PubMed] [Google Scholar]
- 20.Park SY, Yoon SJ, Jeong YT, Kim JM, Kim JY, Bernert B, Ullman T, Itzkowitz SH, Kim JH, Hakomori SI. N-glycosylation status of beta-haptoglobin in sera of patients with colon cancer, chronic inflammatory diseases and normal subjects. Int J Cancer. 2010;126(1):142–155. doi: 10.1002/ijc.24685. [DOI] [PubMed] [Google Scholar]
- 21.Thompson S, Dargan E, Turner GA. Increased fucosylation and other carbohydrate changes in haptoglobin in ovarian cancer. Cancer Lett. 1992;66(1):43–48. doi: 10.1016/0304-3835(92)90278-4. [DOI] [PubMed] [Google Scholar]
- 22.Yoon SJ, Park SY, Pang PC, Gallagher J, Gottesman JE, Dell A, Kim JH, Hakomori SI. N-glycosylation status of beta-haptoglobin in sera of patients with prostate cancer vs. benign prostate diseases. Int J Oncol. 2010;36(1):193–203. [PubMed] [Google Scholar]
- 23.Zhao J, Patwa TH, Qiu WL, Shedden K, Hinderer R, Misek DE, Anderson MA, Simeone DM, Lubman DM. Glycoprotein microarrays with multi-lectin detection: Unique lectin binding patterns as a tool for classifying normal, chronic pancreatitis and pancreatic cancer sera. J Proteome Res. 2007;6(5):1864–1874. doi: 10.1021/pr070062p. [DOI] [PubMed] [Google Scholar]
- 24.Okuyama N, Ide Y, Nakano M, Nakagawa T, Yamanaka K, Moriwaki K, Murata K, Ohigashi H, Yokoyama S, Eguchi H, Ishikawa O, Ito T, Kato M, Kasahara A, Kawano S, Gu JG, Miyoshi E. Fucosylated haptoglobin is a novel marker for pancreatic cancer: A detailed analysis of the oligosaccharide structure and a possible mechanism for fucosylation. Int J Cancer. 2006;118(11):2803–2808. doi: 10.1002/ijc.21728. [DOI] [PubMed] [Google Scholar]
- 25.Matsumoto H, Shinzaki S, Narisada M, Kawamoto S, Kuwamoto K, Moriwaki K, Kanke F, Satomura S, Kumada T, Miyoshi E. Clinical application of a lectin-antibody ELISA to measure fucosylated haptoglobin in sera of patients with pancreatic cancer. Clin Chem Lab Med. 2010;48(4):505–512. doi: 10.1515/CCLM.2010.095. [DOI] [PubMed] [Google Scholar]
- 26.Nakano M, Nakagawa T, Ito T, Kitada T, Hijioka T, Kasahara A, Tajiri M, Wada Y, Taniguchi N, Miyoshi E. Site-specific analysis of N-glycans on haptoglobin in sera of patients with pancreatic cancer: A novel approach for the development of tumor markers. Int J Cancer. 2008;122(10):2301–2309. doi: 10.1002/ijc.23364. [DOI] [PubMed] [Google Scholar]
- 27.Kang P, Mechref Y, Klouckova I, Novotny MV. Solid-phase permethylation of glycans for mass spectrometric analysis. Rapid Commun Mass Spectrom. 2005;19(23):3421–3428. doi: 10.1002/rcm.2210. [DOI] [PMC free article] [PubMed] [Google Scholar]
- 28.Imre T, Kremmer T, Heberger K, Molnar-Szollosi E, Ludanyi K, Pocsfalvi G, Malorni A, Drahos L, Vekey K. Mass spectrometric and linear discriminant analysis of N-glycans of human serum alpha-1-acid glycoprotein in cancer patients and healthy individuals. J Proteomics. 2008;71(2):186–197. doi: 10.1016/j.jprot.2008.04.005. [DOI] [PubMed] [Google Scholar]
- 29.Harvey DJ. Matrix-assisted laser desorption/ionization mass spectrometry of carbohydrates. Mass Spectrom Rev. 1999;18(6):349–450. doi: 10.1002/(SICI)1098-2787(1999)18:6<349::AID-MAS1>3.0.CO;2-H. [DOI] [PubMed] [Google Scholar]
- 30.Yu SY, Wu SW, Khoo KH. Distinctive characteristics of MALDI-Q/TOF and TOF/TOF tandem mass spectrometry for sequencing of permethylated complex type N-glycans. Glycoconjugate J. 2006;23(5–6):355–369. doi: 10.1007/s10719-006-8492-3. [DOI] [PubMed] [Google Scholar]
- 31.Wada Y, Azadi P, Costello CE, Dell A, Dwek RA, Geyer H, Geyer R, Kakehi K, Karlsson NG, Kato K, Kawasaki N, Khoo KH, Kim S, Kondo A, Lattova E, Mechref Y, Miyoshi E, Nakamura K, Narimatsu H, Novotny MV, Packer NH, Perreault H, Peter-Katalinic J, Pohlentz G, Reinhold VN, Rudd PM, Suzuki A, Taniguchi N. Comparison of the methods for profiling glycoprotein glycans - HUPO Human Disease Glycomics/Proteome Initiative multi-institutional study. Glycobiology. 2007;17(4):411–422. doi: 10.1093/glycob/cwl086. [DOI] [PubMed] [Google Scholar]
- 32.Harvey DJ, Martin RL, Jackson KA, Sutton CW. Fragmentation of N-linked glycans with a matrix-assisted laser desorption/ionization ion trap time-of-flight mass spectrometer. Rapid Commun Mass Spectrom. 2004;18(24):2997–3007. doi: 10.1002/rcm.1709. [DOI] [PubMed] [Google Scholar]
- 33.Kim YG, Jeong HJ, Jang KS, Yang YH, Song YS, Chung JH, Kim BG. Rapid and high-throughput analysis of N-glycans from ovarian cancer serum using a 96-well plate platform. Anal Biochem. 2009;391(2):151–153. doi: 10.1016/j.ab.2009.05.015. [DOI] [PubMed] [Google Scholar]