

Non-technical summary
The amygdala plays a key role in the formation and storage of memories associated with emotions. Recently, so-called intercalated clusters of GABAergic neurons in the amygdala have been shown to play an important role in emotional regulation attracting broad interest. We report here novel information on the largest of the intercalated cluster called the main intercalated nucleus of amygdala. Specifically, we study the anatomy, physiology, connectivity and responses to the neuromodulator dopamine of the neurons with the soma in this nucleus. Our results imply that the main intercalated nucleus of the mouse amygdala can participate in the emotional processing.
Abstract
Abstract
Intercalated cells (ITCs) of the amygdala are clusters of GABAergic cells that surround the basolateral complex of the amygdala (BLA). Growing evidence suggests that ITCs are required for the expression of fear extinction. The main intercalated nucleus (Im) is the largest of the ITC clusters and could also be important for emotional processing. We used whole-cell recordings from Im neurons in acute slices of mouse amygdala. We found that these neurons were medium-sized spiny projection cells. Their passive and active membrane responses were consistent with those previously reported in other ITC clusters. The axon of Im neurons was, in many cases, cut at the slice boundaries, suggesting long-range projections. Axonal branches could be detected in several amygdala nuclei where they made functional synapses. We also functionally studied Im cell inputs. Excitatory postsynaptic currents (eEPSCs) were evoked by the stimulation of the Im, intermediate capsula (IC), external capsula (EC) or BLA, when GABAergic transmission was pharmacologically blocked. An occlusion test indicated that fibres recruited by stimulating Im and IC, or Im and EC were distinct. These eEPSCs had both NMDA and AMPA receptor components. Inhibitory postsynaptic currents (eIPSCs) were evoked after the stimulation of the Im, the EC and the BLA, when glutamatergic transmission was pharmacologically blocked. Furthermore, dopamine reversibly hyperpolarised, and decreased the firing frequency and the input resistance of Im cells via dopamine type 1 receptor. Our data suggest that the Im is functionally connected to other amygdala nuclei and is under neuromodulatory influence. We propose that the Im serves as key neuronal substrate of fear extinction.
Introduction
In the amygdala, inhibitory circuits control the acquisition, expression and extinction of conditioned fear (reviewed in LeDoux, 2000; Ehrlich et al. 2009; Pape & Pare, 2010). GABAergic cells are found in all the nuclei of rodent amygdala including the basolateral complex (BLA) and intercalated cell (ITC) clusters (McDonald & Augustine, 1993; Pare & Smith, 1993a; Ehrlich et al. 2009). The latter contain the highest density of GABAergic cells in the amygdala, and are organised in clusters surrounding the BLA that are well preserved in mammals (Millhouse, 1986; Nitecka & Ben-Ari, 1987; Pare & Smith, 1993a,b; Alheid et al. 1994; Pitkanen & Amaral, 1994; Royer et al. 1999; Marowsky et al. 2005). The ITC clusters can be further divided into the medial and lateral intercalated cell cluster and main intercalated nucleus (mITC, lITC and Im, respectively), based on their different locations. The Im nucleus, the biggest cluster among ITCs, is located ventro-medially to the BLA (Millhouse, 1986; Pare & Smith, 1994).
Recently, the ITC clusters have been shown to play a crucial role in emotional regulation and attracted strong and widespread interest. Key observations are: (1) selected lesions of mITCs result in a marked deficit in the expression of fear extinction (Likhtik et al. 2008); (2) excitability of mITCs is enhanced after fear extinction (Amano et al. 2010); (3) mITCs and lITCs are directly inhibited by dopamine (DA) (Marowsky et al. 2005), providing a cellular substrate for the DA-induced disinhibition of the amygdala at the systemic level (Rosenkranz & Grace, 1999); (4) the anxiolytic-like effect of neuropeptide S is mediated by enhanced synaptic excitation of mITCs but not of other cell types of amygdala (Jungling et al. 2008).
Recent studies have reported some functional diversity within and between ITC clusters. Neurons of the mITC cluster are synaptically coupled with variable synaptic strengths dependent on the frequency of presynaptic cell firing and this functional diversity is correlated to peculiar dendritic and axonal patterns of different cell pairs (Geracitano et al. 2007). Three types of mITCs have been recognised based on their axonal projections, and one of them innervates the Im nucleus, forming functional GABAergic synapses (Busti et al. 2011). Moreover, different activation amongst ITC clusters has been detected in rodents displaying an impairment of fear extinction (Hefner et al. 2008).
A significant progress in understanding the cellular organization of amygdala would be to clarify the physiological role of Im, which is currently unknown in spite of the high number of cells contained in this nucleus. Recent data show that the activation of Im neurons is stronger after extinction and extinction retrieval (Busti et al. 2011), suggesting a specific role of this nucleus in emotional processing. We report here electrophysiological responses, axo-dendritic patterns and synaptic inputs–outputs of Im neurons in order to further clarify their role in the fear-learning-related amygdala circuits.
Methods
Acute slice preparation
All procedures involving animals were performed according to methods approved by the UK Home Office and The Animals (Scientific Procedures) Act 1986. The authors have read, and the experiments comply with, the policies and regulations of The Journal of Physiology (Drummond, 2009). Acute coronal slices were prepared from C57BLn mice (postnatal day 16–25; Charles River, Margate, UK). Animals (n = 98) were decapitated under deep isoflurane anaesthesia (4% in O2), and their brains were rapidly removed and placed in ice-cold sucrose artificial cerebrospinal fluid (ACSF) cutting solution (containing (in mm): 75 sucrose, 87 NaCl, 25 NaHCO3, 2.5 KCl, 1.25 NaH2PO4, 0.5 CaCl2, 7 MgCl2, 25 glucose, saturated with 95% O2–5% CO2, at pH 7.3–7.4). Slices (350 μm) containing amygdala (at approx. −0.9 mm Bregma level) were cut (Leica VT 1000S, Leica Microsystems GmbH, Nussloch, Germany) and transferred to a nylon mesh where they were maintained in a chamber initially containing sucrose ACSF cutting solution at 37°C for 30 min. During this period the cutting solution was replaced with normal ACSF (containing (in mm): 130 NaCl, 24 NaHCO3, 3.5 KCl, 1.25 NaH2PO4, 2.5 CaCl2, 1.5 MgSO4, 10 glucose saturated with 95% O2–5% CO2, at pH 7.3). Slices were then maintained at room temperature (20–22°C).
Electrophysiology and analysis
Acute slices were secured under a nylon mesh, submerged and superfused with ACSF in a 2 ml chamber mounted on the stage of an upright microscope (Axioskop, Zeiss, Jena, Germany). Slices were visualized with a 10×/0.3 NA or 40×/0.8 NA water-immersion objective (Zeiss, Oberkochen, Germany) coupled with infrared and differential interference contrast (DIC) optics linked to a video camera (Newvicon C2400, Hamamatsu, Hamamatsu City, Japan). Initially only cells with subsequent anatomical confirmation of their position (see below) were used for further analysis. However, in a minority of experiments the position of Im was identified online with infrared and DIC optics without further anatomical confirmation of the position of the recorded neuron within Im boundaries. Somatic whole-cell patch-clamp recordings (33–35°C) were made from visually identified cells using borosilicate glass capillaries (GC120F, 1.2 mm o.d., Clarke Electromedical Instruments, Reading, UK), pulled on a DMZ puller (Zeitz-instrumente GmbH, Munich, Germany) and filled with a filtered intracellular solution consisting of (in mm): 126 potassium gluconate, 4 KCl, 4 ATP-Mg, 0.3 GTP-Na2, 10 Na2-phosphocreatine, 10 Hepes and 0.5% w/v biocytin (all from Sigma-Aldrich Co. Ltd, Poole, UK), osmolarity 270–280 mosmol l−1 without biocytin, pH 7.3 with KOH. A caesium-based intracellular solution was used to isolate AMPA and NMDA receptor-mediated excitatory postsynaptic currents (AMPA-, NMDA-EPSCs) consisting of (in mm): 126 caesium methansulfonate, 4 CsCl, 10 Hepes, 10 Na2-phosphocreatine, 4 Mg-ATP, 0.3 Na-GTP and 0.5% w/v biocytin (all from Sigma-Aldrich), osmolarity 270–280 mosmol l−1 without biocytin, pH 7.3 with CsOH. Biocytin was added to allow post hoc visualization of the recorded neurons. Resistance of the patch pipettes was 5–6 MΩ, and recordings were accepted only if the initial seal resistance was greater than 1 GΩ. The series resistance (Rs) was compensated online by 60–70% in voltage-clamp mode to reduce voltage errors, and cells were only accepted for analysis if the initial Rs was less than or equal to 25 MΩ (range, 14–25 MΩ) and did not change by more than 20% throughout the recording period. Throughout the text and figures, membrane potentials for all whole-cell recordings have been corrected for an experimentally determined liquid junction potential of −12 mV for recordings with the potassium gluconate intracellular solution.
All electrophysiological signals were amplified (10 mV pA−1, EPC9/2 amplifier HEKA Electronik, Lambrecht, Germany; Pulse software), low-pass filtered at 2.9 kHz and digitized at 5 or 10 kHz. The amplifier was controlled from a personal computer running the Pulse data acquisition and analysis programme (HEKA). Currents/voltages were acquired online with Pulse software and analysed offline with Pulsefit (HEKA) and IGOR Pro5.05 (Wavemetrics Inc., OR, USA). The input resistance (Rin) was calculated from the slope of a line fitted to the subthreshold range on a plot of the injected current versus the steady-state membrane voltage when a family of hyperpolarising and depolarising current injections were applied (range, −30 to +120 pA). The apparent membrane time constant (τ) was calculated by fitting a single exponential to the response of the cell to a current injection of −50 pA in current-clamp mode. Membrane capacitance was calculated as τ/Rin. To study the kinetics of action potentials, a depolarising current step (3 ms, 100–150 pA) was applied. Action potential half-width, peak amplitude and membrane afterhyperpolarization (AHP) were measured from the initial point of the action potential raising phase by a user-defined program in IGOR. The sag ratio was calculated from the membrane potential at the end of a 1 s hyperpolarising pulse divided by the largest membrane potential change observed in response to a current step (range, −80 to –120 pA). The adaptation index was calculated as the ratio between the first and last interspike intervals evoked by a 1 s depolarising current pulse. The maximal (max.) firing rate was the number of action potentials elicited by a strong depolarising current pulse (range, 250–500 pA). Steps of depolarising current were injected into cells (200 ms, range, 50–100 pA) to evaluate the action of DA and DA receptor antagonists on Im neurons. The values of the resting membrane potential and number of action potentials were measured from the averaged last 10 trials of control and bath application of the drugs.
Extracellular stimulation was conducted by applying rectangular pulses of current (0.1 ms, range, 5–50 μA) delivered through an isolation unit (A360 Stimulus Isolator, World Precision Instruments, Stevenage, UK) to a monopolar patch pipette filled with ACSF. The stimulating electrode was placed in different sites of the amygdala to evoke inhibitory postsynaptic currents (eIPSCs) or excitatory postsynaptic currents (eEPSCs). Extracellular stimulation experiments were conducted in the presence of kynurenic acid (3 mm) or bicuculline metachloride (5 μm) during recordings of eIPSCs or eEPSCs, to block AMPA/kainate/NMDA or GABAA receptors, respectively. To determine the lowest intensity at which eIPSCs/eEPSCs could be detected, an input–output protocol was performed (range, 5–150 μA, step of 5–10 μA). The PSC kinetics analysis was performed on synaptic responses evoked by lowest possible stimulus intensities resulting in a detectable response. No response was judged by the absence of any detectable current in single sweeps following (2–100 ms) the stimulus artefact. The values of peak amplitude, latency, 20–80% rise time, decay time and area of events were measured from the average of three consecutive sweeps. The values of synaptic latency jitter were calculated from the standard deviation of the synaptic latency of 10 consecutive eEPSCs. The event peak amplitude was visually delimited and then measured using Pulsefit. The paired-pulse ratio was calculated as the mean peak amplitude of the response to the second stimulus divided by the mean peak amplitude of the response to the first stimulus, measured from the average of 10 consecutive sweeps. The latency of events was determined as the time between the onset of stimulation artefact and the onset of the postsynaptic response. The 20–80% rise time, decay time (fitted with a single exponential), jitter and area of the synaptic currents were analysed with a user-defined program in IGOR.
In the occlusion test, stimulating electrodes were placed within Im and IC or EC. The actual and predicted sums of values of peak amplitude eEPSCs elicited by two stimuli after independent and simultaneous stimulation were compared. If the latency of two events were different we corrected the onset of stimulation online in a way that the two stimulus artefacts appeared simultaneously. The values of peak amplitude of events recorded during the occlusion test were measured from 10 trials average.
To isolate AMPA- and NMDA-EPSCs we placed the stimulating electrode in Im (stimulating intensity range, 5–50 μA) and recorded in voltage-clamp mode at a holding potential (VH) range of −70 to +40 mV. AMPA-EPSCs were recorded in the presence of bicuculline (30 μm) and NMDA-EPSCs in the presence of 2,3-dihydroxy-6-nitro-7-sulfamoyl-benzo[f]quinoxaline-2,3-dione (NBQX; 50 μm) and bicuculline (30 μm). The peak amplitude of the eEPSCs was measured using Pulsefit from the average of three sweeps for each VH. The reversal potential was calculated from the slope of a line fitted to a plot of values of VHversus the peak amplitude of recorded currents.
Histological processing of recorded cells
Immediately after electrophysiological recordings, slices were immersed overnight at 4°C in fixative composed of 4% paraformaldehyde, 15% (v/v) saturated picric acid and 0.1 m phosphate buffer (PB; pH 7.2–7.4). Gelatine-embedded slices were re-sectioned into 60 μm thick sections. To confirm the location of the recorded cells in Im, we processed the sections containing biocytin-loaded cells with the horseradish peroxidase method and counterstained the tissue with Nissl staining or immunohistochemistry reaction anti-NeuN. Briefly, biocytin-filled cells were incubated in an avidin–horseradish peroxidase complex (1:100 dilution; ABC Kit, Vector Laboratories, Burlingame, CA, USA) followed by a peroxidase reaction using diaminobenzidine (DAB, Sigma-Aldrich; 0.05%) as the chromogen and H2O2 (1%) as the substrate. Nissl staining was performed by dehydrating–rehydrating the sections and immersing them into a cresyl violet acetate solution (1 g per 400 ml H2O; pH 3.6), dehydrating sections were then immersed in xylene-based mounting medium (Entellan; Merck, Damstadt, Germany) and coverslipped. Alternatively to Nissl staining, anti-NeuN immunoperoxidase was performed to visualise the amygdala nuclei boundaries. In this case, only neuronal cell nuclei and somata were stained, resulting in a more accurate determination of central nucleus (CE) subdivision boundaries (McDonald, 1982). Non-specific antibody binding was blocked by incubation in 20% normal goat serum (NGS; Vector Laboratories Ltd, UK) diluted in Tris-buffered saline (TBS; 0.9% NaCl, 0.05 m Tris, pH 7.4 containing 0.2% Triton X-100 for 45 min). Mouse monoclonal antibody anti-NeuN (1:3000, Chemicon, Millipore; MAB377) was diluted in TBS, containing 1% NGS and 0.2% Triton X-100, and applied overnight (at 4°C). The sections were subsequently washed in TBS and incubated overnight (at 4°C) in biotinylated, secondary goat anti-mouse IgG (diluted 1:200, Chemicon, Millipore, MA, USA), diluted in TBS, containing 1% NGS and 0.2% Triton X-100. The sections were washed in PB and processed for peroxidase-based visualisation of the amygdala nuclei boundaries and mounted on slides for permanent storage (see above). A Neurolucida system (MicroBrightField, Inc., Magdeburg, Germany) was used to reconstruct the neurons (100× or 63× oil immersion objective).
Statistical tests
Statistical analyses were carried out using SPSS 17.0 (SPSS, Chicago, IL, USA). All values are expressed as means ±s.e.m. Statistical comparisons were made using a Student's paired t test. For all analyses, statistical significance was set at P < 0.05 (*), P < 0.01 (**) and P < 0.001 (***). Unsupervised, hierarchical cluster analysis using Ward's method (Ward, 1963) and Euclidian distance was performed to classify subtypes among Im cells. Ward's method minimizes the error sum of squares of any pair of clusters formed at a given step; this maximizes between-group differences and minimizes within-group differences. Before clustering, each electrophysiological property was converted into standardized z-scores. This achieves a normal distribution and prevents variables with larger ranges from having a greater influence on the cluster solution than variables with small ranges. Statistical differences between three groups were estimated based on one-way ANOVA with post hoc Bonferroni test, P < 0.05.
Chemicals and drugs
All drugs were applied to the slice via the bath solution. Salts used for the patch pipette and ACSF were obtained either from VWR International (Lutterworth, UK) or Sigma-Aldrich. Drugs obtained from Tocris (Cookson Inc., Avonmouth, UK) were added at the following concentrations: (–)-bicuculline metachloride, 5 or 30 μm; NBQX, 50 μm; d-AP5, 100 μm, SR95531, 5 μm, SCH 23390 hydrochloride, 5 μm; (S)-(–)-sulpiride, 5 μm. Drugs obtained from Sigma-Aldrich were added at the following concentrations: kynurenic acid, 3 mm; DA, 30 μm.
Results
Basic electrophysiological responses of Im neurons
The position of the Im was identified online with infrared and DIC optics, and could be recognized as a cluster of densely packed cells located ventrally to the BLA nucleus (Fig. 1A). All slices used were prepared from bregma level ∼−0.9 mm (Paxinos & Franklin, 2007) (Fig. 1A, B and C). Post hoc anatomical confirmation of the location of the somata of the recorded neurons within the Im was performed in the great majority of the experiments (see Methods). Intercalated cell (ITC) clusters consist of at least two cell types, so-called medium and large ITCs (Millhouse, 1986). The majority of ITCs consist of medium ITCs (∼95%) that have round to elongated somata and a round to bipolar dendritic tree bearing dendritic spines (Millhouse, 1986; Royer et al. 1999, 2000; Marowsky et al. 2005; Geracitano et al. 2007). We first measured basic electrophysiological responses of Im cells (n = 45), (Fig. 1D, E and F, Table 1), and found that their passive membrane properties were typical of small neurons (e.g. Rin= 641 ± 20 MΩ; Cm= 30 ± 2 pF). The half-width action potential duration and amplitude was ∼0.8 ± 0.05 ms and 75.7 ± 1 mV, respectively; the firing discharge accommodated to variable extent when evoked with a 1 s depolarising current pulse. These results are consistent with previously published data on mITCs (Royer et al. 1999; Marowsky et al. 2005; Geracitano et al. 2007).
Figure 1. Location and electrophysiology of mouse Im neurons.
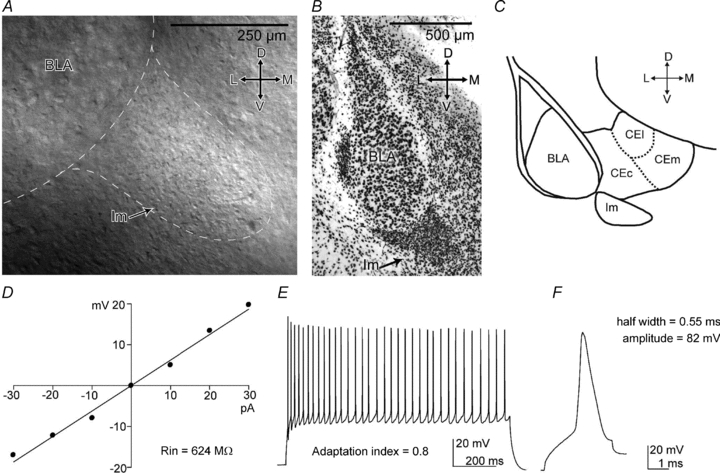
A–C, the Im nucleus can be identified as a cluster of densely packed cells, located ventro-medially to the BLA. A, identification of Im nucleus on mouse coronal slice with IR-DIC microscopy (10×/0.3 NA water-immersion objective). B, anti-NeuN staining revealing the Im. C, scheme of the amygdala depicting the position and the size of the Im at −0.9 bregma level. D–F, passive and active electrophysiological responses of a representative Im cell. D, the I–V plot used to measure the cell Rin. E, sustained firing pattern in response to a depolarising current stimulus (150 pA, 1 s). F, action potential evoked by a short depolarising current pulse (100 pA, 3 ms). Abbreviations: D, dorsal; L, lateral; M, medial; V, ventral; BLA, basolateral complex; CEc, central nucleus, capsular; CEl, central nucleus, lateral; CEm, central nucleus, medial; Im, main intercalated nucleus; Rin, input resistance.
Table 1.
Summary of passive and active membrane responses of in vitro recorded Im neurons
| Parameter | Average value ±s.e.m. | n |
|---|---|---|
| RMP (mV) | −71.2 ± 1.1 | 37 |
| Rin (MΩ) | 641 ± 20 | 43 |
| Membrane τ (ms) | 20.3 ± 0.8 | 42 |
| Cm (pF) | 30 ± 2 | 42 |
| AHP (mV) | −12.8 ± 0.6 | 45 |
| AP amplitude (mV) | 75.7 ± 1 | 45 |
| AP width (ms) | 0.8 ± 0.05 | 44 |
| Sag ratio | 0.86 ± 0.03 | 42 |
| Adaptation index | 0.6 ± 0.04 | 38 |
| Max. firing (Hz) | 37.3 ± 2 | 38 |
Abbreviations: AHP, afterhyperpolarization; AP, action potential; Cm, membrane capacitance; Max. firing, maximal firing; RMP, resting membrane potential; Rin, input resistance
Im neuron diversity based on cluster analysis
To investigate the existence of possible Im neurons subtypes, electrophysiological parameters were used in an unsupervised cluster analysis. The following parameters were analysed: resting membrane potential (RMP); input resistance (Rin); τ; AHP; action potential (AP) amplitude; AP width; sag ratio; adaptation index; and maximal firing rate. A total of 27 neurons were included in this analysis after rejecting cells lacking some of the variables (Fig. 2, Table 2). The resulting dendrogram indicated the presence of three groups of Im neurons. Comparison amongst groups shows significant differences between 7 out of 9 measured parameters (Table 2). Group III consisted of cells with the resting membrane potential much more hyperpolarized than cells of group I and II. Moreover, their Rin as well as adaptation index was higher than cells of group I and II. Cells in group II had broader AP, slower membrane time constant and smaller value of adaptation index than cells of group I and III. Group I consisted of neurons with smallest AP amplitude among the three groups. The values of AHP and sag ratio remained constant among the three groups. Although our analysis could not indicate the number of neuronal types among Im neurons, it definitely suggests potential functional diversity among Im neurons.
Figure 2. Im neuron diversity based on cluster analysis.
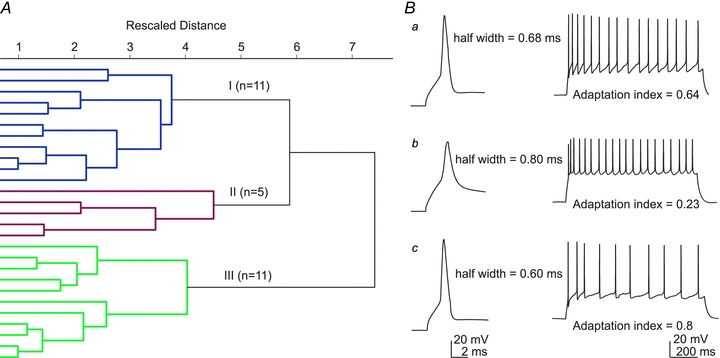
A, dendrogram illustrating the results from a hierarchical cluster analysis. Intersection of the dendrogram branches with the y-axis represents individual neurons. The x-axis is the rescaled distance (squared Euclidian) between group centroids at each branch point. Longer horizontal lines indicate greater distance. Note the existence of three groups of Im neurons: I (n = 11; blue); II (n = 5; red); III (n = 11; green). B, representative action potentials generated by Im cells of group (a), (b) or (c). Left: action potential evoked by a short depolarizing current pulse (100 pA, 3 ms); right: firing pattern evoked by a long depolarizing current pulse (150 pA, 1 s). All cells shown had a resting membrane potential of −77 mV.
Table 2.
Summary of intrinsic membrane responses of in vitro recorded Im neurons belonging to group I, II and III based on cluster analysis
| Parameter | Group I (n = 11) | Group II (n = 5) | Group III (n = 11) |
|---|---|---|---|
| RMP (mV) | −68.2 ± 1.5 | −70.8 ± 2.5 | −77.8 ± 1.4 |
| III | III | I, II | |
| Rin (MΩ) | 562 ± 31 | 593 ± 50 | 777 ± 28 |
| III | III | I, II | |
| Membrane τ (ms) | 19.4 ± 0.9 | 25.0 ± 1.4 | 17.8 ± 1.1 |
| II | I, III | II | |
| AHP (mV) | −13.5 ± 1.0 | −12.7 ± 1.9 | −12.2 ± 0.7 |
| AP amplitude (mV) | 71.9 ± 1.7 | 82.1 ± 2.8 | 80.1 ± 1.3 |
| II, III | II | I | |
| AP width (ms) | 0.67 ± 0.04 | 1.0 ± 0.2 | 0.61 ± 0.03 |
| II | I, III | II | |
| Sag ratio | 0.86 ± 0.02 | 0.92 ± 0.01 | 0.89 ± 0.01 |
| Adaptation index | 0.59 ± 0.05 | 0.24 ± 0.08 | 0.78 ± 0.04 |
| II, III | I, III | I,II | |
| Max. firing (Hz) | 32.7 ± 1.9 III | 34.2 ± 5 | 43.3 ± 2.7 I |
All values are shown as mean ±s.e.m. Statistical differences between the three groups, estimated based on ANOVA with post hoc Bonferroni test, are indicated under the corresponding parameter, P < 0.05. Abbreviations: AHP, afterhyperpolarization; AP, action potential; Cm, membrane capacitance; Max. firing, maximal firing; RMP, resting membrane potential; Rin, input resistance.
Effect of dopamine on Im neurons
All ITC clusters receive the densest afferents from the mesencephalic dopaminergic system in the amygdala (Asan, 1998; Fuxe et al. 2003; Marowsky et al. 2005; Jacobsen et al. 2006). The neuromodulator DA elicits a characteristic inhibition of the excitability of mITCs and lITCs (Marowsky et al. 2005), in contrast to the other GABAergic cells of the amygdala tested so far that are depolarised (Rosenkranz & Grace, 1999; Bissiere et al. 2003). The action of DA on mITC and lITC clusters has been proposed to be a key cellular event underlying the DA-mediated disinhibition of the BLA and CE nuclei leading to fear-related behaviour (Marowsky et al. 2005). To test whether Im neurons could participate to this behavioural effect we superfused DA (30 μm) while injecting current pulses into recorded Im cells (range, −30 to +100 pA for 200 ms). We observed a reversible membrane hyperpolarisation (control, −75.3 ± 0.9 mV; DA, −79.9 ± 1 mV; wash, −75.1 ± 1.1 mV; P < 0.001, n = 20, Fig. 3A and B) accompanied by a decrease in the number of APs (control, 3.6 ± 0.4; DA, 2.7 ± 0.4; wash, 4.4 ± 0.6; P < 0.001, n = 20, Fig. 3A and B), and in Rin (control, 773 ± 72 MΩ; DA, 633 ± 55 MΩ; wash, 749 ± 53 MΩ; P < 0.01, n = 8, Fig. 3A and B). In a few cells, after we had observed the washout of DA effects, DA (30 μm) was re-applied either in the presence of the selective DA receptor 1 (D1R) antagonist SCH 23390 hydrochloride (5 μm) or the selective D2R antagonist sulpiride (5 μm). We found that DA did not change the resting membrane potential in the presence of the D1R antagonist (control, −75.7 ± 1.1 mV; DA, −75.3 ± 0.9 mV; P > 0.1, n = 4, Fig. 3C) but did so in the presence of the D2R antagonist (control, −72.3 ± 1.8 mV; DA, −76 ± 2 mV; P < 0.01, n = 4, Fig. 3C). These results, together with the anatomical data (see below), suggest that Im, lITC and mITC clusters share common characteristics, and that Im neurons could participate in behavioural effects of DA.
Figure 3. Hyperpolarising effect of dopamine on the Im cells.
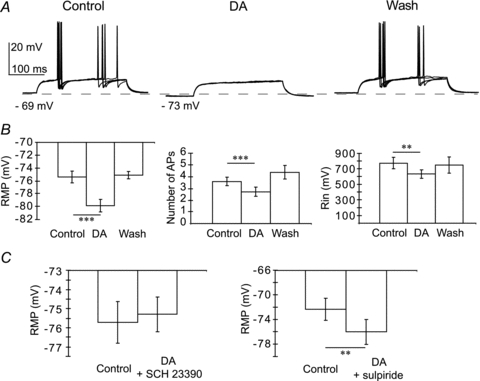
A, response of Im cell to superimposed depolarising current pulses (60 pA, 200 ms) during control, dopamine bath application (DA, 30 μm) and washout. B, average (±s.e.m.) effect of dopamine on the resting membrane potential (RMP, n = 20), number of action potentials (APs; n = 20) and input resistance (Rin; n = 8). Comparison between control and DA bath application (***P < 0.001; **P < 0.01). C, average (±s.e.m.) effect of dopamine on the resting membrane potential (RMP) in the presence of the D1R antagonist SCH 23390 hydrochloride (5 μm, P > 0.1, n = 4) or the D2R antagonist sulpiride (5 μm, **P < 0. 01, n = 4).
Synaptic output of Im cells
It is crucial to our understanding of the physiological role of Im neurons to identify their target neurons. In order to describe efferent projection of mouse Im neurons, their axonal arbors were studied. Neurons were digitally reconstructed with the Neurolucida system (n = 9), and four representative cells with the longest recovered axonal processes are shown in Fig. 4. Neurons with the soma in the Im shared common characteristics that could be described as a poorly branching dendritic tree (round to bipolar), that mostly remained confined within the boundaries of the Im, spiny dendrites and a projection axon. We invariably detected cut axons at the bottom or at the upper surface of the slice preparation, clearly suggesting that Im cells were projection neurons. In line with this, little of the axon was observed in the Im itself. Importantly, we detected the presence of axon branches in several amygdala nuclei, with striking distribution diversity between cells. Axon could be detected in all three subdivisions of the CE nucleus as well as in the BLA, medial and extended amygdala (Fig. 4A–C), as well as toward lITC (Fig. 4B) and mITC clusters (Fig. 4D).
Figure 4. Reconstruction of Im neurons.

Neurolucida system was used to reconstruct the neurons (100× oil immersion objective for cells code s030510s1 (A); s030310s1 (B); s120509s1 (D) and 63× oil immersion objective for cell code r100207 (C). Red, soma and dendrites; blue, axon; black, nuclei boundary. The inset of A illustrates the reconstruction of cell s030510s1 at lower magnification to document the presence of its long axon projecting outside the amygdala. Abbreviations: D, dorsal; L, lateral; M, medial; V, ventral; BLA, basolateral complex; CEc, central nucleus, capsular; CEl, central nucleus, lateral; CEm, central nucleus, medial; Im, main intercalated nucleus, mITC, medial intercalated cell cluster; lITC, lateral intercalated cell cluster.
To functionally confirm synaptic output of Im cells, we placed an extracellular electrode in the Im and recorded from CE and BLA cells while stimulating with increasing strength (Fig. 5). All kinetics data refer to responses evoked by lowest stimulus intensities eliciting a detectable response. The eIPSCs were recorded in the presence of kynurenic acid (3 mm) and were abolished by bath application of the GABAA receptor antagonist SR95531 (5 μm). Monosynaptic connectivity was detected when recording from the CE (2/8 cases) and BLA (2/5 cases). Representative examples of extracellular stimulation of Im as well as recording sites are shown in Fig. 5. Responses detected in the central nucleus capsular division (CEc) had peak amplitude of 21.1 and 10.8 pA; rise time of 2.6 and 2.0 ms; and decay time of 25.8 and 20.8 ms, respectively. Responses detected in the BLA nucleus had peak amplitude of 129.2 and 27.8 pA; rise time of 3.1 and 4.3 ms; and decay time of 32.1 and 23.3 ms, respectively. These data confirm that Im neurons have significant outputs in the central nucleus and BLA, in line with our anatomical observations.
Figure 5. Synaptic output of the Im.
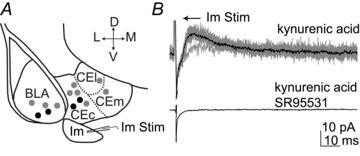
A, scheme of the amygdala depicting the location of the stimulating electrode and recording sites. Black dots represent detected eIPSCs, grey dots represent recording locations where eIPSCs could not be observed. B, representative voltage clamp recording showing eIPSCs in CE after Im stimulation (upper trace; 100 μA intensity of stimulation; in the presence of 3 mm kynurenic acid) and subsequent blockade by application of SR95531 (5 μm). Individual eIPSCs are shown in grey; the average of 10 traces is shown in black. Abbreviations: D, dorsal; L, lateral; M, medial; V, ventral; BLA, basolateral complex; CEc, central nucleus, capsular; CEl, central nucleus, lateral; CEm, central nucleus, medial; Im, main intercalated nucleus; Stim., stimulating electrode.
Inhibitory inputs to the Im
Recent data suggests that mITCs could be divided in three groups based on the presence of axon in different nuclei of amygdala (Busti et al. 2011). Interestingly, one group is represented by neurons whose axons innervate the Im. Moreover, recent data indicate that this connectivity is functional, as monosynaptic eIPSCs could be detected when stimulating the intermediate capsula (IC), where the mITCs are located (Busti et al. 2011). We aimed to determine other possible sources of synaptic inhibition to the Im and placed an extracellular electrode in the Im, BLA and external capsule where lITCs are located. We recorded from Im cells while stimulating with increasing strength (Fig. 6B and C). All kinetics data refer to responses evoked by lowest possible stimulus intensities eliciting a detectable response. The IPSCs were evoked in the presence of kynurenic acid (3 mm) and were abolished by bath application of bicuculline (5 μm; data not shown), indicating they were mediated by GABAA receptors. Summary of quantitative analysis of some aspects of the eIPSC is reported in Table 3. We always detected monosynaptic eIPSCs when placing the stimulating electrode within the Im (6/6 cases; Fig. 6). When two stimuli were applied in short succession (50 ms) an average paired-pulse ratio of 1.2 ± 0.12 was observed. Detected eIPSCs may have mixed origin coming from local Im or remote GABAergic neurons. Unfortunately, we failed to detect synaptically connected cell pairs (n = 10, data not shown), consistent with the poor axonal and dendritic arborization of these neurons within the Im. We also observed eIPSCs when stimulating the EC, where lITCs are located (2/6 cases) or the BLA (1/6 cases, Table 3), suggesting additional sources of synaptic inhibition.
Figure 6. eIPSCs recorded in the Im.

A, scheme of the amygdala depicting the location of the stimulating and recording electrodes. B, voltage clamp recording showing IPSCs evoked by Im stimulation at increasing intensities. The average of 3 traces for each intensity (range, 5–50 μA, step of 5 μA) is shown in grey. An eIPSC after 15 μA stimulation is illustrated in black. C, the input–output curve shows the relation between the intensity of stimulation used and the peak amplitude of the eIPSCs. Each point of the graph represents the average value of 3 sweeps. Note the presence of failures elicited by lower stimulation intensities. The arrow indicates response evoked by ‘minimal’ stimulation intensity. D, voltage clamp recording showing paired-pulse facilitation of IPSC evoked by Im stimulation. Individual eIPSCs are shown in grey; the average of 10 traces is shown in black. All eIPSCs were recorded in the presence of kynurenic acid (3 mm), and were mediated by GABAA receptors, since they were abolished by bicuculline (5 μm; not shown). Abbreviations: D, dorsal; L, lateral; M, medial; V, ventral; BLA, basolateral complex; CE, central nucleus; Im, main intercalated nucleus; Rec., recording electrode, Stim., stimulating electrode.
Table 3.
Summary of quantitative analysis of eIPSC elicited by the lowest intensity of stimulation able to evoke a detectable current
| Stimulation site | Success rate | elPSC peak amplitude (pA) | Stimulation intensity (μA) | Area (fC) | Rise time (ms) | Decay (ms) | Latency (ms) |
|---|---|---|---|---|---|---|---|
| Im | 6/6 | 94.9 ± 31.3 | 15 | 3.3 ± 0.6 | 0.8 ± 0.2 | 15.8 ± 1.5 | 0.8 ± 0.1 |
| BLA | 1/6 | 162.5 | 15 | 2.24 | 0.23 | 11.3 | 0.95 |
| EC | 2/6 | 48.9 ± 26.7 | 10 ± 5 | 3.3 ± 1.5 | 1.3 ± 0.8 | 12.5 ± 0.1 | 0.7 ± 0.1 |
All values are shown as mean ±s.e.m. Abbreviations: BLA, basolateral complex; EC, external capsula; Im, main intercalated nucleus.
Excitatory inputs to the Im
Next, excitatory inputs to the Im were studied by evoking excitatory postsynaptic currents (eEPSCs) in response to extracellular minimal electrical stimulation. The eEPSCs were monitored in the presence of the GABAA receptor antagonist bicuculline (5 μm), and were abolished by kynurenic acid (3 mm, data not shown), indicating that they were mediated by ionotropic glutamate receptors. The eEPSCs were always detected when stimulating within the Im (6/6 cases). When two stimuli were applied in short succession (50 ms) in the Im an average paired-pulse ratio of 1.5 ± 0.27 was observed (Fig. 7A). Furthermore, stimulation of EC or IC resulted in eEPSCs in 3/7 cases and 2/6 cases, respectively (Table 4). These results suggest that Im neurons can be controlled by cortical afferents, which make up the majority of fibres in EC and IC (LeDoux, 2000), as it is for mITC and lITC clusters (Quirk et al. 2003; Berretta et al. 2005; Marowsky et al. 2005). Some of the principal neurons of BLA have been observed, by using Golgi staining, to send axon collaterals to the Im (Millhouse, 1986). To test if these connections are functional, we placed a stimulating electrode in the BLA nucleus. We detected a functional monosynaptic connectivity when stimulating BLA in 2/7 cases. However, the amplitude of such eEPSCs was small (11.5 and 16.4 pA) and they occurred with a marked delay time from the stimulation (6.7 and 5.9 ms). Synaptic jitter of eEPSCs latency was 0.3 ± 0.12 ms, 0.27 ± 0.15 ms and 0.19 ± 0.06 ms when stimulating the Im (n = 5), IC (n = 4) or EC (n = 3), respectively, suggesting the monosynaptic nature of the responses (Doyle & Andresen, 2001). Likewise, the synaptic jitter of eEPSCs latency was 0.74 ms and 0.26 ms when the BLA was stimulated, consistent with monosynaptic excitation.
Figure 7. eEPSCs recorded in the Im – occlusion test.
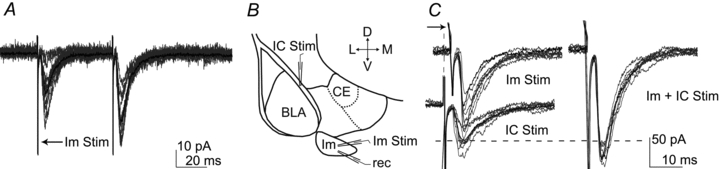
A, voltage clamp recording showing paired pulse facilitation of EPSC evoked by Im stimulation. Individual eIPSCs are shown in grey; the average of 10 traces is shown in black. B, scheme of the amygdala depicting the location of the stimulating and recording electrodes. C, evoked EPSCs recorded in the presence of bicuculline (5 μm), individual eEPSCs are shown in grey; the average of 10 traces is shown in black. Left panel: representative EPSCs evoked by the independent stimulation of Im (peak amplitude = 100.9 pA) and IC (peak amplitude = 54.7 pA). The arrow next to the top traces indicates the time shift applied online to achieve simultaneous stimulation of IC and Im. Right panel: simultaneous activation of Im and IC (peak amplitude = 172.9 pA). In this representative example, the response evoked by the paired stimuli of Im and IC was 111% of the summed individual eEPSCs. Abbreviations: D, dorsal; L, lateral; M, medial; V, ventral; BLA, basolateral complex; CE, central nucleus; IC, intermediate capsula; Im, main intercalated nucleus; Rec., recording electrode, Stim., stimulating electrode.
Table 4.
Summary of quantitative analysis of eEPSC elicited by the lowest intensity of stimulation able to evoke a detectable current
| Stimulation site | Success rate | eEPSC peak amplitude (pA) | Stimulation intensity (μA) | Area (fC) | Rise time (ms) | Decay (ms) | Latency (ms) |
|---|---|---|---|---|---|---|---|
| Im | 6/6 | 42.6 ± 14.7 | 19.2 ± 2.4 | 4.7 ± 1.3 | 2.0 ± 0.7 | 7.2 ± 1.2 | 1.36 ± 0.7 |
| BLA | 2/7 | 13.9 ± 2.5 | 42.5 ± 0.8 | 0.8 | 0.8 ± 0.1 | 10.1 ± 4.4 | 7.8 ± 1.1 |
| EC | 3/7 | 47.7 ± 27.8 | 22.5 ± 6.6 | 1.5 ± 0.3 | 1.3 ± 0.3 | 8.4 ± 1.4 | 2.9 ± 1.4 |
| IC | 2/6 | 32.2 ± 19.9 | 27.5 ± 7.5 | 27.5 ± 7.6 | 0.9 ± 0.7 | 3.6 ± 1.9 | 3.6 ± 3.2 |
All values are shown as mean ±s.e.m. Abbreviations: BLA, basolateral complex; EC, external capsula; IC, intermediate capsula; Im, main intercalated nucleus.
To determine whether responses after Im and EC or IC stimulation were mediated by a distinct set of excitatory inputs we performed an occlusion test (Popescu et al. 2007). Two stimulating electrodes were placed in IC and Im (Fig. 7B) or in EC and Im. The actual and predicted sums of eEPSCs amplitude evoked by two stimuli of independent fibres were compared (Fig. 7C). If the response elicited by paired stimuli is smaller or bigger than the algebraic sum of individual responses, it provides evidence that the activated fibres are partly common. The response evoked by the paired stimuli of Im and IC was 115 ± 8% of the summed eEPSCs (n = 5). The response evoked by the paired stimuli of Im and EC was 102 ± 12% of the summed eEPSCs (n = 5). These data suggest that electrical stimulation of Im and IC/EC recruited distinct axonal fibres.
Finally, we aimed to define the postsynaptic receptor components mediating eEPSCs observed in Im neurons. To examine the voltage dependence of eEPSCs, recordings were performed in the presence of bicuculline (30 μm) to block GABAA receptor activity by using a caesium-based intracellular patch solution to reduce outward potassium current and block GABAB receptors (Gähwiler & Brown, 1985). In all cells tested (n = 6) the stimulation of the Im resulted in eEPSCs mediated by both AMPA- and NMDA-receptors components (Fig. 8Aa). The AMPA-receptor mediated component at these synapses had a linear current–voltage (I–V) relationship and reversal potential of 3.4 mV (Fig. 8Ab). NMDA-EPSCs were isolated by blocking AMPA receptor with NBQX (50 μm) in the presence of bicuculline (30 μm; Fig. 8Ba). Application of d-AP5 (100 μm, selective NMDA receptor antagonist) in the presence of bicuculline and NBQX abolished the response, indicating that it was entirely mediated by NMDA receptors (data not shown). The NMDA receptor-mediated component at these synapses had a non-linear I–V relationship, with a region of negative slope between −50 and +10 mV and reversal potential of 8.1 mV (Fig. 8Bb).
Figure 8. AMPA/NMDA receptors mediated eEPSCs recorded in the Im.
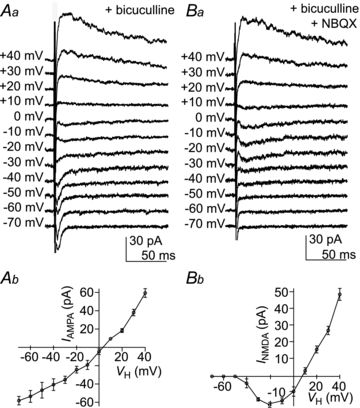
Voltage clamp recording after Im stimulation at VH ranging from −70 mV to + 40 mV. Aa, AMPA receptor-mediated synaptic currents in the presence of bicuculline (30 μm). Ab, plot of the peak amplitude of AMPA receptor-mediated eEPSCs against VH with the standard error indicated. In this representative example, the EPSCs reversal potential was 3.4 mV. Ba, NMDA receptor-mediated eEPSCs in the presence of bicuculline (30 μm) and NBQX (50 μm). Bb, plot of the peak amplitude of NMDA receptor-mediated eEPSCs against VH with the standard error indicated. In this representative example, the eEPSCs reversal potential was 8.1 mV.
Discussion
Intrinsic membrane features of Im cells
In this study new information about the Im nucleus of mouse amygdala is provided. We found that the passive membrane responses of Im cells, characterised by high input resistance and low membrane capacitance, were typical of those measured in small neurons, and similar to those previously reported in other ITCs (Royer et al. 1999; Marowsky et al. 2005; Geracitano et al. 2007). One exception was the resting membrane potential that was more depolarised in Im cells than in other ITCs. Furthermore, active membrane responses recorded from Im cells were also comparable to those recorded in other ITCs in vitro; for example, the presence of action potentials of rather low peak amplitude (∼70 mV) (Royer et al. 1999). Cluster analysis of Im electrophysiological properties indicated the presence of three groups of Im neurons that differed in 7 out of 9 parameters. We previously noticed heterogeneity amongst mITCs in terms of short-term plasticity (Geracitano et al. 2007) as well as axonal patterns (Geracitano et al. 2007) (Busti et al. 2011). We also found that DA, which is expressed by fibres innervating ITCs (Asan, 1998; Fuxe et al. 2003), reversibly inhibited Im cells via D1R, as reported in mITCs and lITCs (Marowsky et al. 2005), but not in other GABAergic cells of the BLA (Rosenkranz & Grace, 1999; Bissiere et al. 2003). Furthermore, ITCs display a similar immunoreactivity for the μ opioid receptor (Likhtik et al. 2008), the α3 GABAA receptor subunit (Marowsky et al. 2004), the D1 receptor (Fuxe et al. 2003; Jacobsen et al. 2006), and several transcription factors (Kaoru et al. 2010). Taken together, these data suggest that ITC clusters share common characteristics and probably form a distinct system from other GABAergic cells of the amygdala.
Synaptic output of Im cells
Anatomical characterization of the recorded cells indicates that Im clusters consisted of small to medium size, spiny neurons with bipolar dendritic organization and projecting axon. Since axons of Im cells were cut in the acute slice preparation they are likely to project outside the mouse amygdala, as it occurs in the cat (Pare & Smith, 1994). Axonal branches were detected in several amygdala nuclei within the slices. Axons showed variable lengths and trajectories in all subdivisions of the CE nucleus and in the BLA, and in the IC and EC where mITC and lITC clusters are located, respectively. Since our electrophysiological data suggest that functional synapses originate from these axonal branches, this indicates that Im cells inhibit the BLA and CE nuclei, and possibly mITCs and lITCs. Our findings add complexity to the view that the flow of information in the amygdala is organized in a dorso-ventral direction and that the ITC clusters serve mainly as a feedforward inhibitory gate (Pare et al. 2004; Amano et al. 2010).
Synaptic inputs of Im cells
In order to study this topic we placed an extracellular stimulation electrode in different areas of the amygdala and examined EPSCs or IPSCs evoked by minimal stimulation intensity. With this method, local neurons nearby the stimulation electrode are primarily stimulated, but it cannot exclude that other excitable process such as dendrites or axons belonging to distant neurons could also have been activated. Local stimulation always elicited robust eIPSCs in Im cells, although local connectivity may be low since we failed to detect unitary IPSCs when pairs of Im neurons were tested. This is also consistent with our observation of relatively poor dendritic and local axonal branching of Im cells within the Im. The lack of connected pairs detection may be also due to the coronal orientation of the slices used, as this made possible the identification of the Im during the recording. Changing slice orientation might increase the probability of detecting connected pairs within the Im. The relative fast kinetics of the eIPSCs recorded in the Im cells after ‘minimal stimulation’ experiments were comparable to those we previously reported for most unitary IPSCs in paired recordings of mITCs (Geracitano et al. 2007). Our results support the idea that ITC clusters are functionally connected in a predominantly dorso-ventral direction (Royer et al. 1999, 2000). Surprisingly, an eIPSC was also detected when stimulating the BLA, suggesting that interneurons of the BLA may also provide extrinsic in addition to local inhibition (Ehrlich et al. 2009) or that BLA stimulation backfired the axon of lITCs sending collaterals to the Im.
When synaptic inhibition was pharmacologically blocked, eEPSCs were always recorded after the local stimulation of the Im. Since there is no evidence that this nucleus contains glutamatergic cells, the eEPSCs are probably due to the stimulation of extrinsic glutamatergic fibres. The eEPSCs were probably monosynaptic owing to low synaptic jitter detected (Doyle & Andresen, 2001). Interestingly, the synaptic latency of the eEPSCs after the stimulation of the BLA was much longer than after the stimulation of the other nuclei of the amygdala. This could be due to slow axonal conduction velocity and/or high axonal length as well as to the passive propagation of BLA principal cell's stimulation. Where do excitatory inputs come from? Potential excitatory sources include the infralimbic cortex, the thalamus and the BLA; the latter has been shown to send axon collaterals to the Im (Millhouse, 1986). It is important to keep in mind that the Im can also be contacted by axon collaterals emitted by passing fibres en route to other structures (especially to the central and medial nuclei of amygdala) (Millhouse, 1986). Since mITCs undergoes NMDA-dependent long-term depression and potentiation (Royer & Pare, 2002), we studied the type of excitatory receptor(s) expressed by Im cells. We found that the eEPSCs resulting from Im stimulation had both a fast AMPA- and a slow NMDA-receptor component. Future studies should address the interesting possibility that Im cells display NMDA-dependent synaptic plasticity.
Furthermore, to understand how Im gates the flow of information, we investigated whether excitatory inputs onto the Im interact with each other. The results of the occlusion test were consistent with the stimulation of an independent set of inputs. Within the limitation of the approach we used, our data suggest that heterogeneous excitatory inputs impinging on Im cells may be spatially segregated along their somato-dendritic domain. Future ultrastructural studies will be needed to test this important point.
Physiological implications
Our data suggest a role for the Im in relation to other nuclei of the amygdala and therefore acquisition, expression and extinction of conditioned fear (reviewed in LeDoux, 2000; Ehrlich et al. 2009; Pape & Pare, 2010). The Im projects to the basal forebrain (Pare & Smith, 1994), which in turn projects to the entire cortical mantle. In this way the Im could indirectly affect the activity of vast cortical areas, such as switching the fear response from freezing to risk assessment and exploration (Gozzi et al. 2010). How could the Im in principle affect fear memories? One possibility is that Im neurons serve as an additional GABA release site, during emotional states that require an increased level of GABA in the amygdala microcircuit. In this respect, in vivo studies have shown that an increased level of GABA in the amygdala is a crucial feature of fear extinction (Chhatwal et al. 2005; Heldt & Ressler, 2007), and that the BLA plays a critical role in fear extinction learning (Herry & Mons, 2004; Herry et al. 2008). Principal neurons of the BLA consist of discrete cell populations, one of them being active during fear extinction (Herry et al. 2008). Principal cells of the BLA send excitatory inputs onto mITCs that in turn provide feedforward inhibition to the CE, and this path is strengthened during fear extinction (Royer et al. 1999; Amano et al. 2010). Our present findings that the Im also receives an excitatory input from the BLA and projects axonal branches to the CE indicate that the Im could be another source of feedforward inhibition to the CE. Consistent with this view, it was recently observed that extinction training and consolidation lead to the induction of an immediate early gene in the Im that persists during extinction retrieval (Busti et al. 2011). Moreover, fear extinction is dependent on NMDA receptor activity, as in vivo injection of a NMDA agonist facilitates the acquisition of fear extinction (Mao et al. 2006). We show here that Im cells displayed NMDA receptor-mediated eEPSCs. This leads to the possibility that excitatory synapses onto Im neurons could express NMDA receptor-dependent long-term potentiation and that this plasticity would contribute to fear-related memories.
Conclusions
In summary, we have shown that Im cells of the mouse amygdala have specific anatomical and functional features enabling them to actively participate in emotional processing. We suggest that the Im nucleus represents an additional site of integration of the distributed network underlying fear memories comprising the infralimbic cortex, amygdala and hippocampus (Myers & Davis, 2007; Quirk & Mueller, 2008).
Acknowledgments
This work was supported by the Medical Research Council, UK. Raffaella Geracitano was supported by Marie Curie Intra-European Fellowship within the 6th European Community Framework Programme. We acknowledge Romana Hauer, Ben Micklem and Katharine Whitworth for technical aid and expertise. We also acknowledge the contribution of Daniela Busti for the drawing of the cell r100207, and Professor Yannis Dalezios for his suggestions on the cluster analysis. We thank Thomas Bienvenu for useful discussions during the project and comments on the manuscript. We also thank Daniela Busti, Dr Thomas Ellender and Professor Francesco Ferraguti for their comments on the manuscript.
Glossary
Abbreviations
- BLA
basolateral complex
- CE
central nucleus
- CEc
central nucleus, capsular
- CEl
central nucleus, lateral
- CEm
central nucleus, medial
- DA
dopamine
- D1R
dopamine receptor 1
- D2R
dopamine receptor 2
- DAB
diaminobenzidine
- DIC
differential interference contrast
- EC
external capsule
- eEPSC
evoked EPSC
- eIPSC
evoked IPSC
- IC
intermediate capsule
- Im
main intercalated nucleus
- ITC
intercalated cell
- lITC
lateral intercalated cell
- mITC
medial intercalated cell
- NGS
normal goat serum
- PB
phosphate buffer
- RMP
resting membrane potential
- Rs
series resistance
- τ
membrane time constant
- TBS
tris buffer saline
Author contributions
M.C. planned and supervised the project; M.M., R.G. and M.C. designed and performed the experiments, analysed and interpreted the data; M.M. and M.C. drafted the article and revised it critically for important intellectual content. All authors approved the final version.
References
- Alheid GF, de Olmos JS, Beltramino CA. Amygdala and extended amygdala. In: Paxinos G, editor. The Rat Nervous System. 2nd edn. Academic Press, Inc; 1994. pp. 495–578. [Google Scholar]
- Amano T, Unal CT, Pare D. Synaptic correlates of fear extinction in the amygdala. Nat Neurosci. 2010;13:489–494. doi: 10.1038/nn.2499. [DOI] [PMC free article] [PubMed] [Google Scholar]
- Asan E. The catecholaminergic innervation of the rat amygdala. Adv Anat Embryol Cell Biol. 1998;142:1–118. doi: 10.1007/978-3-642-72085-7. [DOI] [PubMed] [Google Scholar]
- Berretta S, Pantazopoulos H, Caldera M, Pantazopoulos P, Pare D. Infralimbic cortex activation increases c-Fos expression in intercalated neurons of the amygdala. Neuroscience. 2005;132:943–953. doi: 10.1016/j.neuroscience.2005.01.020. [DOI] [PMC free article] [PubMed] [Google Scholar]
- Bissiere S, Humeau Y, Luthi A. Dopamine gates LTP induction in lateral amygdala by suppressing feedforward inhibition. Nat Neurosci. 2003;6:587–592. doi: 10.1038/nn1058. [DOI] [PubMed] [Google Scholar]
- Busti D, Geracitano R, Whittle N, Dalezios Y, Manko M, Kaufmann W, Saetzler K, Singewald N, Capogna M, Ferraguti F. Different fear states engage distinct networks within the intercalated cell clusters of the amygdala. J Neurosci. 2011;31:5131–5144. doi: 10.1523/JNEUROSCI.6100-10.2011. [DOI] [PMC free article] [PubMed] [Google Scholar]
- Chhatwal JP, Myers KM, Ressler KJ, Davis M. Regulation of gephyrin and GABAA receptor binding within the amygdala after fear acquisition and extinction. J Neurosci. 2005;25:502–506. doi: 10.1523/JNEUROSCI.3301-04.2005. [DOI] [PMC free article] [PubMed] [Google Scholar]
- Doyle MW, Andresen MC. Reliability of monosynaptic sensory transmission in brain stem neurons in vitro. J Neurophysiol. 2001;85:2213–2223. doi: 10.1152/jn.2001.85.5.2213. [DOI] [PubMed] [Google Scholar]
- Drummond GB. Reporting ethical matters in The Journal of Physiology: standards and advice. J Physiol. 2009;587:713–719. doi: 10.1113/jphysiol.2008.167387. [DOI] [PMC free article] [PubMed] [Google Scholar]
- Ehrlich I, Humeau Y, Grenier F, Ciocchi S, Herry C, Luthi A. Amygdala inhibitory circuits and the control of fear memory. Neuron. 2009;62:757–771. doi: 10.1016/j.neuron.2009.05.026. [DOI] [PubMed] [Google Scholar]
- Fuxe K, Jacobsen KX, Hoistad M, Tinner B, Jansson A, Staines WA, Agnati LF. The dopamine D1 receptor-rich main and paracapsular intercalated nerve cell groups of the rat amygdala: relationship to the dopamine innervation. Neuroscience. 2003;119:733–746. doi: 10.1016/s0306-4522(03)00148-9. [DOI] [PubMed] [Google Scholar]
- Gähwiler BH, Brown DA. GABAB-receptor-activated K+ current in voltage-clamped CA3 pyramidal cells in hippocampal cultures. Proc Natl Acad Sci U S A. 1985;82:1558–1562. doi: 10.1073/pnas.82.5.1558. [DOI] [PMC free article] [PubMed] [Google Scholar]
- Geracitano R, Kaufmann WA, Szabo G, Ferraguti F, Capogna M. Synaptic heterogeneity between mouse paracapsular intercalated neurons of the amygdala. J Physiol. 2007;585:117–134. doi: 10.1113/jphysiol.2007.142570. [DOI] [PMC free article] [PubMed] [Google Scholar]
- Gozzi A, Jain A, Giovanelli A, Bertollini C, Crestan V, Schwarz AJ, Tsetsenis T, Ragozzino D, Gross CT, Bifone A. A neural switch for active and passive fear. Neuron. 2010;67:656–666. doi: 10.1016/j.neuron.2010.07.008. [DOI] [PubMed] [Google Scholar]
- Hefner K, Whittle N, Juhasz J, Norcross M, Karlsson RM, Saksida LM, Bussey TJ, Singewald N, Holmes A. Impaired fear extinction learning and cortico-amygdala circuit abnormalities in a common genetic mouse strain. J Neurosci. 2008;28:8074–8085. doi: 10.1523/JNEUROSCI.4904-07.2008. [DOI] [PMC free article] [PubMed] [Google Scholar]
- Heldt SA, Ressler KJ. Training-induced changes in the expression of GABAA-associated genes in the amygdala after the acquisition and extinction of Pavlovian fear. Eur J Neurosci. 2007;26:3631–3644. doi: 10.1111/j.1460-9568.2007.05970.x. [DOI] [PMC free article] [PubMed] [Google Scholar]
- Herry C, Ciocchi S, Senn V, Demmou L, Muller C, Luthi A. Switching on and off fear by distinct neuronal circuits. Nature. 2008;454:600–606. doi: 10.1038/nature07166. [DOI] [PubMed] [Google Scholar]
- Herry C, Mons N. Resistance to extinction is associated with impaired immediate early gene induction in medial prefrontal cortex and amygdala. Eur J Neurosci. 2004;20:781–790. doi: 10.1111/j.1460-9568.2004.03542.x. [DOI] [PubMed] [Google Scholar]
- Jacobsen KX, Hoistad M, Staines WA, Fuxe K. The distribution of dopamine D1 receptor and mu-opioid receptor 1 receptor immunoreactivities in the amygdala and interstitial nucleus of the posterior limb of the anterior commissure: relationships to tyrosine hydroxylase and opioid peptide terminal systems. Neuroscience. 2006;141:2007–2018. doi: 10.1016/j.neuroscience.2006.05.054. [DOI] [PubMed] [Google Scholar]
- Jungling K, Seidenbecher T, Sosulina L, Lesting J, Sangha S, Clark SD, Okamura N, Duangdao DM, Xu YL, Reinscheid RK, Pape HC. Neuropeptide S-mediated control of fear expression and extinction: role of intercalated GABAergic neurons in the amygdala. Neuron. 2008;59:298–310. doi: 10.1016/j.neuron.2008.07.002. [DOI] [PMC free article] [PubMed] [Google Scholar]
- Kaoru T, Liu FC, Ishida M, Oishi T, Hayashi M, Kitagawa M, Shimoda K, Takahashi H. Molecular characterization of the intercalated cell masses of the amygdala: implications for the relationship with the striatum. Neuroscience. 2010;166:220–230. doi: 10.1016/j.neuroscience.2009.12.004. [DOI] [PubMed] [Google Scholar]
- LeDoux JE. Emotion circuits in the brain. Annu Rev Neurosci. 2000;23:155–184. doi: 10.1146/annurev.neuro.23.1.155. [DOI] [PubMed] [Google Scholar]
- Likhtik E, Popa D, Apergis-Schoute J, Fidacaro GA, Pare D. Amygdala intercalated neurons are required for expression of fear extinction. Nature. 2008;454:642–645. doi: 10.1038/nature07167. [DOI] [PMC free article] [PubMed] [Google Scholar]
- McDonald AJ. Cytoarchitecture of the central amygdaloid nucleus of the rat. J Comp Neurol. 1982;208:401–418. doi: 10.1002/cne.902080409. [DOI] [PubMed] [Google Scholar]
- McDonald AJ, Augustine JR. Localization of GABA-like immunoreactivity in the monkey amygdala. Neuroscience. 1993;52:281–294. doi: 10.1016/0306-4522(93)90156-a. [DOI] [PubMed] [Google Scholar]
- Mao SC, Hsiao YH, Gean PW. Extinction training in conjunction with a partial agonist of the glycine site on the NMDA receptor erases memory trace. J Neurosci. 2006;26:8892–8899. doi: 10.1523/JNEUROSCI.0365-06.2006. [DOI] [PMC free article] [PubMed] [Google Scholar]
- Marowsky A, Fritschy JM, Vogt KE. Functional mapping of GABAA receptor subtypes in the amygdala. Eur J Neurosci. 2004;20:1281–1289. doi: 10.1111/j.1460-9568.2004.03574.x. [DOI] [PubMed] [Google Scholar]
- Marowsky A, Yanagawa Y, Obata K, Vogt KE. A specialized subclass of interneurons mediates dopaminergic facilitation of amygdala function. Neuron. 2005;48:1025–1037. doi: 10.1016/j.neuron.2005.10.029. [DOI] [PubMed] [Google Scholar]
- Millhouse OE. The intercalated cells of the amygdala. J Comp Neurol. 1986;247:246–271. doi: 10.1002/cne.902470209. [DOI] [PubMed] [Google Scholar]
- Myers KM, Davis M. Mechanisms of fear extinction. Mol Psychiatry. 2007;12:120–150. doi: 10.1038/sj.mp.4001939. [DOI] [PubMed] [Google Scholar]
- Nitecka L, Ben-Ari Y. Distribution of GABA-like immunoreactivity in the rat amygdaloid complex. J Comp Neurol. 1987;266:45–55. doi: 10.1002/cne.902660105. [DOI] [PubMed] [Google Scholar]
- Pape HC, Pare D. Plastic synaptic networks of the amygdala for the acquisition, expression, and extinction of conditioned fear. Physiol Rev. 2010;90:419–463. doi: 10.1152/physrev.00037.2009. [DOI] [PMC free article] [PubMed] [Google Scholar]
- Pare D, Quirk GJ, Ledoux JE. New vistas on amygdala networks in conditioned fear. J Neurophysiol. 2004;92:1–9. doi: 10.1152/jn.00153.2004. [DOI] [PubMed] [Google Scholar]
- Pare D, Smith Y. Distribution of GABA immunoreactivity in the amygdaloid complex of the cat. Neuroscience. 1993a;57:1061–1076. doi: 10.1016/0306-4522(93)90049-l. [DOI] [PubMed] [Google Scholar]
- Pare D, Smith Y. The intercalated cell masses project to the central and medial nuclei of the amygdala in cats. Neuroscience. 1993b;57:1077–1090. doi: 10.1016/0306-4522(93)90050-p. [DOI] [PubMed] [Google Scholar]
- Pare D, Smith Y. GABAergic projection from the intercalated cell masses of the amygdala to the basal forebrain in cats. J Comp Neurol. 1994;344:33–49. doi: 10.1002/cne.903440104. [DOI] [PubMed] [Google Scholar]
- Paxinos G, Franklin K. The Mouse Brain in Stereotaxic Coordinates. Academic Press; 2007. [Google Scholar]
- Pitkanen A, Amaral DG. The distribution of GABAergic cells, fibers, and terminals in the monkey amygdaloid complex: an immunohistochemical and in situ hybridization study. J Neurosci. 1994;14:2200–2224. doi: 10.1523/JNEUROSCI.14-04-02200.1994. [DOI] [PMC free article] [PubMed] [Google Scholar]
- Popescu AT, Saghyan AA, Pare D. NMDA-dependent facilitation of corticostriatal plasticity by the amygdala. Proc Natl Acad Sci U S A. 2007;104:341–346. doi: 10.1073/pnas.0609831104. [DOI] [PMC free article] [PubMed] [Google Scholar]
- Quirk GJ, Likhtik E, Pelletier JG, Pare D. Stimulation of medial prefrontal cortex decreases the responsiveness of central amygdala output neurons. J Neurosci. 2003;23:8800–8807. doi: 10.1523/JNEUROSCI.23-25-08800.2003. [DOI] [PMC free article] [PubMed] [Google Scholar]
- Quirk GJ, Mueller D. Neural mechanisms of extinction learning and retrieval. Neuropsychopharmacology. 2008;33:56–72. doi: 10.1038/sj.npp.1301555. [DOI] [PMC free article] [PubMed] [Google Scholar]
- Rosenkranz JA, Grace AA. Modulation of basolateral amygdala neuronal firing and afferent drive by dopamine receptor activation in vivo. J Neurosci. 1999;19:11027–11039. doi: 10.1523/JNEUROSCI.19-24-11027.1999. [DOI] [PMC free article] [PubMed] [Google Scholar]
- Royer S, Martina M, Pare D. An inhibitory interface gates impulse traffic between the input and output stations of the amygdala. J Neurosci. 1999;19:10575–10583. doi: 10.1523/JNEUROSCI.19-23-10575.1999. [DOI] [PMC free article] [PubMed] [Google Scholar]
- Royer S, Martina M, Pare D. Polarized synaptic interactions between intercalated neurons of the amygdala. J Neurophysiol. 2000;83:3509–3518. doi: 10.1152/jn.2000.83.6.3509. [DOI] [PubMed] [Google Scholar]
- Royer S, Pare D. Bidirectional synaptic plasticity in intercalated amygdala neurons and the extinction of conditioned fear responses. Neuroscience. 2002;115:455–462. doi: 10.1016/s0306-4522(02)00455-4. [DOI] [PubMed] [Google Scholar]
- Ward JH. Hierarchical grouping to optimize an objective function. J Am Stat Assoc. 1963;58:236–244. [Google Scholar]