

Non-technical summary
It is accepted that learning involves creating or increasing the activity of existing chemical connections (synapses) between neurons. Some connections, known as ‘silent synapses’, have no detectable activity under resting conditions but can be switched on by electrical stimuli that mimic learning. To better understand how this occurs, we compared silent and active synapses in cultured neurons. When neurons were challenged with electrical stimulation, the extent of activation of previously active synapses was unchanged, whereas silent synapses were activated. Silent synapse activation did not correlate with increases in intracellular calcium (which evokes neurotransmitter release), but was dependent on the action of the enzyme protein kinase A. A large proportion of synapses in the adult brain are thought to be silent, and therefore a detailed knowledge of silent synapse activation could give insights into the mechanisms of learning and memory.
Abstract
Abstract
Presynaptic long term potentiation of synaptic transmission activates silent synapses and potentiates existing active synapses. We sought to visualise these two processes by studying the cAMP-dependent protein kinase (PKA) potentiation of presynaptic vesicle cycling in cultured cerebellar granule neurons. Using FM dyes to label the pool of recycling synaptic vesicles, we found that trains of electrical stimulation which do not potentiate already active synapses are sufficient to rapidly activate a discrete population comprising silent and very low activity synapses. Silent synapse activation required PKA activity and conversely, active synapses could be silenced by PKA inhibition. Surprisingly, the recycling pool of synaptic vesicles in recently activated synapses was larger than in already active synapses and equivalent to synapses treated with forskolin. Imaging of synaptic vesicle cycling and cytosolic Ca2+ in individual nerve terminals confirmed that silent synapses have evoked Ca2+ transients comparable to those of active synapses. Furthermore, across populations of active synapses, changes in Ca2+ influx did not correlate with changes in the size of the pool of recycling synaptic vesicles. Finally, we found that stimulation of synapsin phosphorylation, but not RIM1α, by PKA was frequency dependent and long lasting. These data are consistent with the idea that PKA regulates synaptic vesicle recycling downstream of Ca2+ influx and that this pathway is highly active in recently activated synapses.
Introduction
Changes in the efficiency of synaptic transmission are believed to underlie learning and memory. The prevailing laboratory model for learning is long term potentiation (LTP) in which a strong brief stimulus produces a long lasting increase in the strength of a synapse (Bliss & Collingridge, 1993). Mechanisms which can account for changes in synaptic strength generally involve modulating the presynaptic release of neurotransmitter and/or the density and activity of postsynaptic neurotransmitter receptors (Malenka & Bear, 2004). Recent developments in elucidating the molecular mechanisms of LTP have focused on ‘silent’ synapses. The activation of silent synapses is thought to be functionally relevant in development where nascent synapses are activated, or in the mature brain to provide reserve capacity for new information processing or storage (Isaac et al. 1997; Isope & Barbour, 2002; Porrill & Dean, 2008). The role of postsynaptic silent synapses in NMDA receptor-dependent hippocampal CA1 LTP is established (Isaac et al. 1995; Kerchner & Nicoll, 2008), but the role of presynaptic silent synapses in LTP at presynaptic nerve terminals of hippocampal mossy fibres or cerebellar parallel fibres is poorly characterised. Proposed mechanisms for presynaptic silence include low release probability, low vesicular neurotransmitter content, or slow release kinetics (Choi et al. 2000; Voronin & Cherubini, 2004). In terms of silent synapse activation, cAMP signalling via cAMP-dependent protein kinase (PKA) has been implicated (Chavis et al. 1998; Ma et al. 1999; Yao et al. 2006), but it is not known whether this uses the same mechanism that has been shown to potentiate already active synapses.
Cerebellar granule neurons (CGNs) are an excellent system to study the regulation of neurotransmitter release by PKA because their parallel fibre synapses have a well established form of PKA-dependent presynaptic LTP in vivo, which can be mimicked in culture by cAMP analogues or adenylyl cyclase agonists such as forskolin (Salin et al. 1996; Chen & Regehr, 1997; Linden & Ahn, 1999; Lonart et al. 2003).
In this study, we have used forskolin treatment of cultured CGNs to study the PKA-dependent modulation of evoked synaptic vesicle (SV) recycling in both active and silent synapses. In agreement with previous studies, we found forskolin potentiates the releasable pool of SVs in active synapses via a PKA-dependent mechanism. In addition, a distinct population of presynaptically silent synapses are rapidly activated by PKA under conditions which do not change the activity of previously active synapses regardless of forskolin treatment. Newly activated synapses had a larger recycling SV pool than already active synapses and similar to that obtained following forskolin treatment. This effect is not due to altered Ca2+ homeostasis because silent synapses have Ca2+ influx comparable to that of active synapses. Therefore, the PKA-dependent activation of silent synapses provides a switch for coupling Ca2+ influx to neurotransmitter release and their subsequent release probability is controlled by Ca2+ and PKA substrates.
Methods
Ethical information
Experiments were performed under the auspices of the UK Animals (Scientific Procedures) Act 1986, using humane (Schedule 1) killing of animals, for which no licence or ethical approval is required.
Materials
FM2-10 was from Invitrogen (Paisley, UK). Fura-2 AM was purchased from Cambridge Bioscience (Cambridge, UK). Anti-phospho-synapsin (pSer9) antibody was obtained from New England BioLabs (Hitchin, UK). Anti-phospho RIM1α (pSer413) rabbit antibody was a generous gift from Prof. Alan Morgan, University of Liverpool. pEGFP-N1-synaptophysin cDNA was a kind gift from Dr J. M. Sullivan (University of Washington, Seattle, WA). Forskolin, H-89, cAMP analogues and all other reagents were from Sigma (Poole, UK).
Primary culture of cerebellar granule neurons
The cerebellum was dissected from 7-day old Sprague–Dawley rat pups (Harlan, Bicester, UK) that had been killed by Schedule 1. Cerebellar granule neurons were dissociated as previously described (Tan et al. 2003) and maintained at 37°C in a humidified atmosphere of 5% CO2. Where indicated, transfection of neurons with 6 μg per coverslip of the pEGFP-synaptophysin construct was performed 24–36 h prior to imaging by the calcium phosphate method (Tan et al. 2003).
Real-time fluorescence imaging of cerebellar neurons
For all imaging experiments, cerebellar neurons (9–12 days in vitro) were seeded on poly-D-lysine coated 25 mm diameter coverslips (no. 1 thickness) at a density of 2 × 10⁶ cells ml−1. The coverslips were mounted in a sealed perfusion chamber (RC-21 BRFS, Warner Instruments, Hamden, CT, USA) and the chamber was mounted on the stage of a Nikon (Tokyo, Japan) Diaphot TV-100 inverted epifluorescence microscope. Images were obtained using a Hamamatsu (Hamamatsu City, Japan) Orca ER CCD camera through a ×20 air objective. All incubations were performed in TES (N-tris[hydroxy-methyl]-methyl-2-aminoethane-sulfonic acid) buffer (170 mm NaCl, 3.5 mm KCl, 0.4 mm KH2PO4, 20 mm TES, 5 mm NaHCO3, 5 mm glucose, 1.2 mm Na2SO4, 1.2 mm MgCl2, 1.3 mm CaCl2, pH 7.4) and for high KCl containing buffers, equimolar NaCl was removed to maintain osmolality. Solutions were applied to neurons by gravity perfusion at a rate of ∼5 ml min−1 and electrical field stimulation (100 mA, 1 ms pulse width) was delivered through platinum electrodes embedded in the sides of the perfusion chamber.
Two consecutive rounds of FM dye loading and unloading, termed S1 and S2, were used to measure the releasable pool of SVs before (S1) and after (S2) a 20 min period in which the cells could be treated with pharmacological agents. The FM dye loading/unloading protocol was performed essentially as previously described (Fig. 1A; Evans & Cousin, 2007a). Briefly, to label SVs, neurons were incubated in TES buffer containing 100 μm FM2-10 and stimulated with 400 or 800 action potentials at the specified frequency or a 2 min incubation with 50 mm KCl. Following stimulation, the FM dye solution was removed and the cells were washed in TES buffer and rested for 10 min to allow recycling of the labelled SVs. Unloading of the dye was performed with two trains of stimuli (usually 40 Hz for 10 s) or two consecutive incubations for 30 s with 50 mm KCl. These stimuli were sufficient to unload ∼95% of the loaded dye (data not shown). During the unloading protocol, images were obtained every 4 s (∼200 ms exposure, 488 nm excitation, >505 nm emission) in order to record the fluorescence intensity of individual FM2-10 labelled synapses over time. After a 20 min rest period, the FM2-10 loading and unloading protocol was repeated to give a second measurement (S2) of the number of releasable vesicles. To determine the effect of forskolin or H-89 on the number of releasable vesicles in S2, drugs were applied for 10 min during the 20 min rest period between S1 and S2.
Figure 1. Frequency-dependent scaling of recycling SV pool size in parallel fibre presynaptic terminals.
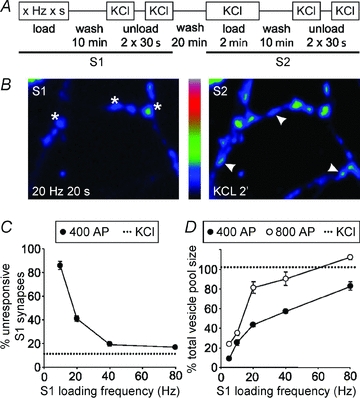
A, protocol of stimulation for measuring the releasable pool of vesicles loaded with FM dye by 400 or 800 action potentials (AP) at various frequencies (S1) as a fraction of the total recycling pool (S2). Following loading of FM2-10 with electrical stimulation (S1) or KCl (S2) the neurons were washed for 10 min and then unloading was achieved by two sequential 30 s stimuli of 50 mm KCl. Neurons were washed for 20 min between S1 and S2 to allow SV recycling. B, representative fields of view of FM2-10 loading by 20 Hz 20 s (S1, left panel) or 50 mm KCl (S2, right panel). Representative ‘active’ synapses loaded with FM2-10 in S1 and S2 are denoted by asterisks and unresponsive synapses not loaded in S1 but loaded in S2 are denoted by arrowheads. C, plot of unresponsive synapse number as a percentage of the total synapses labelled in S2 (defined by KCl stimulation in S2) against the stimulation frequency used in S1 for 400 action potentials. The dotted line represents the number of unresponsive synapses when KCl stimulation was used in S1 and S2. D, plot of releasable pool size in active synapses as a fraction of the total recycling pool against loading frequency for 400 (•) or 800 (○) AP. The dotted line represents the total pool size as determined by FM2-10 loading by 50 mm KCl in S1 and S2. Data for C and D were obtained from ≥3 separate experiments (>75 synapses for each) and plotted as mean ΔFS1/ΔFS2± SEM.
To simultaneously measure SV exocytosis and monitor intracellular Ca2+ concentrations, neurons were loaded with FM2-10 and the Ca2+ indicator fura-2 acetoxy methylester (AM) (1 μm). The simultaneous imaging of FM dye and fura-2 AM in cerebellar granule neurons was previously described and characterised elsewhere (Evans & Cousin, 2007b). The fura-2 AM 340/380 nm fluorescence intensity ratio was converted to Ca2+ concentration using the equation of (Grynkiewicz et al. 1985).
Immunoblotting of stimulated neurons
For pharmacological treatment of cells, cultured cerebellar granule neurons were grown in 60 mm diameter dishes at a density of 2 × 10⁶ cells per dish. Neurons were incubated with the indicated drugs and immediately lysed in 2× SDS-sample buffer. For electrical field stimulation of cells, cultured neurons prepared as described for imaging studies were mounted in an imaging chamber and stimulated at varying frequencies for 20 s. Forty seconds or 1 h after the cessation of stimulation, cells were lysed in 50 μl of boiling SDS-sample buffer. Neuronal lysates were separated by SDS-PAGE, transferred to PVDF membrane and then processed by immunoblotting with anti-phospho-synapsin (pSer-9; 1:500), anti-phospsho-RIM1α (pSer-41331; 1:500) or anti-syntaxin (HPC-1; 1:1000) and appropriate horseradish peroxidase conjugated secondary antibodies (1:5000). Following visualisation with enhanced-chemiluminescence reagent, densitometry was performed with ImageJ to quantify the relative amounts of phosphorylated protein and normalise to the protein loading control (syntaxin).
Data analysis
The movies of fluorescence intensity over time for fields of FM2-10 loaded nerve terminals were analysed using SimplePCI 6.5 software (Hamamatsu Corporation, Sewickley, PA, USA) by assigning regions of interest to ∼100 fluorescent puncta per experiment. A minimum of three separate experiments were analysed for each condition. The resulting time traces were normalized to an arbitrary baseline and the fluorescence changes for each of the two unloading protocols for S1 and S2 were summed to give the total fluorescence changes ΔFS1 and ΔFS2, respectively. To compare the size of the releasable pool of vesicles between S1 and S2, the data were normalised between −1 and 1 (with 0 representing no change) using the formula (ΔFS2–ΔFS1)/(ΔFS2+ΔFS1). Simply expressing changes as ΔFS2/ΔFS1 was rejected because this gives a disproportionate weighting to potentiation (for values greater than 1) over depression (limited to values between 0 and 1). ‘Active’ synapses were defined as those that recorded positive values for ΔFS1 and ΔFS2 while ‘silent’ synapses were defined as those which had a (ΔFS2–ΔFS1)/(ΔFS2+ΔFS1) value of >0.8, i.e. a potentiation of >9-fold (Fig. 2E) or synapses for which the ΔFS1 fluorescence value was not significantly different from background (Figs 4, 6 and 7 and Supplemental Material figures). Where appropriate, data were statistically analysed by Student's t test or one-way ANOVA and post hoc pairwise comparisons performed by the Holm–Sidak method.
Figure 2. Two populations of synaptic activity defined by electrical stimulation and forskolin.
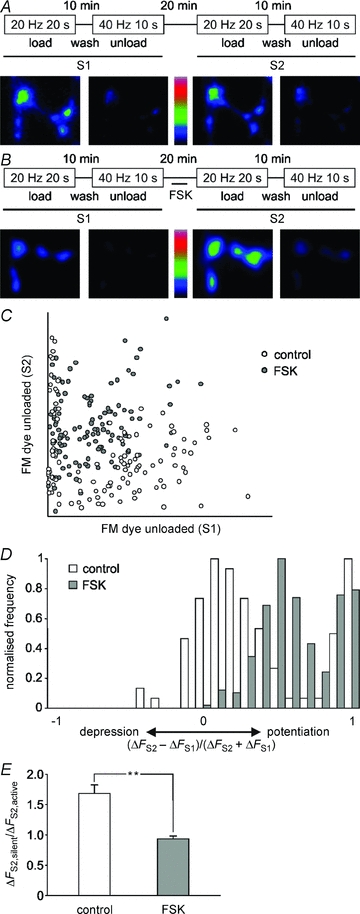
The releasable vesicle pool of presynaptic terminals was sampled twice by two identical FM2-10 loading and unloading protocols, S1 and S2. For S1 and S2, FM2-10 was loaded by a 20 Hz 20 s stimulation and unloaded by two consecutive 40 Hz 10 s stimuli. During a 20 min wash period between S1 and S2, neurons were bathed in the absence (A, control) or presence (B, FSK) of 10 μm forskolin for 10 min. A and B, representative fields of view are shown of loaded and unloaded synapses for S1 and S2 in control and forskolin treated neurons. C, plot of change in FM dye unloading in S1 against S2 for control and FSK treated synapses, n≥ 100 synapses for each dataset. D, normalised frequency histograms of (ΔFS2–ΔFS1)/(ΔFS2+ΔFS1) for populations of control (n = 183) and FSK (n = 254) treated synapses analysed to include all synapses labelled in S2. E, average FM dye de-staining (in arbitrary fluorescence units) in S2 of active and silent synapses under control or forskolin conditions. More than 50 synapses were analysed in n = 3 experiments. Silent and active synapses were defined as described in Methods. Student's t test: **P < 0.01.
Figure 4. Inhibition of PKA prevents silent synapse activation and silences active synapses.
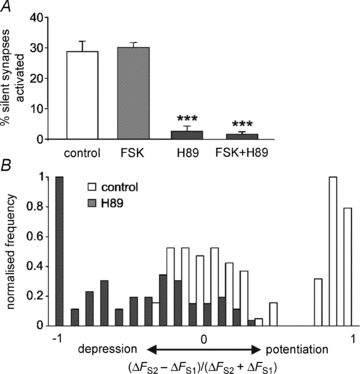
A, plot of mean ± SEM number of activated silent synapses as a percentage of total synapses labelled in S2 for control, FSK, H89 and FSK + H89 treated neurons. For each condition, data from n = 3 independent experiments were analysed (>50 presynaptic terminals for each). One way ANOVA: compared to control, ***P < 0.001. B, normalised frequency histograms of (ΔFS2–ΔFS1)/(ΔFS2+ΔFS1) for representative populations of control (n = 101) and H89 (n = 90) treated synapses, analysed to include all synapses labelled in S2.
Figure 6. Silent synapses have normal Ca2+-influx in S1.
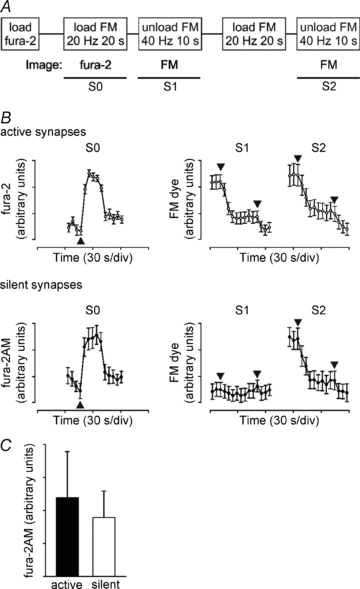
Cerebellar granule neurons were loaded with 1 μm fura-2AM and then subjected to the S1–S2 FM2-10 loading/unloading protocol from Fig. 2A. The protocol of stimulation and recording is shown in A. Images of fura-2AM fluorescence were captured during the first 20 Hz 20 s loading stimulation (S0). B, fluorescence traces from a single representative experiment (means ± SEM, n > 15 synapses) are shown for FM2-10 and fura-2AM (340/380 nm ratio) in active (○) and silent synapses (•). Arrowheads indicate the timing of the appropriate stimuli (see A). C, plot of maximum Ca2+ transient height (Fura-2AM 340/380 nm ratio) for silent and active synapses in S0 (means ± SEM, n = 3 separate experiments).
Figure 7. Changes in Ca2+ influx do not correlate with changes in the extent of exocytosis across populations of active and silent synapses.
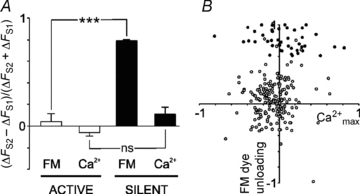
A, quantification of mean (ΔFS2–ΔFS1)/(ΔFS2+ΔFS1) values ± SEM (n = 3 experiments) for active and silent synapses simultaneously imaged with FM2-10 (FM) and fura-2 (Ca2+). One way ANOVA: ***P < 0.001. For the fura2-AM analysis, the maximum peaks of the 340/380 transients were used  . B, plot of the raw data from A (change in
  against change in FM dye unloading) for active (○) and silent synapses (•) between S1 and S2, calculated from: (ΔFS2–ΔFS1)/(ΔFS2+ΔFS1).
Results
Frequency dependency of SV recycling and silent synapse activation
To sample presynaptic plasticity in active synapses and observe the activation of silent synapses, we established a robust protocol in CGNs to detect changes in SV turnover. In the first instance we determined the sensitivity of SV loading and unloading of the membrane dye FM2-10 by stimulating at a range of frequencies. Figure 1A outlines a stimulation protocol in which recycling SVs were first loaded with FM2-10 by 400 action potentials (AP) at 5, 10, 20, 40 and 80 Hz and then unloaded with KCl to give a fluorescence change termed ΔFS1. After a rest period, the extent of SV recycling was compared to maximal SV turnover by loading and unloading the same neurons with KCl (which labels the entire pool of recycling SVs; Evans & Cousin, 2007a) to give the fluorescence change ΔFS2. By comparing the extent of FM2-10 loading and unloading between electrical field (S1) and KCl (S2) stimuli, two classes of synapse were revealed: those active in both S1 and S2 (Fig. 1B, asterisks) and those that were unresponsive in S1 and then active in S2 (Fig. 1B, arrowheads). Quantification of these two populations revealed that the percentage of responsive active synapses was frequency dependent and maximal at 40–80 Hz (Fig. 1C). Therefore, a large proportion of unresponsive or ‘silent’ synapses have an extremely low release probability and were not loaded with FM-dye during a 400 AP stimulus at up to 20–40 Hz.
We then selectively analysed synapses that responded to electrical stimulation in S1 and found that the proportion of the total SV pool loaded was also frequency dependent (Fig. 1D). The relationship was biphasic with a steep frequency dependency up to 20 Hz, and a second phase which slowly rose to a maximum at 80 Hz. A similar relationship was observed for the same frequencies delivered for a longer duration of 800 AP (Fig. 1D).
The size of the releasable pool of SVs in active synapses is regulated by PKA
We next addressed the mechanisms responsible for the modulation of SV turnover in active synapses and the dramatic activation of silent synapses. The stimulation protocol was altered such that the loading stimuli in S1 and S2 were identical and the effect of pharmacological agents on SV recycling could be assessed by incubations between S1 and S2 (Fig. 2A). A loading stimulation of 400 AP at 20 Hz was chosen as the test stimulus in these experiments because this stimulation labelled ∼40–50% of the total releasable pool of SVs (Fig. 1D), thus allowing for the detection of both potentiation and depression of SV recycling. Furthermore, this allowed the study of the population of silent synapses (∼30%) not activated during this stimulation. An unloading stimulus of 2 × 40 Hz 10 s was chosen to quantify the extent of SV turnover because this stimulus unloaded approximately 95% of loaded dye (data not shown). Under these conditions, the population of synapses active in S1 showed very little change in FM dye loading between S1 and S2 (Fig. 2A).
We chose to investigate the role of PKA on evoked SV turnover and silent synapse activation in our culture system, since the adenylyl cyclase agonist forskolin and cAMP analogues both elicit parallel fibre potentiation in cerebellar slices and dissociated cultures (Salin et al. 1996; Chavis et al. 1998; Lonart et al. 2003) suggesting a key role for PKA activity in increased SV mobilisation. We observed a large potentiation of FM dye loading following a 10 min incubation with 10 μm forskolin (Fig. 2B). On average, forskolin increased loading by a 400 AP 20 Hz stimulation from ∼40% to ∼100% of the releasable pool previously defined by KCl stimulation. Analysis of fluorescence changes for individual synapses revealed a strikingly heterogeneous pattern of synaptic activity. However, by plotting ΔFS1 against ΔFS2 we were able to discern two populations of synaptic activity (Fig. 2C). These populations were further clarified by normalising the ΔFS1 and ΔFS2 fluorescence data with the equation: (ΔFS2–ΔFS1)/(ΔFS2+ΔFS1), which equally weights potentiation and depression on a scale from −1 to +1, with 0 representing no change. Expressing these data as a frequency histogram clearly revealed the biphasic distribution of both control and forskolin treated synapses (Fig. 2D), where the population of ‘silent’ synapses was represented by synapses which had undergone a high degree of potentiation (where (ΔFS2−ΔFS1)/(ΔFS2+ΔFS1) > 0.8) due to their extremely low ΔFS1 value.
The active population was potentiated by 2.68 ± 0.64-fold (calculated as the mean ΔFS2/ΔFS1) by the addition of forskolin. This was equivalent to KCl stimulation in S2, where the maximal releasable pool of SVs is recruited. The number of silent synapses was not significantly enhanced by forskolin because all available silent synapses are already activated under control conditions (see Fig. 4A for quantification). Surprisingly, however, the average activity in S2 of the silent synapse population activated under control conditions was significantly greater than that of the active synapse population (Fig. 2E).
We also tested the longevity of the plasticity and found that even 1 h after forskolin treatment, potentiation of FM dye loading in S2 was not significantly different from 5 min post-incubation (Fig. 3A). To confirm that forskolin was acting presynaptically and was unaffected by stimulation of postsynaptic cells by presynaptic glutamate release, we repeated the experiment in the presence of glutamate receptor antagonists 6-cyano-7-nitroquinoxaline-2,3-dione and 2-amino-5-phosphonopentanoic acid and found the potentiation to be unaffected (Fig. 3A). Pre-treatment with the PKA inhibitor H89 (1 μm) prior to forskolin completely abolished the enhancement, suggesting forskolin is acting through PKA to potentiate presynaptic activity (Fig. 3B). H89 treatment also reduced SV recycling in control synapses, suggesting that constitutive PKA activity might have a role in determining the basal level of activity-dependent SV recycling in the synapse. The effects of forskolin and H89 upon PKA are downstream of voltage sensitive Ca2+ channels, because these treatments did not alter bulk Ca2+ transients measured in synapses loaded with the Ca2+ indicator fura-2 (Fig. 3C and D).
Figure 3. Forskolin potentiates active synapses via presynaptic PKA downstream of Ca2+ influx.
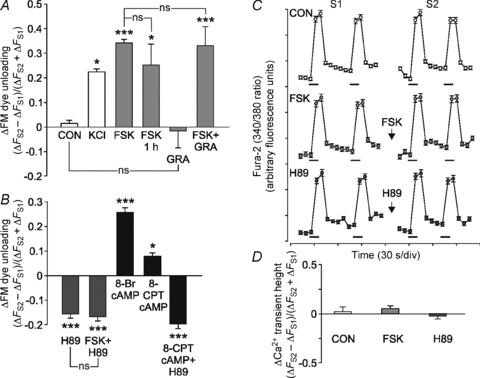
Data are plotted as mean (ΔFS2−ΔFS1)/(ΔFS2+ΔFS1) values ± SEM for synapses active in S1 under the following conditions: A, control (CON), KCl (50 mm), FSK (10 μm), FSK 1 h (10 μm, S2 load/unload at 1 h post FSK), glutamate receptor antagonists (GRA; 100 μm CNQX and 50 μm AP5) and FSK plus GRA; B, H89 (5 μm), FSK + H89, 8-Br cAMP (100 μm) and 8-CPT-2′-O-Me-cAMP (100 μm). GRA were present in all buffers while the other drugs were incubated during the 20 min wash period. For each condition, data from at least 3 independent experiments were analysed (n > 50 presynaptic terminals for each). One-way ANOVA: compared to control, *P < 0.05, ***P < 0.001. C, CGNs loaded with 1 μm Fura-2 AM were subjected to the stimulation protocol in Fig. 2A with control, FSK (10 μm) or H89 (5 μm) treatment during the 20 min period between S1 and S2. Representative graphs are shown of the mean ± SEM 340/380 nm fluorescence ratios from >30 synapses plotted against time for each condition. Bars indicate 40 Hz 10 s stimulation. D, quantification of the difference in Ca2+ transient height (maximum fura-2 fluorescence) between S1 and S2 (ΔFS2−ΔFS1)/(ΔFS2+ΔFS1) for the conditions in C (one-way ANOVA: not significant P > 0.05).
A sizeable cAMP-dependent plasticity that is preferentially due to cAMP-dependent guanylate exchange factor (Epac), rather than PKA, has been demonstrated in the giant presynaptic terminals of the Calyx of Held (Kaneko & Takahashi, 2004). The possibility that other presynaptic forms of potentiation, such as mossy fibre LTP in the hippocampus or parallel fibre LTP in the cerebellum have an Epac-dependent component has not been investigated. To differentiate between PKA and Epac-dependent effects in our system we compared a selective agonist of Epac, 8-CPT-2′-O-Me-cAMP, with 8-Br-cAMP which activates both PKA and Epac (Christensen et al. 2003). 8-Br-cAMP at 100 μm produced a potentiation of presynaptic activity comparable to that of forskolin (Fig. 3B). However, the Epac selective analogue produced a small potentiation above control levels, which was inhibited by H89, suggesting a non-specific activation of PKA (Fig. 3B).
Silent synapses are activated downstream of PKA and nascent synapses represent a small fraction of the silent synapse population
Although forskolin did not further increase the size of the silent synapse population, we found that H89 treatment during the period between S1 and S2 inhibited silent synapse activation in the presence or absence of forskolin (Fig. 4A). Further analysis of active synapses treated with H89 showed that the average activity of the population decreased and many synapses were silenced compared to control (Fig. 4B).
We also investigated to what extent silent synapse activation arises from the formation of new synapses in the 20 min period between S1 and S2, perhaps via the trafficking of synaptic components and/or SVs (Darcy et al. 2006). The S1/S2 protocol (see Fig. 2A) was performed on neurons expressing GFP fused to the integral SV membrane protein synaptophysin (Fig. 5A). Of the puncta that contained GFP fluorescence in S1, the fluorescence intensity did not change in S2, suggesting that gross changes in SV numbers in active synapses did not occur between S1 and S2 (Fig. 5B). Comparing the localisation of GFP stained puncta in S1 and S2 identified presynaptic sites which were new and also those that had disappeared in S2. Only 3–4% of all synapses were nascent in S2, suggesting that the majority of silent synapses contain SVs in S1 (Fig. 5C). Furthermore, the proportion of nascent synapses was not affected by forskolin or H-89 treatment. A significant proportion of synapses were found to disappear between S1 and S2 (Fig. 5C); however, these synapses were absent from our previous analysis of active and silent synapses because only synapses active in S2 were processed.
Figure 5. Silent synapses are pre-existing structures.
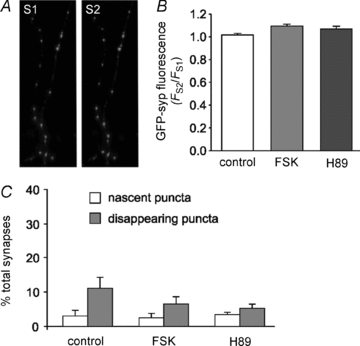
Neurons transfected with GFP-synaptophysin were subjected to the S1/S2 control, FSK and H89 protocols described in Fig. 3. Representative fluorescence images of transfected neurons were taken after the 20 Hz 20 s loading stimuli in S1 and S2. A, GFP-synaptophysin images from control treated cells in S1 and S2. B, quantification of GFP-synaptophysin fluorescence, expressed as FS2/FS1 in control, FSK (10 μm) and H89 (5 μm) treated neurons. C, the S1 and S2 images were overlaid and the number of fluorescent puncta appearing and disappearing from S1 to S2 plotted as a percentage of the total labelled puncta. For B and C, data are means ± SEM, n≥ 3 separate experiments for each condition, with >50 labelled puncta per experiment. One-way ANOVA: B, not significant, for nascent and disappearing datasets, P > 0.05 and C, not significant, P > 0.05.
Silent synapses have Ca2+ influx comparable to active synapses
To determine whether silent synapse activation is due to alterations in Ca2+ influx through voltage-dependent Ca2+ channels, we loaded cultured neurons with the Ca2+ indicator fura-2 AM to assess intracellular Ca2+ during S1 FM dye loading (S0, Fig. 6A). FM dye unloading was then imaged in S1 and S2 and the fura-2 AM fluorescence was retrospectively analysed in synapses identified as active or silent by FM dye unloading. The 20 Hz 20 s S0 loading stimulus produced a robust Ca2+ transient in active and silent synapses (Fig. 6B and C) suggesting that activation lies downstream of Ca2+ channel activation in the coupling of Ca2+ to the SV release machinery.
To further explore the relationship between Ca2+ and the extent of vesicle recycling in active and silent synapses, simultaneous imaging of Fura-2 AM and FM dye loaded synapses (Evans & Cousin, 2007b) was performed during the S1 and S2 unloading stimuli (see Supplemental Material, for representative traces). Quantification of multiple experiments confirmed there is no change in the Ca2+ signal from S1 to S2 for silent and active synapses (Fig. 7A). However, a plot of the raw data from populations of synapses revealed not only an uncoupling of Ca2+ from release in silent synapses, but a lack of correlation between changes in Ca2+ and changes in FM dye unloading from active synapses between S1 and S2 (Fig. 7B). These data suggest that in addition to Ca2+, there are other factors, such as the cAMP-dependent mechanisms described here, which determine the net extent of neurotransmitter release.
PKA phosphorylation of synapsin is frequency and isoform dependent
To shed light on possible downstream targets of PKA we examined the phosphorylation status of two presynaptic PKA substrates implicated in the activity-dependent modulation of neurotransmitter release: synapsin and RIM1α. To detect phosphorylation, we used phosphospecific antibodies raised to published PKA sites in these proteins, Ser9 for synapsin and Ser413 for RIM1α (Czernik et al. 1987; Lonart et al. 2003). In our cultures, the basal phosphorylation of synapsin was almost undetectable but increased significantly following treatment with KCl or forskolin. These increases were inhibited by pre-incubation with H89 (Fig. 8A). The phosphorylation of synapsin and RIM1α were also monitored following electrical field stimulation at various frequencies (Fig. 8B and C). RIM1α did not show any significant modulation on Ser413 by electrical field stimulation or KCl treatment. However, synapsin phosphorylation demonstrated a marked frequency dependency, rising sharply and peaking at 20 Hz, reminiscent of the frequency dependency of SV recycling over the same range in Fig. 1C. Interestingly, the synapsin Ib isoform was most phosphorylated by electrical stimulation, whereas KCl and forskolin stimulation appeared to increase phosphorylation of all isoforms equally. To discover whether synapsin phosphorylation is transient we tested synapsin phosphorylation at 1 h post-20 Hz stimulation (Fig. 8D). Synapsin phosphorylation was still enhanced at 1 h, suggesting it might represent a long term property of activated synapses.
Figure 8. PKA phosphorylation of synapsin Ser9, but not RIM1α Ser413, correlates with the frequency dependency of release in active synapses.
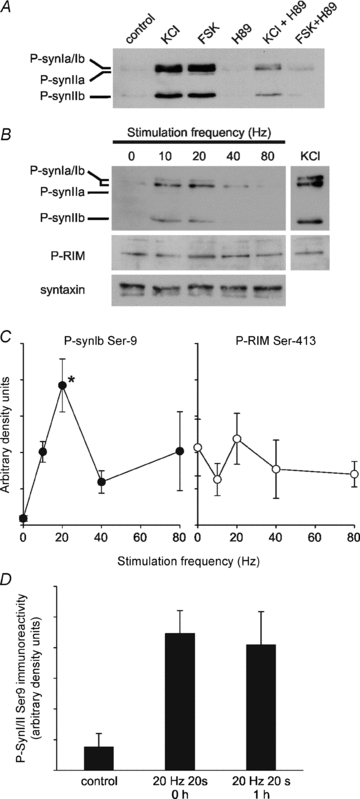
A, cerebellar granule neurons were treated with TES buffer alone or buffer containing 50 mm KCl (2 min) or 10 μm forskolin (5 min; FSK) in the presence or absence of 5 μm H89 and the lysed samples were immunoblotted with anti-synapsin P-Ser9. B, neurons were electrically stimulated with 0, 10, 20, 40 or 80 Hz for 20 s and then incubated for 40 s prior to lysis in boiling SDS-sample buffer. Neurons were also treated with 50 mm KCl for 2 min and lysed. Representative immunoblots are shown of the treated lysates for P-synapsin, P-RIM and syntaxin (loading control). C, plot of density for P-synapsin (left) and P-RIM (right) against frequency, normalised to syntaxin to control for protein loading. Data are mean density ± SEM, n = 3 separate experiments. One-way ANOVA: *P < 0.05 compared to control. D, plot of density for P-synapsin immunoreactivity for neurons untreated (control) and immediately after or 1 h after a 20 Hz 20 s stimulus. Data are mean density ± SEM, n = 4 separate coverslips for each condition.
Discussion
The activation of presynaptically silent synapses provides a putative mechanism for increasing synaptic transmission in development and in learning and memory. Using FM dye-loading of CGNs we have studied the regulation of activity-dependent SV recycling in silent and active presynaptic nerve terminals. We found unresponsive ‘silent’ synapses that are activated over a time scale of minutes by high frequency stimulation in a PKA-dependent manner and downstream of Ca2+ influx. Similarly, changes in the extent of vesicle recycling in active synapses are also regulated by PKA activity and do not correlate with changes in Ca2+. PKA mediates both the activation of silent synapses and the scaling of SV cycling in active synapses, and thus exerts great influence over the release probability of presynaptic nerve terminals.
Our initial exploration of the relationship between the frequency of stimulation and the extent of vesicle recycling showed that the proportion of the total vesicle pool that was recycled scaled steeply with frequency up to 20 Hz, possibly indicating a short term facilitation due to residual calcium. Above 20 Hz, the extent of loading began to plateau, regardless of stimulus length. This is likely to be due to a dominance at higher frequencies of synaptic depression as a result of more SVs being directed through a bulk endocytosis mode of recycling. SVs become available for exocytosis much more slowly via this endocytosis mode and directly replenish the reserve pool of SVs (Cheung et al. 2010). This effect might be further compounded by the slower rate of endocytosis at 25°C, the temperature at which we performed our experiments (Fernández-Alfonso & Ryan, 2004).
Even under conditions of strong stimulation, there were unresponsive ‘silent’ synapses that were not loaded with FM dye in S1 and were then detected in S2. Possible explanations for this observation are that synapses were formed de novo (e.g. Ma et al. 1999; Kim et al. 2003), existing presynaptic sites devoid of vesicles were filled with vesicles (e.g. Darcy et al. 2006) or synapses with small FM dye fluorescence were assigned as silent due to a lack of sensitivity of the CCD camera. However, using the expression of GFP-synaptophysin to monitor the localisation of SVs during our stimulation protocols showed that only a small fraction of synapses were nascent and could not account for the large population of activated silent synapses that appeared in S2. Furthermore, the fluorescence intensity of GFP-synaptophysin labelled synapses did not increase from S1 to S2 under any condition (Fig. 5B), suggesting existing synapses were not potentiated by filling with more SVs. It is also evident from the S1 vs. S2 plot in Fig. 2C and the frequency histogram in Fig. 2D, that some of the synapses we defined as ‘silent’ (bins 0.9–1) have small, albeit weak, FM dye unloading in S1, but are clearly distinct from the ‘active’ population with regards to their magnitude of potentiation in S2. Therefore we do not believe that the assignment of synapses to the silent population was affected by discrepancies arising from non-specific FM dye staining or a lack of sensitivity of the CCD camera. Taken together, these data suggest silent synapses are a heterogeneous but discrete population that are activated by a dramatic increase in the release probability of SVs in pre-existing synapses.
Increases in release probability can result from one or a combination of the following: (i) an increase in Ca2+ influx, (ii) an increase in the releasable SV pool size, (iii) more efficient coupling of Ca2+ to SV release, and more controversially, (iv) an increase in the kinetics of fusion pore expansion in kiss-and-run events (reviewed by Choi et al. 2000; Neher & Sakaba, 2008; Branco & Staras, 2009). Any modulation of Ca2+ influx during silent synapse activation was considered unlikely when we discovered that evoked Ca2+ transients were comparable in silent and already active synapses and unaffected by forskolin or H89 treatment (Figs 3 and 6). However the high affinity and slow kinetics of Ca2+ binding to fura-2 AM mean the Ca2+ signal we observed is likely to be residual Ca2+ following trains of APs (a sum of Ca2+ influx and Ca2+ removal), and not the Ca2+ influx directly responsible for release.
Despite the caveat of monitoring residual calcium in our nerve terminals, our interpretation is supported by numerous studies that have confirmed a role for cAMP via PKA in the rapid modulation of the releasable vesicle pool size and the coupling of Ca2+ to release in active synapses (Trudeau et al. 1996; Chen & Regehr, 1997; Chavis et al. 1998; Bonanomi et al. 2005). Furthermore, we found that forskolin treatment enhanced the loading of FM dye and increased the kinetics of FM dye unloading in active synapses suggesting more SVs are labelled and released. This effect was reversed by H89, thus implicating PKA in the process. We also found that H89 abolished silent synapse activation and was able to rapidly silence previously active synapses. This finding agrees with Chavis et al. (1998). who monitored spontaneous release in cerebellar granule neurons and observed silent synapse activation by forskolin within minutes. However, there are also reports in which activation of silent synapses does not occur rapidly following a short stimulation of cAMP signalling (Trudeau et al. 1996) or occurs over a time scale of hours (Ma et al. 1999; Moulder et al. 2008). A plausible explanation for these differences is that neuronal cell types that undergo presynaptic LTP have the ability to rapidly activate silent synapses via cAMP (this study; Tong et al. 1996; Chavis et al. 1998) whereas neurons which exhibit postsynaptic LTP have a slow activation of silent synapses by cAMP (Ma et al. 1999; Moulder et al. 2008). This theory is strongly supported by Tong et al. (1996) who only observed cAMP sensitive silent synapses and presynaptic LTP in the granule neurons of mixed hippocampal cultures. However, alternative signalling mechanisms have been linked with presynaptic silent synapse activation in other neuronal cell types, including pathways downstream of brain derived neurotrophic factor (BDNF) or phorbol ester (Shen et al. 2006; Chang et al. 2010).
Using simultaneous imaging of FM dye and fura-2 within individual synapses (Lagnado et al. 1996; Evans & Cousin, 2007b), we found that the magnitude of the peak Ca2+ signal within populations of active and silent synapses was extremely heterogeneous and did not directly correlate with the extent of release (Fig. 7). Such heterogeneity is in agreement with previous observations of calcium indicators in populations of synapses in culture and in situ (Koester & Sakmann, 2000; Brenowitz & Regehr, 2007; Dreosti et al. 2009). We propose that the activity of PKA in synapses has a major role in determining the level of Ca2+–secretion coupling. This is supported by previous work in the calyx of Held where the amount of Ca2+ influx was varied in the presence of forskolin or cAMP analogues, but had no effect on their potentiation (Sakaba & Neher, 2001). Interestingly, the potentiation was subsequently attributed to Epac activation (Kaneko & Takahashi, 2004), which we were unable to replicate in our system using an Epac selective agonist (Fig. 3). With the likelihood that the magnitude of Ca2+ influx and PKA activity are heterogeneous across populations of synapses, this could explain a lack of correlation between Ca2+ and release. In the future, it might be possible to simultaneously image fluorescent sensors for PKA activity and Ca2+ within individual presynaptic terminals to test this hypothesis.
It was surprising to find that the average activity in S2 of the silent synapse population was significantly greater than that of active synapses under control conditions, and comparable to those potentiated by forskolin (Fig. 2C and E). This raises the possibility that PKA activity is higher or its downstream signalling is more sensitive in these synapses. Whether these synapses remain highly active remains to be determined. A potential mechanism for regulating the efficiency of PKA signalling is compartmentalisation in the presynaptic terminal by A-kinase anchor proteins (Wong & Scott, 2004). Furthermore, PKA targets involved in SV cycling could be differentially modulated in active and silent synapses.
Previous studies have linked the PKA-dependent phosphorylation state of synapsin at Ser9 (site 1) with the availability of releasable vesicles from the reserve pool in response to membrane depolarisation (Hosaka et al. 1999; Bonanomi et al. 2005; Menegon et al. 2006). We observed a similar frequency-dependent phosphorylation of synapsin at site 1 to that of the recycling vesicle pool size, but only up to 20 Hz. Unexpectedly, higher frequencies resulted in less phosphorylation, which might be due to concomitant increases in phosphatase activity at high intracellular Ca2+ concentrations. We also found that synapsin phosphorylation persisted for at least an hour and might therefore be a marker of activated synapses.
Intriguingly we observed a preferential phosphorylation of synapsin Ib over other isoforms by electrical stimulation compared to approximately equal phosphorylation across synapsin I and II isoforms by KCl or forskolin. There are previous reports of frequency-dependent effects of synapsin I phosphorylation mutants (Chi et al. 2003), but not for the same site between different isoforms. Combined with the biphasic relationship between synapsin phosphorylation and frequency, these data suggest the encoding of specific phosphorylation signals is dependent on the pattern of action potential stimulation. As mentioned above, this might arise in part from compartmentalisation of cAMP signalling.
It is unlikely that synapsin alone is responsible for the activation of completely silent synapses because double knockout synapsin I/II mice still exhibit presynaptic LTP and forskolin-dependent potentiation (Spillane et al. 1995). An attractive hypothesis is that a protein involved in a rate limiting step of SV exocytosis, such as Ca2+ sensing, vesicle docking, priming or fusion, is phosphorylated by PKA upon activation. Among the substrates that fulfil these roles are RIM1α (Lonart et al. 2003) and synaptosomal protein of 25 kDa (SNAP-25; Nagy et al. 2004). Unfortunately we did not observe any changes in RIM1α-Ser413 phosphorylation by forskolin, KCl or electrical stimulation in cultured cerebellar granule neurons (Fig. 8) and a decisive knock-in experiment recently disproved a role for RIM1α-Ser413 phosphorylation in parallel fibre LTP (Kaeser et al. 2008). However, the phosphorylation of SNAP-25 at Thr138 by PKA has been shown to regulate dense core vesicle exocytosis in adrenal chromaffin cells at the level of vesicle priming (Nagy et al. 2004), but is yet to be studied in neurons.
Conclusion
In this study we have observed the PKA-dependent activation of presynaptic silent synapses in cultures of neurons that undergo parallel fibre LTP in vivo. Plasticity at the parallel fibre synapses of the cerebellar molecular layer regulates motor learning and perturbation of parallel fibre synaptic transmission has profound effects on motor learning paradigms (reviewed by Evans, 2007). Furthermore, recordings in cerebellar slices from adult rats suggest that the majority (∼80%) of parallel fibre synapses are silent (Isope & Barbour, 2002) and theoretical modelling of cerebellar cortical circuits predicts a requirement for silent synapse activation in motor learning (Porrill & Dean, 2008). Therefore the activation of presynaptic silent synapses might be an important process for cerebellar motor learning and the PKA substrate(s) responsible must now be identified.
Acknowledgments
This work was supported by a Wellcome Trust grant to M.A.C. (Ref: GR070569). We are grateful to Prof. Alan Morgan (University of Liverpool) for the phospho-RIM1α antibody.
Glossary
Abbreviations
- AP
action potentials
- CGN
cerebellar granule neuron
- Epac
cAMP-dependent guanylate exchange factor
- LTP
long-term potentiation
- PKA
cAMP-dependent protein kinase
- SV
synaptic vesicle
- TES
N-tris[hydroxy-methyl]-methyl-2-aminoethanesulfonic acid
Author contributions
G.J.O.E. conceived the study and G.J.O.E. and M.A.C. designed the experiments. G.J.O.E. and M.A.C. collected, analysed and interpreted the data and were responsible for drafting and revising the manuscript. Both authors approved the final version of the manuscript.
Supplementary material
Suppl. Fig. 1
Suppl. Fig. 2
As a service to our authors and readers, this journal provides supporting information supplied by the authors. Such materials are peer-reviewed and may be re-organized for online delivery, but are not copy-edited or typeset. Technical support issues arising from supporting information (other than missing files) should be addressed to the authors
References
- Bliss TV, Collingridge GL. A synaptic model of memory: long-term potentiation in the hippocampus. Nature. 1993;361:31–39. doi: 10.1038/361031a0. [DOI] [PubMed] [Google Scholar]
- Bonanomi D, Menegon A, Miccio A, Ferrari G, Corradi A, Kao HT, Benfenati F, Valtorta F. Phosphorylation of synapsin I by cAMP-dependent protein kinase controls synaptic vesicle dynamics in developing neurons. J Neurosci. 2005;25:7299–7308. doi: 10.1523/JNEUROSCI.1573-05.2005. [DOI] [PMC free article] [PubMed] [Google Scholar]
- Branco T, Staras K. The probability of neurotransmitter release: variability and feedback control at single synapses. Nat Rev Neurosci. 2009;10:373–383. doi: 10.1038/nrn2634. [DOI] [PubMed] [Google Scholar]
- Brenowitz SD, Regehr WG. Reliability and heterogeneity of calcium signaling at single presynaptic boutons of cerebellar granule cells. J Neurosci. 2007;27:7888–7898. doi: 10.1523/JNEUROSCI.1064-07.2007. [DOI] [PMC free article] [PubMed] [Google Scholar]
- Chang CY, Jiang X, Moulder KL, Mennerick S. Rapid activation of dormant presynaptic terminals by phorbol esters. J Neurosci. 2010;30:10048–10060. doi: 10.1523/JNEUROSCI.1159-10.2010. [DOI] [PMC free article] [PubMed] [Google Scholar]
- Chavis P, Mollard P, Bockaert J, Manzoni O. Visualization of cyclic AMP regulated presynaptic activity at cerebellar granule cells. Neuron. 1998;20:773–781. doi: 10.1016/s0896-6273(00)81015-6. [DOI] [PubMed] [Google Scholar]
- Chen C, Regehr WG. The mechanism of cAMP mediated enhancement at a cerebellar synapse. J Neurosci. 1997;17:8687–8694. doi: 10.1523/JNEUROSCI.17-22-08687.1997. [DOI] [PMC free article] [PubMed] [Google Scholar]
- Cheung G, Jupp OJ, Cousin MA. Activity-dependent bulk endocytosis and clathrin-dependent endocytosis replenish specific synaptic vesicle pools in central nerve terminals. J Neurosci. 2010;30:8151–8161. doi: 10.1523/JNEUROSCI.0293-10.2010. [DOI] [PMC free article] [PubMed] [Google Scholar]
- Chi P, Greengard P, Ryan TA. Synaptic vesicle mobilization is regulated by distinct synapsin I phosphorylation pathways at different frequencies. Neuron. 2003;38:69–78. doi: 10.1016/s0896-6273(03)00151-x. [DOI] [PubMed] [Google Scholar]
- Choi S, Klingauf J, Tsien RW. Postfusional regulation of cleft glutamate concentration during LTP at ‘silent synapses’. Nat Neurosci. 2000;3:330–336. doi: 10.1038/73895. [DOI] [PubMed] [Google Scholar]
- Christensen AE, Selheim F, de R, Dremier S, Schwede F, Dao KK, Martinez A, Maenhaut C, Bos JL, Genieser HG, Døskeland SO. cAMP analog mapping of Epac1 and cAMP kinase. Discriminating analogs demonstrate that Epac and cAMP kinase act synergistically to promote PC-12 cell neurite extension. J Biol Chem. 2003;278:35394–35402. doi: 10.1074/jbc.M302179200. [DOI] [PubMed] [Google Scholar]
- Czernik AJ, Pang DT, Greengard P. Amino acid sequences surrounding the cAMP-dependent and calcium/calmodulin-dependent phosphorylation sites in rat and bovine synapsin I. Proc Natl Acad Sci U S A. 1987;84:7518–7522. doi: 10.1073/pnas.84.21.7518. [DOI] [PMC free article] [PubMed] [Google Scholar]
- Darcy KJ, Staras K, Collinson LM, Goda Y. Constitutive sharing of recycling synaptic vesicles between presynaptic boutons. Nat Neurosci. 2006;9:315–321. doi: 10.1038/nn1640. [DOI] [PubMed] [Google Scholar]
- Dreosti E, Odermatt B, Dorostkar MM, Lagnado L. A genetically encoded reporter of synaptic activity in vivo. Nat Methods. 2009;6:883–889. doi: 10.1038/nmeth.1399. [DOI] [PMC free article] [PubMed] [Google Scholar]
- Evans GJO. Synaptic signalling in cerebellar plasticity. Biol Cell. 2007;99:363–378. doi: 10.1042/BC20070010. [DOI] [PubMed] [Google Scholar]
- Evans GJO, Cousin MA. Activity-dependent control of slow synaptic vesicle endocytosis by cyclin-dependent kinase 5. J Neurosci. 2007a;27:401–411. doi: 10.1523/JNEUROSCI.3809-06.2007. [DOI] [PMC free article] [PubMed] [Google Scholar]
- Evans GJO, Cousin MA. Simultaneous monitoring of three key neuronal functions in primary neuronal cultures. J Neurosci Methods. 2007b;160:197–205. doi: 10.1016/j.jneumeth.2006.09.012. [DOI] [PMC free article] [PubMed] [Google Scholar]
- Fernández-Alfonso T, Ryan TA. The kinetics of synaptic vesicle pool depletion at CNS synaptic terminals. Neuron. 2004;41:943–953. doi: 10.1016/s0896-6273(04)00113-8. [DOI] [PubMed] [Google Scholar]
- Grynkiewicz G, Poenie M, Tsien RY. A new generation of Ca2+ indicators with greatly improved fluorescence properties. J Biol Chem. 1985;260:3440–3450. [PubMed] [Google Scholar]
- Hosaka M, Hammer RE, Südhof TC. A phospho-switch controls the dynamic association of synapsin with synaptic vesicles. Neuron. 1999;24:377–387. doi: 10.1016/s0896-6273(00)80851-x. [DOI] [PubMed] [Google Scholar]
- Isaac JT, Crair MC, Nicoll RA, Malenka RC. Silent synapses during development of thalamocortical inputs. Neuron. 1997;18:269–280. doi: 10.1016/s0896-6273(00)80267-6. [DOI] [PubMed] [Google Scholar]
- Isaac JT, Nicoll RA, Malenka RC. Evidence for silent synapses: implications for the expression of LTP. Neuron. 1995;15:427–434. doi: 10.1016/0896-6273(95)90046-2. [DOI] [PubMed] [Google Scholar]
- Isope P, Barbour B. Properties of unitary granule cell–>Purkinje cell synapses in adult rat cerebellar slices. J Neurosci. 2002;22:9668–9678. doi: 10.1523/JNEUROSCI.22-22-09668.2002. [DOI] [PMC free article] [PubMed] [Google Scholar]
- Kaeser PS, Kwon HB, Blundell J, Chevaleyre V, Morishita W, Malenka RC, Powell CM, Castillo PE, Südhof TC. RIM1α phosphorylation at serine-413 by protein kinase A is not required for presynaptic long-term plasticity or learning. Proc Natl Acad Sci U S A. 2008;105:14680–14685. doi: 10.1073/pnas.0806679105. [DOI] [PMC free article] [PubMed] [Google Scholar]
- Kaneko M, Takahashi T. Presynaptic mechanism underlying cAMP-dependent synaptic potentiation. J Neurosci. 2004;24:5202–5208. doi: 10.1523/JNEUROSCI.0999-04.2004. [DOI] [PMC free article] [PubMed] [Google Scholar]
- Kerchner GA, Nicoll RA. Silent synapses and the emergence of a postsynaptic mechanism for LTP. Nat Rev Neurosci. 2008;9:813–825. doi: 10.1038/nrn2501. [DOI] [PMC free article] [PubMed] [Google Scholar]
- Kim JH, Udo H, Li HL, Youn TY, Chen M, Kandel ER, Bailey CH. Presynaptic activation of silent synapses and growth of new synapses contribute to intermediate and long-term facilitation in Aplysia. Neuron. 2003;40:151–165. doi: 10.1016/s0896-6273(03)00595-6. [DOI] [PubMed] [Google Scholar]
- Koester HJ, Sakmann B. Calcium dynamics associated with action potentials in single nerve terminals of pyramidal cells in layer 2/3 of the young rat neocortex. J Physiol. 2000;529:625–646. doi: 10.1111/j.1469-7793.2000.00625.x. [DOI] [PMC free article] [PubMed] [Google Scholar]
- Lagnado L, Gomis A, Job C. Continuous vesicle cycling in the synaptic terminal of retinal bipolar cells. Neuron. 1996;17:957–967. doi: 10.1016/s0896-6273(00)80226-3. [DOI] [PubMed] [Google Scholar]
- Linden DJ, Ahn S. Activation of presynaptic cAMP-dependent protein kinase is required for induction of cerebellar long-term potentiation. J Neurosci. 1999;19:10221–10227. doi: 10.1523/JNEUROSCI.19-23-10221.1999. [DOI] [PMC free article] [PubMed] [Google Scholar]
- Lonart G, Schoch S, Kaeser PS, Larkin CJ, Sudhof TC, Linden DJ. Phosphorylation of RIM1alpha by PKA triggers presynaptic long-term potentiation at cerebellar parallel fiber synapses. Cell. 2003;115:49–60. doi: 10.1016/s0092-8674(03)00727-x. [DOI] [PubMed] [Google Scholar]
- Ma L, Zablow L, Kandel ER, Siegelbaum SA. Cyclic AMP induces functional presynaptic boutons in hippocampal CA3-CA1 neuronal cultures. Nat Neurosci. 1999;2:24–30. doi: 10.1038/4525. [DOI] [PubMed] [Google Scholar]
- Malenka RC, Bear MF. LTP and LTD: an embarrassment of riches. Neuron. 2004;44:5–21. doi: 10.1016/j.neuron.2004.09.012. [DOI] [PubMed] [Google Scholar]
- Menegon A, Bonanomi D, Albertinazzi C, Lotti F, Ferrari G, Kao HT, Benfenati F, Baldelli P, Valtorta F. Protein kinase A-mediated synapsin I phosphorylation is a central modulator of Ca2+-dependent synaptic activity. J Neurosci. 2006;26:11670–11681. doi: 10.1523/JNEUROSCI.3321-06.2006. [DOI] [PMC free article] [PubMed] [Google Scholar]
- Moulder KL, Jiang X, Chang C, Taylor AA, Benz AM, Conti AC, Muglia LJ, Mennerick S. A specific role for Ca2+-dependent adenylyl cyclases in recovery from adaptive presynaptic silencing. J Neurosci. 2008;28:5159–5168. doi: 10.1523/JNEUROSCI.5317-07.2008. [DOI] [PMC free article] [PubMed] [Google Scholar]
- Nagy G, Reim K, Matti U, Brose N, Binz T, Rettig J, Neher E, Sorensen JB. Regulation of releasable vesicle pool sizes by protein kinase A-dependent phosphorylation of SNAP-25. Neuron. 2004;41:417–429. doi: 10.1016/s0896-6273(04)00038-8. [DOI] [PubMed] [Google Scholar]
- Neher E, Sakaba T. Multiple roles of calcium ions in the regulation of neurotransmitter release. Neuron. 2008;59:861–872. doi: 10.1016/j.neuron.2008.08.019. [DOI] [PubMed] [Google Scholar]
- Porrill J, Dean P. Silent synapses, LTP, and the indirect parallel-fibre pathway: computational consequences of optimal cerebellar noise-processing. PLoS Comput Biol. 2008;4:e1000085. doi: 10.1371/journal.pcbi.1000085. [DOI] [PMC free article] [PubMed] [Google Scholar]
- Sakaba T, Neher E. Preferential potentiation of fast-releasing synaptic vesicles by cAMP at the calyx of Held. Proc Natl Acad Sci U S A. 2001;98:331–336. doi: 10.1073/pnas.021541098. [DOI] [PMC free article] [PubMed] [Google Scholar]
- Salin PA, Malenka RC, Nicoll RA. Cyclic AMP mediates a presynaptic form of LTP at cerebellar parallel fiber synapses. Neuron. 1996;16:797–803. doi: 10.1016/s0896-6273(00)80099-9. [DOI] [PubMed] [Google Scholar]
- Shen W, Wu B, Zhang Z, Dou Y, Rao ZR, Chen YR, Duan S. Activity-induced rapid synaptic maturation mediated by presynaptic Cdc42 signaling. Neuron. 2006;50:401–414. doi: 10.1016/j.neuron.2006.03.017. [DOI] [PubMed] [Google Scholar]
- Spillane DM, Rosahl TW, Sudhof TC, Malenka RC. Long-term potentiation in mice lacking synapsins. Neuropharmacology. 1995;34:1573–1579. doi: 10.1016/0028-3908(95)00107-h. [DOI] [PubMed] [Google Scholar]
- Tan TC, Valova VA, Malladi CS, Graham ME, Berven LA, Jupp OJ, Hansra G, McClure SJ, Sarcevic B, Boadle RA, Larsen MR, Cousin MA, Robinson PJ. Cdk5 is essential for synaptic vesicle endocytosis. Nat Cell Biol. 2003;5:701–710. doi: 10.1038/ncb1020. [DOI] [PubMed] [Google Scholar]
- Tong G, Malenka RC, Nicoll RA. Long-term potentiation in cultures of single hippocampal granule cells: a presynaptic form of plasticity. Neuron. 1996;16:1147–1157. doi: 10.1016/s0896-6273(00)80141-5. [DOI] [PubMed] [Google Scholar]
- Trudeau LE, Emery D, Haydon P. Direct modulation of the secretory machinery underlies cAMP-dependent synaptic facilitation in hippocampal neurons. Neuron. 1996;17:789–797. doi: 10.1016/s0896-6273(00)80210-x. [DOI] [PubMed] [Google Scholar]
- Voronin LL, Cherubini E. ‘Deaf, mute and whispering’ silent synapses: their role in synaptic plasticity. J Physiol. 2004;557:3–12. doi: 10.1113/jphysiol.2003.058966. [DOI] [PMC free article] [PubMed] [Google Scholar]
- Wong W, Scott JD. AKAP signalling complexes: focal points in space and time. Nat Rev Mol Cell Biol. 2004;5:959–970. doi: 10.1038/nrm1527. [DOI] [PubMed] [Google Scholar]
- Yao J, Qi J, Chen G. Actin-dependent activation of presynaptic silent synapses contributes to long-term synaptic plasticity in developing hippocampal neurons. J Neurosci. 2006;26:8137–8147. doi: 10.1523/JNEUROSCI.1183-06.2006. [DOI] [PMC free article] [PubMed] [Google Scholar]
Associated Data
This section collects any data citations, data availability statements, or supplementary materials included in this article.