

Non-technical summary
Wasting and severely impaired function of skeletal muscle is frequently observed in critically ill intensive care unit (ICU) patients, with negative consequences for recovery and quality of life. An experimental rat ICU model has been used to study the mechanisms underlying this unique wasting condition in neuromuscularly blocked and mechanically ventilated animals at durations varying between 6 h and 2 weeks. The complete ‘mechanical silencing’ of skeletal muscle (removal of both weight bearing and activation) resulted in a specific myopathy frequently observed in ICU patients and characterized by a preferential loss of the motor protein myosin. A highly complex and coordinated protein synthesis and degradation system was observed in the time-resolved analyses. It is suggested the ‘mechanical silencing’ of skeletal muscle is a dominating factor triggering the specific myopathy associated with the ICU intervention, and strongly supporting the importance of interventions counteracting the complete unloading in ICU patients.
Abstract
Abstract
The muscle wasting and impaired muscle function in critically ill intensive care unit (ICU) patients delay recovery from the primary disease, and have debilitating consequences that can persist for years after hospital discharge. It is likely that, in addition to pernicious effects of the primary disease, the basic life support procedures of long-term ICU treatment contribute directly to the progressive impairment of muscle function. This study aims at improving our understanding of the mechanisms underlying muscle wasting in ICU patients by using a unique experimental rat ICU model where animals are mechanically ventilated, sedated and pharmacologically paralysed for duration varying between 6 h and 14 days. Results show that the ICU intervention induces a phenotype resembling the severe muscle wasting and paralysis associated with the acute quadriplegic myopathy (AQM) observed in ICU patients, i.e. a preferential loss of myosin, transcriptional down-regulation of myosin synthesis, muscle atrophy and a dramatic decrease in muscle fibre force generation capacity. Detailed analyses of protein degradation pathways show that the ubiquitin proteasome pathway is highly involved in this process. A sequential change in localisation of muscle-specific RING finger proteins 1/2 (MuRF1/2) observed during the experimental period is suggested to play an instrumental role in both transcriptional regulation and protein degradation. We propose that, for those critically ill patients who develop AQM, complete mechanical silencing, due to pharmacological paralysis or sedation, is a critical factor underlying the preferential loss of the molecular motor protein myosin that leads to impaired muscle function or persisting paralysis.
Introduction
The severe muscle wasting and impaired muscle function accompanying critical illness in intensive care unit (ICU) patients interfere with recovery from primary disease and weaning from the respirator. Several recent studies show unambiguously that neuromuscular dysfunction, resulting in muscle wasting and weakness, is the most debilitating problem for survivors of ICU treatment for years after hospital discharge (van Mook & Hulsewe-Evers, 2002; Herridge et al. 2003; Cheung et al. 2006). Accordingly, there is a great need for focused research on the mechanisms underlying ICU-induced muscle wasting and weakness (Hudson & Lee, 2003). Primary disease, sepsis and multiorgan failure undoubtedly contribute, but because similar patterns are seen with very different underlying diseases and pharmacological treatments, it is highly likely that the common components of the ICU regimen, i.e. muscle unloading, mechanical ventilation, sedation and bed rest, are key pathogenetic factors in the progressive impairment of muscle function during long-term ICU treatment.
MacFarlane & Rosenthal (1977) first reported a case of acute quadriplegia affecting spinal nerve-innervated muscles and with intact sensory, cognitive and craniofacial muscle function in a 24-year-old woman during treatment of status asthmaticus with mechanical ventilation, neuromuscular blocking agents (NMBA) and high systemic corticosteroid doses. This quadriplegia was considered a consequence of the modern practice of anaesthesiology and intensive care, and subsequent studies have shown that this quadriplegia is associated with a preferential myosin loss (Sher et al. 1979; Hirano et al. 1992). This complication of modern intensive care was originally given the name acute quadriplegic myopathy (AQM) and a number of different descriptive names have been given this disorder since then, such as critical illness myopathy, thick filament myosin myopathy, acute myopathy of severe asthma, myopathy of intensive care etc. (for references see Hirano et al. 1992; Lacomis et al. 2000). For many years, the AQM diagnosis was lumped together with muscle paralyses of neurogenic origin, such as the critical illness polyneuropathy and Guillain–Barré syndrome; however, AQM is a disorder of muscle, not nerve. The erroneous inclusion of AQM among neuropathies is, in part, due to misinterpretations of electroneurograpic and electromyographic recordings, which may mimic neurogenic lesions due to an altered muscle membrane excitability in AQM (Rich et al. 1995, 1996, 1997, 1998a,b;). In the clinical setting, AQM is still frequently lumped together with neuropathies, due to either co-existence between the two conditions or the use of diagnostic techniques with poor precision. While acute quadriplegia in the ICU was initially thought to be a rare event, we now know that neuromuscular dysfunction is found in up to 30% of the general ICU population and 70–80% of certain sub-groups (Leijten et al. 1995; Lacomis et al. 2000; De Jonghe et al. 2002; Friedrich et al. 2005). AQM is a potentially lethal complication that prolongs the recovery of critical care patients, increasing the median ICU treatment costs 3-fold (Rudis et al. 1996; Seneff et al. 2000). Additional substantial costs can accrue with the subsequent extended rehabilitation requirements and often years of drastically impaired quality of life.
The poor understanding of basic mechanisms underlying AQM in the clinical setting is in part due to the fact that basic distinctions between myopathy and neuropathy have often not been clearly made and the complex clinical, electrophysiological and histological abnormalities are often incompletely reported (Nates et al. 1997). The study of generalised muscle weakness in the ICU patients has been impeded by delays of several weeks in collection of muscle samples, as well as uncontrolled variables that can affect the development of muscle paralysis, such as very different primary diseases and pharmacological treatments. Given the difficulty of controlled clinical observation, there is a compelling need for an experimental animal model which mimics the basic ICU conditions of long-term mechanical ventilation, sedation and muscle unloading: i.e. absence of mechanical loading related to muscle contraction or weight bearing (mechanical silencing).
In this study, we have aimed to improve our understanding of the mechanisms underlying the muscle wasting in ICU patients with AQM, by conducting time-resolved analyses in a unique experimental rat ICU model that allows mechanical ventilation with pharmacological post-synaptic neuromuscular blockade for several weeks. In the presence of sedation, mechanical ventilation and NMB-induced total unloading, at durations varying from hours to 2 weeks, we have examined time-dependent changes in muscle mass and morphology, muscle fractional protein synthesis rate, intracellular signalling, myofibrillar gene and protein expression, as well as regulation of muscle contraction at the single fibre level. The results have been presented in abstract form elsewhere (Larsson, 2008a,b;).
Methods
Animals
A total of 15 sham-operated controls and 46 anaesthetized and mechanically ventilated female Sprague–Dawley rats treated with α-cobrotoxin for durations varying from 6 h to 14 days were included in this study. The experimental model has previously been described in detail (Dworkin & Dworkin, 1990, 2004). Briefly, all surgery and instrumentation was performed with sterile technique: (1) Precordial silver wire electrocardiogram (ECG) electrodes were implanted subcutaneously. (2) An aortic catheter (28-gauge Teflon) was inserted via the left carotid artery to record arterial blood pressure. (3) A 0.9 mm Renathane catheter was threaded into the left jugular vein to record venous blood pressure, and administer parental solutions. (4) Three subcutaneous EEG needle electrodes were placed into the skull above the right and left temporal lobes, and a third reference electrode was placed in the neck region. (5) Temperature was measured by a vaginal thermistor and servo-regulated at 37°C. (6) A silicone cannula was inserted in the urethra to continuously record urine output. Animals were maintained in protein and fluid balance, i.e. with (1) an intra-arterial solution (0.6 ml h−1) consisting of 50 ml H2O, 50 ml 0.5 n lactated Ringer solution, 1.25 g oxacillin sodium, 2.8 mg α-cobratoxin, 0.3 mg vitamin K (Synkavite) and 20 meq K+ (as KCl); and (2) an intra-venous solution (0.6 ml h−1) consisting of 50 ml H2O, 50 ml 0.5 n lactated Ringer solution, 20% glucose (Baxter, Deerfield, IL, USA) and 1.25 g oxacillin sodium for the initial 48 h, then 8.5% Travasol amino acid (Baxter) and 20% Intralipid (Kabi, Uppsala, Sweden) were added subsequently to provide necessary nutrients (Dworkin & Dworkin, 1990, 2004). The total caloric intake was calculated to be approximately 8 kcal per day. The sham-operated control animals underwent the same interventions as the controls, but they were not pharmacologically neuromuscularly blocked with α-cobratoxin. That is, sham-operated controls were anaesthetized (isoflurane), spontaneously breathing, given intra-arterial and intra-venous solutions, and killed within 2 h after the initial anaesthesia and surgery.
During surgery or any possible irritating manipulation, the anaesthetic isoflurane level was at >1.5%, which maintains the following states: (1) the electroencephalogram (EEG) was synchronized and dominated by high-voltage slow-wave activity; (2) mean arterial pressure at 100 mmHg and heart rate at 420 beats min−1; and (3) no evident EEG, blood pressure or heart rate responses to surgical manipulation. Isoflurane was delivered into the inspiratory gas stream by a precision mass-flow controller. After the initial surgery, Isoflurane was gradually lowered (over 1–2 days) and maintained at <0.5% during the remaining experimental period. Rats were ventilated through a coaxial tracheal cannula at 72 breaths min−1 with an inspiratory and expiratory ratio of 1:2, a minute volume of 180–200 ml and gas concentrations of 49.5% O2, 47% N2 and 3% CO2, delivered by a precision (volume drift <1% per week) volumetric respirator. Intermittent hyperinflations (6 per hour at 15 cmH2O), positive end-expiratory pressure (1.5 cmH2O), and expiratory CO2 monitoring were continuous. Neuromuscular block was induced on the first day (100 μg i.v.α-cobrotoxin) and maintained by continuous infusion (250 μg day−1, i.v.). Mechanical ventilation started immediately after the NMB induction. Experiments were terminated at durations varying between 6 h and 14 days. In no case did animals show any signs of infections or septicemia. The Institutional Animal Care and Use Committee at the Pennsylvania State University College of Medicine and the Ethical committee at Uppsala University approved all aspects of this study.
Muscles and muscle fibre membrane permeabilization
The tibialis anterior (TA), extensor digitorum longus (EDL), gastrocnemius and soleus muscles were dissected from the right leg immediately after killing. One half of the soleus and EDL muscles together with TA were quickly frozen in liquid propane cooled by liquid nitrogen, and stored at −160°C for further analyses. In the other halves of the soleus and EDL muscles, bundles of approximately 50 fibres were dissected from the muscles in relaxing solution at 4°C and tied to glass capillaries, stretched to about 110% of their resting slack length. The bundles were chemically skinned for 24 h in relaxing solution containing 50% (v/v) glycerol for 24 h at 4°C and were subsequently stored at −20°C (Larsson & Moss, 1993). All the bundles were cryo-protected within 1 week after skinning by transferring the bundles every 30 min to relax solution containing increasing concentrations of sucrose, i.e. 0, 0.5, 1.0, 1.5 and 2.0 m sucrose, and subsequently frozen in liquid propane chilled with liquid nitrogen (Frontera & Larsson, 1997). The frozen bundles were stored at −160°C pending use. One day before the experiments, a bundle was transferred to a 2.0 m sucrose solution for 30 min, subsequently incubated in solutions of decreasing sucrose concentration (1.5–0.5 m) and finally kept in a skinning solution at −20°C.
Single muscle fibre experimental procedure
On the day of an experiment, a fibre segment 1 to 2 mm long was left exposed to the experimental solution between connectors leading to a force transducer (model 400A, Aurora Scientific) and a lever arm system (model 308B, Aurora Scientific) (Moss, 1979). The apparatus was mounted on the stage of an inverted microscope (model IX70; Olympus). While the fibre segments were in relaxing solution, the sarcomere length was set to 2.65–2.75 μm by adjusting the overall segment length (Larsson & Moss, 1993). The diameter of the fibre segment between the connectors was measured through the microscope at a magnification of ×320 with an image analysis system prior to the mechanical experiments. Fibre depth was measured by recording the vertical displacement of the microscope nosepiece while focusing on the top and bottom surfaces of the fibre. The focusing control of the microscope was used as a micrometer. Fibre cross-sectional area (CSA) was calculated from the diameter and depth, assuming an elliptical circumference, and was corrected for the 20% swelling that is known to occur during skinning (Moss, 1979).
Relaxing and activating solutions contained (in mm) 4 Mg-ATP, 1 free Mg2+, 20 imidazole, 7 EGTA, 14.5 creatine phosphate and KCl to adjust the ionic strength to 180 mm. The pH was adjusted to 7.0. The concentrations of free Ca2+ were 10−9m (relaxing solution) and 10−6.2, 10−6.0, 10−5.8, 10−5.5, 10−5.2, 10−4.9 and 10−4.5m (activating solutions), expressed as pCas (i.e. −log [Ca2+]). Apparent stability constants for Ca2+-EGTA were corrected for temperature (15°C) and ionic strength (180 mm). The computer program of Fabiato (Fabiato, 1988) was used to calculate the concentrations of each metal, ligand and metal–ligand complex.
At 15°C, immediately preceding each activation, the fibre was immersed for 10–20 s in a solution with a reduced Ca2+-EGTA buffering capacity. This solution was identical to the relaxing solution except that the EGTA concentration was reduced to 0.5 mm, which results in more rapid attainment of steady-state force during subsequent activation. Maximum velocity of unloaded shortening (V0) was measured by the slack-test procedure (Edman, 1979). Fibres were activated at pCa 4.5 and once steady tension was reached, various amplitudes of slack (ΔL) were rapidly introduced (within 1–2 ms) at one end of the fibre. The time (Δt) required to take up the imposed slack was measured from the onset of the length step to the beginning of tension redevelopment. For each amplitude of ΔL, the fibre was re-extended while relaxed in order to minimize non-uniformity of sarcomere length. A straight line was fitted to a plot of ΔL vs.Δt, using a least-squares regression, and the slope of the line was recorded as V0 for that fibre. Maximum active tension (P0) was calculated as the difference between the total tension in the activating solution (pCa 4.5) and the resting tension measured in the same segment while in the relaxing solution. All contractile measurements were carried out at 15°C. The contractile recordings were accepted in subsequent analyses if a V0 value was based on linear regressions including four or more data points, and data were discarded if r for the fitted line was less than 0.97, if sarcomere length during isometric tension development changed by more than 0.10 μm compared with sarcomere length while the fibre was relaxed or if force changed more than 10% from first to final activation (Moss, 1979). Specific tension (ST) was calculated as maximum tension (P0) normalised to CSA.
Stiffness
Once steady-state isometric force was reached, small-amplitude sinusoidal changes in length (ΔL: ±0.2% of fibre length) were applied at 500 Hz at one end of the fibre (Martyn et al. 2007). The resultant force response (ΔF) was measured, and the mean of 20 consecutive readings of ΔL and ΔF was used to determine stiffness. The actual elastic modulus (E) was calculated as the difference between E in activating solutions and resting E measured in the same segment in the relaxing solution. E was determined as follows (McDonald & Fitts, 1995):
Relative force–pCa and stiffness–pCa relationships
Each fibre was exposed to different solutions with varying pCas (pCa 9.0–4.5). Force and stiffness were normalized to maximum force and stiffness at pCa 4.5 allowing the construction of relative force–pCa and relative stiffness–pCa curves. To determine the midpoint (termed pCa50) and the Hill coefficient (nH) from the pCa curves, data were fitted (SigmaPlot 5.0 and Origin 6.1 Professional software; Jandel Scientific) using the Hill equation in the following form:
X is the relative force or relative stiffness. −log[Ca50] is the midpoint (pCa50). nH is the Hill coefficient.
After the mechanical measurements, each fibre was placed in urea buffer (120 g urea, 38 g thiourea, 70 ml H2O, 25 g mixed bed resin, 2.89 g dithiothreitol, 1.51 g Trizma base, 7.5 g SDS, 0.004% bromophenol blue) in a plastic micro centrifuge tube and stored at −80°C for subsequent electrophoretic analyses.
Sodium dodecyl sulphate-polyacrylamide gel electrophoresis (SDS-PAGE)
The myosin heavy chain (MyHC) composition was determined by 6% SDS-PAGE. The total acrylamide and bis concentrations were 4% (w/v) in the stacking gel and 6% in the running gel, and the gel matrix included 30% glycerol. The ammonium persulphate concentrations were 0.04% and 0.029% in the stacking and separation gels, respectively, and the gel solutions were degassed (<100 mTorr) for 15 min at 18°C. Polymerisation was subsequently activated by adding TEMED (Bio-Rad Laboratories, Hercules, CA, USA) to the stacking (0.1%) and separation gels (0.07%). Sample loads were kept small to improve the resolution of the MyHC bands and electrophoresis was performed at 120 V for 22–24 h with a Tris–glycine electrode buffer (pH 8.3) at 10°C (SE 600 vertical slab gel unit, Hoefer Scientific Instruments, USA; for details see Larsson et al. 1993; Larsson & Moss, 1993).
Immunoblotting
SDS-PAGE was performed by using Mini-PROTEAN 3 Cell (Bio-Rad Laboratories, 2000 Alfred Nobel drive, Hercules, CA, USA). Five micrograms of total protein were loaded per lane on the stacking gel with 4% (w/v) acrylamide concentration and 12% in the running gel; the gel matrix included 10% glycerol. Electrophoresis was performed at 120 V for 90 min and the gels were immediately transferred to polyvinylidene fluoride (PVDF) membranes (GE Healthcare). Membranes were incubated with heat shock protein (HsP) 70 (SMC 100A/B, Stress Marq Biosciences Inc., BC, Canada), alpha B crystallin (SMC 159A/B, Stress Marq Biosciences Inc.), atrogin-1 (AP2041 ECM Biosciences, KY, USA), calpain-1 (no. 2556, Cell Signaling technology, MA, USA), anti-LC3B (L7543, Sigma-Aldrich, MO, USA), MuRF-1 (AF5366, R&D Systems, MN, USA) and actin (sc-1616, Santa Cruz Biotechnology Inc., CA, USA) primary antibodies. The membranes were incubated with secondary antibodies NXA931 or NA934 (GE Healthcare) or sc-2020 (Santa Cruz Biotechnology Inc.) and using ECL Advance Western blotting detection kit (RPN 2135, Amersham Biosciences) according to manufacturer's instructions. The immunoblots were subsequently scanned in a soft laser densitometer (Molecular Dynamics, Sunnyvale, CA, USA). The signal intensities were quantified using the volume integration function (see above) and normalised to actin content.
Total MyHC and actin content
Total protein content was determined from 10 μm EDL and soleus muscle cross-sections dissolved in 100 μl 8 m urea buffer after centrifugation and heating (90°C for 2 min), using the NanoOrange Protein Quantification Kit (Invitrogen, Carlsbad, CA, USA). The fluorescence of the samples was measured using a Plate Chameleon Multilabel Platereader (Hidex Oy, Finland) and the software MikroWin2000, version 4.33 (Microtek Laborsysteme GmbH, Overath, Germany). The fluorescence of the samples was related to a standard curve of bovine serum albumin (Invitrogen) at concentrations ranging from 0.1 μg ml−1 to 10 μg ml−1.
Actin and myosin quantification was determined by 12% SDS-PAGE. The acrylamide concentration was 4% (w/v) in the stacking gel and 12% in the running gel, and the gel matrix included 10% glycerol. Samples of 5 μl were loaded together with 5 μl of the standard dilutions. The standard was prepared by pooling sections from EDL and soleus muscles from control rats. The myofibrillar protein standards were prepared, assuming that actin and myosin contents were 12.5 and 25% of the total protein content, respectively. Linear actin and myosin curves were observed within the 5–200 μg ml−1 range, but the calibration curves were not parallel.
Electrophoresis was performed at 32.0 mA for 5 h with a Tris–glycine electrode buffer (pH 8.3) at 15°C (SE 600 vertical slab gel unit; Hoefer Scientific Instruments). The gels were stained using SimplyBlue SafeStain (Invitrogen) and subsequently scanned in a soft laser densitometer (Molecular Dynamics, Sunnyvale, CA, USA) with a high spatial resolution (50 μm pixel spacing) and 4096 optical density levels. The volume integration function was used to quantify the amount of protein on 12% and 6% gels (ImageQuant TL Software v. version 3.3, Amersham Biosciences, Uppsala, Sweden).
Fractional protein synthesis rate measurements using [ring-13C6]phenylalanine as tracer
An intravenous bolus dose of [ring-13C6]phenylalanine (15 μg (g body weight)−1) was given 15 min prior to killing. Immediately after killing, the gastrocnemius muscle was removed from the left hindlimb and split into a deep red and superficial white portion and frozen in liquid propane chilled by liquid nitrogen. Tissue fluid and mixed gastrocnemius muscle proteins (MMPs) were isolated according to the method of Ljungqvist et al. (1997). The mixed muscle protein precipitate from the isolation was hydrolysed by heating with 6 m HCl overnight at 110°C. Both tissue fluid and hydrolysed MMP amino acids were purified using a Biorad AG-50x8 ion exchange resin prior to mass spectrophotometry analysis.
Tissue fluid
The level of enrichment of [ring-13C6] phenylalanine in tissue fluid was analysed using a ThermoFisher quantum gas chromatography tandem mass spectrometry (GC/MS/MS) (San Jose, CA, USA). The heptafluorobutyryl isobutyl ester derivative was prepared as described by Ford et al. (1985) and the amino acids measured under negative ion chemical ionisation conditions using isobutane as reactant gas. The [M-HF]− fragments reflecting the m0 and m+6 species were monitored (m/z transitions 397→377 and 403→383, respectively) and the enrichment of the label measured against a calibration curve prepared from known amounts labelled and unlabelled phenylalanine (range 0–30%).
MMP
The level of enrichment of [ring-13C6] phenylalanine derived from hydrolysed MMP was analysed using a ThermoFisher DeltaPlus isotope ratio mass spectrometer (IR-MS) (Bremen, Germany) fitted with an on-line gas chromatograph with oxidation and reduction furnaces as previously described (Balagopal et al. 1996). The amino acids were derivatized to their trimethyl acetyl, methyl esters according to the method of Metges et al. (1996). Any amino acid eluting from the gas chromatograph is converted to CO2 and N2 prior to entry into the IR-MS. The enrichment of the tracer was measured by monitoring the ratio of 13C to 12CO2 in the IR-MS and again referenced to a calibration curve (0–0.1%).
Enzyme-histochemistry and immunocytochemistry
Frozen samples from the soleus and EDL muscles were cut perpendicular to the longitudinal axis of the muscle fibres into 10 μm cross-sections with a cryotome (2800 Frigocut E, Reichert-Jung GmbH, Heidelberg, Germany) at −20°C. In the EDL, the myofibrillar ATPase staining was performed after alkaline and acid pre-incubations (for references see Edstrom & Larsson, 1987). The fibres were classified according to the pH sensitivity of the myofibrillar ATPase, type I ATPase fibres being those with acid-stable ATPase (after pre-incubation at pH 4.35) and alkali-labile ATPase (after pre-incubation at pH 10.3), and type II ATPase fibres those showing the reverse pH sensitivity (Dubowitz, 1985). In the soleus, sections were stained for myofibrillar ATPase after 55 min of formaldehyde fixation at 4°C (Hayashi & Freiman, 1966). Cross-sectional areas, roundness and the smaller diameter were measured in a total of 100 fibres in the central region of soleus and EDL cross-sections using an inverted microscope (Zeiss Axiovert 40 CFL, Zeiss, Jena, Germany) and an image analysis system (C-Imaging systems, Compix Inc., Cranberry Township, PA, USA). Subcellular localisation of MuRF proteins, p62/SQSTM1 and serum response factor (SRF) were performed essentially as described (Lange et al. 2005). Cryostections (10 μm) of gastrocnemius muscle were fixed for 10 min at room temperature with 4% paraformaldehyde in Hepes-buffered saline and 2 mm MgCl2. Following fixation, paraformaldehyde was quenched with 10 mm ammonium chloride in phosphate-buffered saline (PBS), and sections were permeabilised with 1% Triton in PBS. First antibodies were: goat-anti MuRF1 or -2 (Abcam, UK), MuRF2-specific rabbit polyclonal antibodies (Pizon et al. 2002), mouse monoclonal p62 (Abcam, UK) and rabbit anti-SRF (Santa Cruz biotechnology Inc., CA, USA). Secondary antibody conjugates were from Jackson ImmunoResearch, USA.
All samples were stained with identical primary and secondary antibody dilutions and imaged on a Zeiss LSM510 Meta confocal microscope using a 63× oil-immersion objective, and 2× zoom. The same gain settings were used for all analyses.
Quantitative real-time RT-PCR
Real-time PCR was used to quantify the mRNA levels for rat MyHCs (IIa, IIx and IIb), skeletal α-actin, MAFbx/atrogin-1, MuRF-1, calpain-1 and Map1lc3b (microtubule-associated protein 1 light chain 3 beta) (GenBank accession numbers X15939, L13606, AF157005, L24897, NM_019212, AY059628, AY059627, NM_019152 and AY206669, respectively) in frozen gastrocnemius muscle (proximal part) tissue.
RNA purification, cDNA synthesis and quantitative PCR analysis was performed as previously described (Norman et al. 2006a). Briefly, total RNA (100 ng) was reverse transcribed to cDNA using Qscript cDNA supermix (Quanta Biosciences, USA). cDNA was amplified in triplicate using MyiQ single colour real-time PCR detection system (Bio-Rad Laboratories, Inc., Hercules, CA, USA). The thermal cycling conditions include 95°C for 10 min, followed by 50 cycles of a two-step PCR with denaturation at 95°C for 15 s and a combined annealing and extension step at 60°C for 1 min. Each reaction was performed in a 25 μl volume with 0.4 μm of each primer and 0.2 μm probe. When optimising each PCR, the PCR products were run on 2% agarose gels to ensure that primer–dimer formation was not occurring. Taqman primers and probes were designed using the software Primer Express (Applied Biosystems, Foster City, CA, USA). Primer sequences for rat myosin heavy chain isoforms, actin, atrogin-1 and MuRF-1 were published elsewhere (Nordquist et al. 2007). The primer sequences for calpain-1 were: forward-CCTGGATGGTGTTGTGAC, reverse- TTCATAGGGGTCCACTTT, amplicon size 109 bp and for LC3b: forward-CTCATCCGGGAGCAGCAT, reverse-CTCACCCTTGTATCGCTCTATAATCA, amplicon size 60 bp. Probes labelled with FAM (N-(3 fluoranthyl)maleimide) and primers were purchased from Thermo Electron (Ulm, Germany). All primers and probes were purified by high-performance liquid chromatography.
Threshold cycle (CT) data obtained from running real-time RT-PCR was related to a standard curve to obtain the starting quantity (SQ) of the template cDNA, and the values were normalized against 18S rRNA (GenBank accession number AF102857).
Statistics
Means and standard errors of the means were calculated according to standard procedures. One- and two-way analyses of variance (ANOVA) and the Tukey post hoc test were used when comparing multiple groups and P < 0.05 was considered statistically significant.
Results
Body and muscle weights
Body weight remained stable during the initial 4 days of the experiment, but decreased linearly in response to NMB for 5 days or longer. After 2 weeks, body weight had decreased by more than 30% compared with the baseline weight (Fig. 1, Table 1). The average body weight of the rats prior to NMB varied between 237 and 394 g (306 ± 4 g), but there was no relation between body weight at the start of the experiment and NMB duration (Fig. 1, inset). Animals were divided into controls and those treated with NMB, muscle unloading and mechanical ventilation for durations between 0.25–4, 5–8 and 9–14 days. The weight of the fast-twitch tibialis anterior and EDL, the mixed gastrocnemius and the slow-twitch soleus muscle decreased in parallel with the body weight. The muscle to body weight ratios did not differ between controls and rats exposed to NMB for durations varying between 6 h and 14 days, indicating that the loss in body weight was related to muscle wasting and was independent of muscle type (Table 1).
Figure 1. Relative change in body weight (%) in response to muscle unloading, mechanical ventilation and post-synaptic block of neuromuscular transmission.

The body weight of the animals at the start of the experiment is shown in the inset.
Table 1.
Body and muscle weight in controls and animals exposed to muscle unloading, NMB and mechanical ventilation for durations varying between 0.25–4, 5–8, 9–13 and 14–21 days
| Controls1 (n = 15) | 0.25–4 days2 (n = 21) | 5–8 days3 (n = 10) | 9–14 days4 (n = 16) | P | |
|---|---|---|---|---|---|
| Body weight (g) | 309 ± 63,4 | 307 ± 43,4 | 249 ± 161,2 | 211 ± 101,2 | <0.001 |
| Soleus (mg) | 124 ± 54 | 115 ± 44 | 104 ± 15 | 80 ± 111,2 | <0.001 |
| Soleus:body weight (%) | 0.040 ± 0.002 | 0.038 ± 0.001 | 0.040 ± 0.008 | 0.037 ± 0.004 | n.s. |
| EDL (mg) | 145 ± 43,4 | 133 ± 43,4 | 101 ± 101,2 | 76 ± 101,2 | <0.001 |
| EDL:body weight (%) | 0.046 ± 0.001 | 0.043 ± 0.001 | 0.041 ± 0.003 | 0.038 ± 0.005 | n.s. |
| Tibialis anterior (mg) | 568 ± 124 | 520 ± 104 | 507 ± 524 | 364 ± 601−3 | <0.001 |
| TA:body weight (%) | 0.183 ± 0.005 | 0.169 ± 0.003 | 0.22 ± 0.004 | 0.168 ± 0.002 | n.s. |
| Gastrocnemius (mg) | 1,670 ± 4003,4 | 1,590 ± 2203,4 | 1,160 ± 4901,2 | 1,010 ± 1401,2 | <0.001 |
| Gast:body weight (%) | 0.52 ± 0.01 | 0.51 ± 0.01 | 0.40 ± 0.004 | 0.46 ± 0.09 | n.s. |
The level of statistical difference between groups according to one-way ANOVA as well as intergroup differences are shown. Values are means ± SEM. n.s., not significant.
Enzyme-histochemistry and muscle morphology
Muscle fibres were separated into types I, IIA, IIB and IIC based on enzyme-histochemical mATPase staining pattern after alkaline and acid pre-incubations. There were no significant differences in muscle fibre cross-sectional area (CSA) between control rats and those mechanically ventilated between 0.25 and 4 days in either the slow-twitch soleus or the fast-twitch EDL (Table 2). At NMB durations longer than 5 days, the mATPase staining intensity became fainter and the clear distinction between fibre types was blurred, reducing the number of muscle fibres that could be reliably distinguished into specific fibre types in both the soleus and EDL. The myofibrillar ATPase staining after formaldehyde incubation of soleus sections appeared to be especially influenced by this effect, and muscle fibre types could only be reliably identified in two soleus muscles at NMB durations longer than 4 days. In the EDL, muscle fibres could be separated into distinct types in 12 muscles at NMB durations longer than 4 days and the CSA decreased (P < 0.05) by 46, 35 and 24% in type I, IIA and IIB fibres, respectively, after 5–14 days of NMB compared with controls and rats exposed to NMB for durations varying between 0.25 and 4 days. Due to the reduction of the clear distinction between muscle fibre types at longer durations, CSA was measured in 100 muscle fibres independent of enzyme-histochemical staining in the central region of the cross-sections from all soleus and EDL muscles. A significant and progressive decline in both muscle fibre area and fibre diameter (P < 0.001) were observed in both soleus and EDL fibres (Table 2). Muscle fibres typically acquire an angular appearance in response to peripheral denervation, but there was no difference in roundness among soleus and EDL fibres in any of the groups, i.e. the roundness factor varied between 0.64 and 0.71 in the soleus and between 0.68 and 0.71 in the EDL fibres independent on the length of the duration of NMB.
Table 2.
Average cross-sectional area CSA and smaller fibre diameter of enzyme-histochemically mATPase stained EDL and soleus muscle cross-sections in animals exposed to muscle unloading, NMB and mechanical ventilation for durations varying between 0 (controls), 0.25–4, 5–8, 9–13 and 14–21 days
| Controls1 (n = 13) | 0.25–4 days2 (n = 24) | 5–8 days3 (n = 8) | 9–14 days4 (n = 16) | P | |
|---|---|---|---|---|---|
| EDL (CSA, μm2) | 1960 ± 2404 | 1570 ± 704 | 1455 ± 1904 | 1180 ± 1001,2,3 | <0.01 |
| EDL (diametre, μm) | 46 ± 34 | 41 ± 14 | 38 ± 34 | 34 ± 21,2,3 | <0.001 |
| Soleus (CSA, μm2) | 2370 ± 1803,4 | 2270 ± 803,4 | 1370 ± 2101,2 | 1170 ± 901,2 | <0.001 |
| Soleus (diametre, μm) | 51 ± 23,4 | 49 ± 13,4 | 37 ± 31,2 | 34 ± 11,2 | <0.001 |
The level of statistical difference between groups according to one-way ANOVA as well as intergroup differences are shown. Values are means ± SEM.
Regulation of muscle contraction
Regulation of muscle contraction was studied to document the physiological effects of altered transcriptional regulation, protein expression and muscle structure. To analyse the function of myofilament proteins in cells with an intact filament lattice, but without the confounding effects of intercellular connective tissue or protein heterogeneity of whole muscle or multicellular preparations, we measured the force generation capacity of single fibres. A total of 232 muscle fibres fulfilled the strict criteria for acceptance (see Methods) and were analysed; 128 soleus fibres expressing the type I MyHC isoform and 104 EDL fibres expressing IIx or IIb MyHC isoforms were included. The CSA measured at a defined sarcomere length in individual single muscle fibres decreased progressively in response to NMB and muscle unloading at durations of 5 days and longer, irrespective of MyHC isoform expression according to one-way ANOVA (P < 0.001, Fig. 2A). In contrast to enzyme-histochemistry, muscle fibres could be separated into specific types based on MyHC isoform expression at all time-points due to the higher sensitivity of the silver-stained SDS-PAGE, in accordance with previous observations in ICU patients with AQM (Larsson et al. 2000; Norman et al. 2009).
Figure 2. Single muscle fibre cross-sectional area.
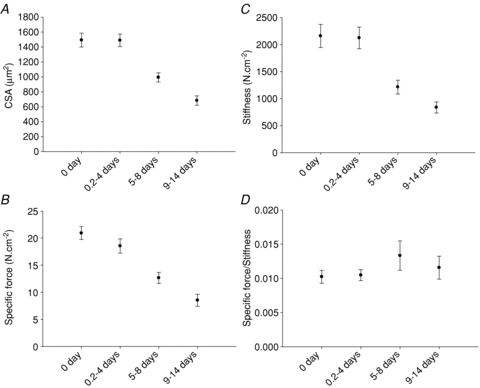
Single muscle fibre cross-sectional area measured at a fixed sarcomere length (A), specific force (B), stiffness (C) and specific force/stiffness ratio (D) in control animals and animals exposed to NMB, muscle unloading and mechanical ventilation for durations varying between 0.25–4, 5–8 and 9–14 days. Values are means ± SEM.
Maximum force normalized to muscle fibre cross-sectional area (specific force) and stiffness did not differ between soleus fibres expressing the type I MyHC isoform or EDL fibres expressing the IIx or IIb MyHC isoform at any of the different durations and have therefore been pooled. Both specific force and stiffness were similar in the control and 0.25–4 day groups, but decreased significantly at longer NMB durations (Fig. 2B and C). Stiffness is dependent on the number of attached cross-bridges, force/compliance of each cross-bridge and compliance of the structures in series with the cross-bridges (Higuchi et al. 1995, Seow et al. 1997, Galler & Hilber, 1998). The strong linear relationship between stiffness and force irrespective of whether fibres were from controls or from rats exposed to 2 weeks of NMB (not shown) underscores that stiffness is primarily dependent on the number of attached cross-bridges (Regnier et al. 2004). The subsequent specific force:stiffness ratio may, therefore, be closely related to the force/compliance of each cross-bridge (McDonald & Fitts, 1995). The unchanged specific force:stiffness ratios for all the groups, suggest that the force/compliance of each cross-bridge was preserved and the decreased specific force was primarily due to a reduced number of force-generating cross-bridges (Fig. 2D). This is consistent with the biochemical analyses demonstrating a preferential loss of the motor protein myosin at durations longer than 4 days (see below). A strong linear relationship was also observed between specific force and the myosin:actin ratio in muscle fibres expressing the type IIb (r2= 0.81; P < 0.001) and IIx (r2= 0.40; P < 0.01) MyHC isoforms. In soleus muscle fibres expressing the type I MyHC isoform, on the other hand, this relationship was weak and not statistically significant. The exact mechanism underlying the muscle fibre type-specific differences in this relationship is not known, but may be related to fibre type-specific differences in total amount of contractile proteins in individual muscle fibres or in intrinsic force-generating properties of specific myosin isoforms. Recent results from our group give support to the latter mechanisms, as the force-generating capacity of specific myosin isoforms extracted from single muscle fibre segments show larger variability among slow than fast myosin isoforms, presumably due to isoform-specific differences in post-translational modifications affecting protein function (Li & Larsson, 2010).
In accordance with previous studies, maximum velocity of unloaded shortening was highly dependent on MyHC isoform expression, following the gradient I < IIx < IIb. In muscle fibres expressing the type I MyHC isoform, no significant difference in V0 was observed in response to the NMB duration (Fig. 3). In these rats, V0 values were slightly lower than in our previous studies in age- and gender-matched rats, but different rat strains were used in the earlier studies (Yu et al. 1999).
Figure 3. Maximum velocity of unloaded shortening.

Maximum velocity of unloaded shortening (V0, Muscle Lengths per second, ML . s−1) in muscle fibres expressing the type I, IIx or IIb MyHC isoform in control animals and animals exposed to NMB, muscle unloading and mechanical ventilation for 0 days (controls, black), 0.25–4 days (diagonally striped), 5–8 days (white), and 9–14 days (horizontally striped). Values are means + SEM.
All results presented above were obtained in maximally Ca2+-activated muscle fibres. Under in vivo conditions skeletal muscles are activated at sub-maximal concentrations. The ability of the contractile apparatus to respond to sub-maximal Ca2+ levels was therefore evaluated as force–pCa and stiffness–pCa relationships, and the pCa required to elicit half-maximal force production (pCa50 or Ca2+ sensitivity). In line with former experiments, data were MyHC isoform dependent, and consequently not pooled (Fig. 4). A significant desensitisation of force production to Ca2+ concentration was observed, as indicated by the reduced pCa50 of force for durations longer than 9 days for type I and IIx MyHCs (Fig. 4A). To investigate whether this feature was due to a change in the number of strongly attached cross-bridges, the stiffness–pCa relationship was studied (Fig. 4B). A lower pCa50 of stiffness was observed for durations longer than 9 days for type I and IIx MyHCs, indicating a decrease in the relative number of recruited cross-bridges at each sub-maximal Ca2+ concentration. In a previous experiment, a similar pattern was found in limb muscle fibres with a preferential loss of myosin in ICU patients with AQM (Ochala & Larsson, 2008).
Figure 4. Ca2+ sensitivity of force and sensitivity of stiffness.

Ca2+ sensitivity of force (pCa50) and Ca2+ sensitivity of stiffness in response to different durations of NMB, muscle unloading and mechanical ventilation in muscle fibres expressing the type I (open circles), IIx (grey circles) and IIb (black circles) MyHC isoforms. Values are means ± SEM.
Protein synthesis rate
Fractional protein synthesis rate (FSR) was measured in the medial and lateral deep oxidative and the superficial glycolytic region of the gastrocnemius muscle in a sub-sample of 13 experimental and 8 control animals exposed to the ICU condition at durations varying between 0 h and 14 days. There was no significant difference in FSR between the medial and lateral portions of the gastrocnemius muscle independent of depth, but FSR was significantly higher in the deep than in the superficial portions. Therefore, FSR data from medial and lateral portions of the gastrocnemius muscle have been pooled, but analysed separately according to depth. Protein synthesis rates were higher (P < 0.001) in the deep oxidative than in the superficial glycolytic regions of the gastrocnemius muscle, independent of the duration of the immobilization (two-way ANOVA). Further, a significant increase in synthesis rate was observed after 9–14 days of exposure to the ICU intervention compared with controls and 0.25–4 days in both the deep oxidative (P < 0.05) and superficial (P < 0.01) glycolytic regions of the muscle according to two-way ANOVA; however, there was no significant difference between the control and 0.25–4 days of the ICU intervention (Fig. 5).
Figure 5. Fractional protein synthesis rate.

Fractional protein synthesis rate in the superficial (open circles) and deep (filled circles) part of the gastrocnemius muscle in response to the different of the ICU intervention.
Myosin and actin mRNA and protein expression
Prolonged mechanical ventilation, NMB and muscle unloading had a significant effect on MyHC and actin mRNA expression. The dominating MyHC isoforms in the gastrocnemius muscle (types IIa, IIx and IIb) and actin showed similar changes in mRNA levels in response to prolonged exposure to the intervention. That is, myosin and actin mRNA expression did not differ between controls and the 0.25–4 day group, but declined significantly (one-way ANOVA, P < 0.001) at the longer durations (Fig. 6).
Figure 6. Actin and MyHC mRNA expression.

Actin (black), MyHC type IIx (diagonally striped), IIb (white) and IIa (horizontally striped) mRNA expression in the gastrocnemius muscle from control animals and animals exposed to NMB, sedation, muscle unloading and mechanical ventilation for 0.25–4, 5–8 and 9–14 days. Values are means + SEM. **P < 0.001 (significant difference compared with controls), ##P < 0.001 (significant difference compared with 0.25–4 days group).
Myofibrillar proteins in soleus and EDL muscles were separated and quantified together with myosin and actin standards. Loading was controlled on Coomassie-stained 12% SDS-PAGE and normalised to total protein content. There was no difference in myosin content between control animals and the 0.25–4 day group, but both the control animals and the 0.25–4 day group had higher myosin contents normalised to total protein content than the 5–8 and 9–14 day groups (one-way ANOVA, P < 0.001, Fig. 7). In soleus, the actin content normalised to total protein content did not differ between the control, 0.25–4, 5–8 and 9–14 day groups. In the EDL, there was a slightly lower (one-way ANOVA, P < 0.05, Fig. 7) actin content in the 9–14 day group compared with the 0.25–4 day group, but this result is probably spurious because there was no difference compared with controls or the 5–8 day group (Fig. 7). Thus, there was a preferential myosin loss, resulting in decreased myosin:actin ratios in both soleus and EDL at durations of 5 days and longer (one-way ANOVA, P < 0.001), but no significant differences between controls and animals mechanically ventilated 0.25 to 4 days (Fig. 7). The progressive and preferential loss of myosin at longer durations is likely to be the dominating cause underlying the loss of the clear distinction between enzyme-histochemically classified muscle fibre types and subtypes described above. Further, actin protein content was relatively stable at the different observation periods in this study and was therefore chosen as the internal standard in the immunoblots.
Figure 7. Myosin and actin contents.

Myosin (filled) and actin (white) contents normalized to total protein content in the EDL (A), and the soleus (B). Myosin:actin ratios (C) in soleus (open circles) and EDL (filled circles) muscle cross-sections in control and mechanically ventilated animals. Values are means + SEM.
Proteolytic pathways and chaperones, protein and mRNA expression
The three major protein degradation mechanisms implicated in skeletal muscle loss and atrophy: (1) the ubiquitin proteasome pathway, (2) the autophagy lysosomal pathway, and (3) the calcium-activated proteases or calpains, were investigated at the mRNA and protein levels in the gastrocnemius muscle and at the protein level in the EDL (identical changes were observed at the protein level in gastrocnemius and EDL muscles). An up-regulation of the ubiquitin ligases MAFbx/atrogin-1 and MuRF1 was observed in the 0.25–4 day and 5–8 day groups compared with control values (one-way ANOVA, P < 0.05), although the 9–14 day group did not differ significantly from controls. For calpain-1, no statistically significant difference was found between the groups. At the LC3b mRNA level, a significant up-regulation (one-way ANOVA, P < 0.05) was restricted to the 0.25–4 day group compared with controls (Fig. 8).
Figure 8. MAFbx/atrogin-1, MuRF1, calpain-1 and LC3b mRNA expression.
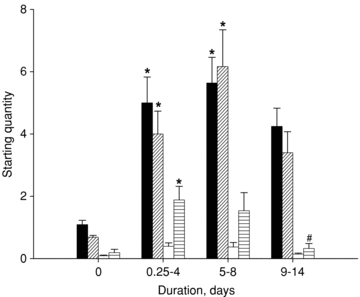
MAFbx/atrogin-1 (black), MuRF1 (diagonally striped), calpain-1 (white) and LC3b (horizontally striped) mRNA expression in the gastrocnemius muscle from control animals and animals exposed to NMB, sedation, muscle unloading and mechanical ventilation for 0.25–4, 5–8 and 9–14 days. Values are means + SEM. *P < 0.05 (significant difference compared with controls), #P < 0.05 (significant difference compared with 0.25–4 days group).
At the protein level, there was no significant difference in atrogin-1 content between the different groups (Fig. 9). MuRF 1 content, on the other hand, increased (one-way ANOVA, P < 0.01) at longer durations, whereas MuRF2 did not quantitatively differ between the groups. However, MuRF2 showed up-regulation of the MuRF2-p50 isoform, leading to a shift of the p60–p50 isoform ratio.
Figure 9. Western blot analyses.
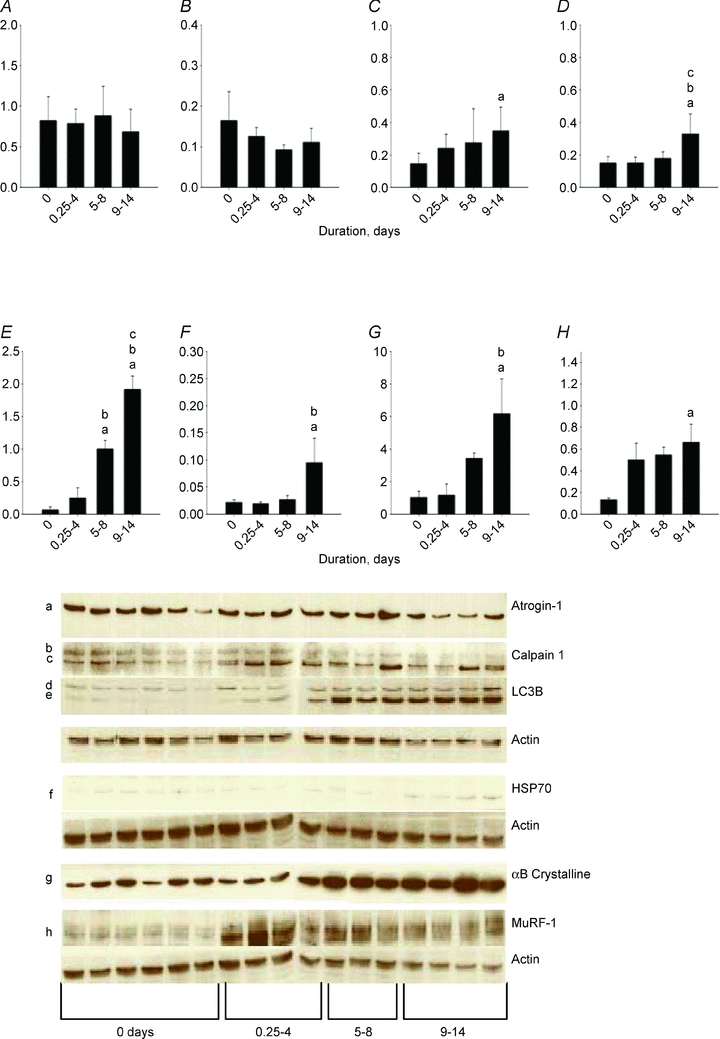
Western blot analyses of atrogin-1 (A), 80 kDa calpain-1 (B), 75 kDa calpain (C), 18 kDa LC3 (D), 16 kDa LC3 (E), HsP70 (F), αB-crystalline (G) and MuRF1 (H) normalized to actin contents in controls (0 days) and rats exposed to post-synaptic block of neuromuscular transmission, sedation and mechanical ventilation for durations varying between 0.25–4, 5–8 and 9–14 days. Values are means + SEM.
There was no significant change in the 80 kDa procalpain-1 content, but an increase (one-way ANOVA, P < 0.05) in the content of the 75 kDa active calpain-1 at the longest duration compared with controls (Fig. 9). The autophagosome component microtubule-associated light chain 3-I (LC3-I) is converted to LC3-II and this LC3 conversion is frequently used as an autophagy marker (Kabeya et al. 2000). A significant activation of the lysosomal autophagy pathway is supported by the progressive increase (one-way ANOVA, P < 0.001) of the 16 kDa LC3B content, with higher protein contents in the 9–14 day group than in all other groups and higher protein levels in the 5–8 day group than in controls and the 0.25–4 day group (Fig. 9). According to one-way ANOVA, a higher (P < 0.001) 18 kDa LC3B content was observed in the 9–14 day group than in the other groups, but this increase was more modest than the increase in the 16 kDa LC3B content (Fig. 9).
The HsP70 (P < 0.05) and αB-crystalline (P < 0.01) protein chaperones were significantly increased by the intervention, i.e. higher protein contents were observed in the 9–14 day group than in controls and the 0.25–4 day group according to one-way ANOVA (Fig. 9).
Biphasic translocation of MuRFs during immobilization
We suspected that atrophy-related factors might contribute to the transcriptional changes induced by pharmacological unloading. MuRF1 and -2 interact with the serum response factor and repress SRF-mediated gene expression when translocated to the nucleus (Lange et al. 2005; Willis et al. 2007), while MuRF3 was the first MuRF isogene identified by its interaction with SRF (Spencer et al. 2000); its actions on SRF are currently unknown. Using immunofluorescence confocal microscopy analysis of gastrocnemius muscle cryosections, we therefore investigated the intracellular localisation of MuRF1 and MuRF2, and the MuRF-ligand p62/SQSTM1. MuRF1/2 were found in the cytoplasm of control fibres (Figs. 10 and 11A) but were localised to the nucleus after 4 days, where it was detectable up to about 9 days, at which time a perinuclear localisation became obvious (Fig. 10). There was no discernable difference in the time course of nuclear localization for the two MuRF isogenes studied; for further analysis of MuRF partner localisation, we therefore studied MuRF2.
Figure 10. Cross-sections of rat gastrocnemius muscle.

Cross-sections of rat gastrocnemius muscle stained for the MuRF1 (red) or MuRF2 (green) and DAPI (blue). In control muscles, both MuRF1 and -2 are localised to the cytoplasm, and nuclear localisation is not prominent (arrowheads). ICU conditions induce strong nuclear translocation of both MuRFs that persists up to 9 days. At this stage, MuRFs are colocalising in the nucleus (arrowheads) but also accumulate in a perinuclear area in the cytoplasm (arrows). Scale bars, 10 μm. The overlay image for each row is shown at the left. All sections stained simultaneously and images recorded with identical gain settings. See Methods for details.
Figure 11. Cross-sections of rat gastrocnemius muscle.

Cross-sections of rat gastrocnemius muscle stained for the MuRF2 (red), p62/SQSTM1 (green), SRF (blue) and DAPI (not shown in overlay image at left). In control muscles (A), both MuRF2 and p62 are localised to the cytoplasm, while SRF is nuclear (arrowheads). B, nuclear localisation of MuRF2 and p62 is prominent after 4 days of ICU conditions (arrowheads), where both proteins now colocalise with SRF. C, after 14 days, both MuRF2 and p62 are found in the cytoplasm with perinuclear accumulation (arrows), where they colocalise with SRF. The nuclear SRF pool is strongly depleted (arrowheads). Note the increased p62 stain, and the marked cytoplasmic signal for SRF (asterisk) at 14 days. Scale bars, 10 μm. All sections stained simultaneously and images recorded with identical gain settings. See Methods for details.
At day 4, MuRF2 was consistently found in the nucleus (Fig. 11B) in more than 90% of all fibres, and with no difference between fast or slow fibres or depth of the section. At this stage, there was no apparent change in SRF localization, and Western blots revealed no change in total SRF content (Supplemental Fig. 1). However, a dramatic remodelling of the myonuclei, i.e. enlarged and rounded, was observed after 9 and 14 days (Figs 10 and 11). After 9 days and persisting up to the longest studied time-point at 14 days, MuRF2, p62 and SRF were localised to the cytoplasm, with distinct perinuclear accumulation (Fig. 11C). SRF showed strongly reduced nuclear localisation, and co-localised with the perinuclear MuRF2 and p62. There was also a markedly increased general cytoplasmic staining pattern for SRF, while total SRF levels were not markedly changed (Supplemental Fig. 1). Cytoplasmic p62 staining was also enhanced, in agreement with the known role of this multifunctional adapter in autophagy (Sandri, 2008).
In summary, these results suggest a sequential change in localization of MuRF1/2 and p62, which are localized from the cytoplasm to the myonuclei in the first 4 days, and are later localized to the cytoplasm, where they co-localise with cytoplasmic SRF in the perinuclear space.
Discussion
The present results show that the mechanical silencing associated with the ICU condition in itself causes the severe muscle wasting, paralysis, and partial or complete loss of the molecular motor protein myosin typically associated with the AQM in ICU patients. The mechanical silencing is proposed as the primary triggering mechanism underlying AQM, while sepsis and corticosteroids may synergistically promote protein degradation and inhibition of protein synthesis.
Experimental model
The severe muscle wasting in ICU patients is associated with an intact motoneuron and a complete loss of mechanical loading, i.e. lack of membrane depolarisation/muscle contraction and weight bearing due to pharmacological neuromuscular blockade or deep sedation. Conventional experimental muscle wasting models, such as peripheral denervation, immobilisation in cast, and hind limb suspension, do therefore not mimic the ICU intervention. This necessitates an experimental model mimicking the ICU condition for long durations, i.e. an animal model where the motoneuron is intact, muscles are unloaded and animals are mechanically ventilated. We have previously investigated the effects of different combinations of mechanical ventilation, systemic corticosteroid hormone treatment, NMB and sepsis on skeletal muscle structure and function in 5 day experiments using a porcine experimental ICU model (Norman et al. 2006a; Banduseela et al. 2009). Although the previous experiments have substantially contributed to our understanding of the transcriptional regulation of myofibrillar protein synthesis/degradation in response to these interventions, none of these interventions resulted in significant muscle fibre atrophy during the 5 day period. This is in accordance with muscle size measurements in patients during the first week in the ICU (Ahlbeck et al. 2009), showing no signs of muscle atrophy during the initial 4 days in the ICU and followed by atrophy at longer durations. There is a paucity of information based on temporal analyses of skeletal muscle structure–function, protein and gene expression under ICU conditions for durations longer than 5 days. Moreover, in the current experimental model, it is possible to monitor animals that undergo neuromuscular blockade by post-synaptic block of neuromuscular transmission and are mechanically ventilated but with intact motoneurons for durations longer than 90 days (Dworkin & Dworkin, 1990). Key elements of the skeletal muscle phenotype associated with long-term ICU treatment and AQM were observed in response to the experimental ICU intervention, such as: (1) maintained muscle and muscle fibre size during the first 4 days followed by a progressive muscle atrophy and contractile dysregulation, (2) preferential myosin loss and decreased myosin:actin ratios irrespective of muscle fibre type, and (3) increased fractional protein synthesis rate after the first week in the experimental ICU model in accordance with observations in patients after the first week in the ICU (Essen et al. 1998; Gamrin et al. 2000; Tjader et al. 2004).
Tensegrity
The baseline level of cell tension has a significant impact on cell structure and function, an interplay sometimes referred to as tensegrity (Ingber, 1991, 1993, 1997, 2002a,b). The required transmission and transduction of mechanical signals must involve cytoskeletal elements like intermediate filaments or mechanosensing proteins in the sarcomere, in addition to e.g. mechano-activated ion channels, focal adhesions, integrins, adhesion receptors, autocrine factor release, and G-protein-coupled mechanoreceptors (Jaalouk & Lammerding, 2009). The intracellular signalling processes in response to skeletal muscle mechanotransduction are complex, coordinated and involve protein shuttling between sarcomeric and non-sarcomeric localisations to convey signals to the nucleus. Many of the Z-disk and M-band proteins are mechanosensitive and in dynamic exchange with the cytoplasm and nuclei, affecting protein degradation (ubiquitin proteasome) and transcriptional regulation (Lange et al. 2006). In this study, we have focused our interest on sarcomeric proteins involved in both protein degradation and signal transmission to the nucleus.
Protein degradation
The ubiquitin proteasome proteolytic pathway is responsible for 80–90% of intracellular protein turnover (Solomon & Goldberg, 1996), but calpains and caspases have been suggested to initiate the degradation of myofibrillar proteins (Tidball & Spencer, 2002; Du et al. 2004; Goll et al. 2008). However, it was recently shown that thick, but not thin, filament proteins were degraded by a MuRF1-dependent ubiquitylation, independently of activation of caspases or calpains (Cohen et al. 2009). The early transcriptional up-regulation of the two E3 ligases atrogin-1 and MuRF1 in the experimental ICU condition supports an early activation of the ubiquitin proteasome proteolytic pathway. At the protein level, MuRF1 was up-regulated early, while atrogin-1 levels were not significantly increased during the observation period. MuRF1 is required for rapid muscle atrophy (Bodine et al. 2001), but it was recently shown that the muscle atrophy induced by peripheral nerve denervation preceded the MuRF1-dependent loss of thick filament proteins, and a rapid activation of autophagy was suggested as a possible mechanism underlying the initial muscle wasting (Cohen et al. 2009). The autophagy–lysosomal and the ubiquitin–proteasome systems in muscle are co-ordinately regulated by FoxO factors (Mammucari et al. 2007; Zhao et al. 2007). The muscle atrophy in our experimental ICU model paralleled the activation of these proteolytic pathways, although the autophagy (LC3B as marker) and the ubiquitin–proteasome (MuRF1 as marker) pathways followed slightly different temporal activation patterns. In the experimental ICU model, MuRF1 was rapidly up-regulated, remained stable for the whole observation period and preceded the activation of the autophagy–lysosome system. LC3B, on the other hand, showed a modest initial increase and increased progressively during the 2 week observation period, suggesting intrinsic differences between the muscle atrophy process associated with peripheral denervation and the mechanical silencing caused by sedation, post-synaptic block of neuromuscular transmission and the absence of weight bearing. This is consistent with previous observations of significant differences at the myofibrillar protein and gene levels in response to these two different conditions (Norman et al. 2006b). In the ICU intervention, a preferential thick filament protein loss was observed in both fast- and slow-twitch skeletal muscles and was paralleled by a similar decrease in mRNA expression, while preferential myosin loss was restricted to the slow-twitch soleus muscle in response to peripheral denervation and was not paralleled by a similar change in myosin and actin mRNA expression (Norman et al. 2006b). Recent studies of the autophagy machinery in skeletal muscle indicate that the autophagy–lysosome system may also have important protective functions and inhibition/failure of this system has detrimental effects on muscle fibre survival (Sandri, 2010). Myofibrillar protein degradation products may have severe cytotoxic effects on the muscle cell (Jeong et al. 2009) and autophagy may protect myofibres by sequestering these toxic by-products. The different temporal sequence of the ubiquitin–proteasome activation very early during mechanical silencing and the delayed activation of autophagy with the highest LC3B levels at the longest durations lend support to this view. MuRF2 has been implicated as a repressor of SRF-mediated muscle gene expression with SRF being a major regulator of skeletal α-actin expression (Walsh, 1989; Lee et al. 1991; Lange et al. 2005), and recent data indicate that MuRF1 also acts as a repressor of MyHC transcription (Mearini et al.). This is of specific interest in this context, since both myosin protein and mRNA expression are decreased in ICU patients with the acquired acute quadriplegic myopathy (Larsson et al. 2000; Norman et al. 2009). The down-regulation of actin and MyHC mRNA expression and the preferential myosin loss in response to the mechanical silencing is preceded by the up-regulation of MuRF1 at the protein and mRNA level, and the shuttling of MuRF1 and MuRF2 to the nucleus, followed by the subsequent sequestration of SRF and probably other transcription factors in the cytoplasm. This suggests a significant role of MuRF1 and MuRF2 in the transcriptional component of muscle atrophy associated with the experimental ICU model.
Calpain-1 and caspase-3 are often activated in parallel in response to e.g. sepsis, presumably via the same upstream factor (cytokines, reactive oxygen species) (Supinski et al. 2009) and it has been postulated that myofibrillar proteins are degraded by a two-step process. Initially, calpains and caspases cleave a small number of key contractile proteins, followed by activation of the ubiquitin–proteasomal degradation pathway and degradation of myofibrillar proteins (Powers et al. 2005; Supinski et al. 2009). Assessment of the 75 kDa calpain-1 active cleavage product has been proposed as a superior method in determining calpain activation compared with commonly used traditional indexes (Supinski et al. 2009). In the time-resolved analyses of calpain activity in this study, a significant activation of calpain-1 was observed in response to the ICU intervention. However, a significant increase in the 75 kDa calpain-1 content as well as in the 75:80 kDa calpain ratio was only observed after 9–14 days exposure to the ICU condition, i.e. preceded by both MuRF1 up-regulation, myosin loss and transcriptional down-regulation of myosin. Thus, a thick, but not thin, filament protein degradation via a MuRF-dependent ubiquitylation appears to be a more likely mechanism underlying the muscle wasting and preferential myosin loss in response to the ICU intervention than both lysosomal and calpain-1 proteolytic pathways according to the time-resolved analyses.
During muscle atrophy, a series of biochemical and transcriptional changes lead to highly coordinated protein synthesis adaptations and proteolytic pathway activations (Sandri, 2008). The muscle wasting and preferential myosin loss observed after durations longer than 4 days were paralleled by a dramatic transcriptional down-regulation of both myosin and actin, indicating that the muscle wasting associated with the ICU intervention is not only due to an enhanced degradation, but also to a transcriptional repression of myofibrillar protein synthesis. This is consistent with our previous observations in the porcine experimental ICU model (Banduseela et al. 2009) as well as in ICU patients with AQM (Larsson et al. 2000; Norman et al. 2009). The similar changes in myosin and actin regulation at the transcriptional level together with the preferential loss of myosin suggest differences in myosin and actin post-transcriptional regulation of protein synthesis or in protein degradation. The specific targeting of myosin and myosin-associated proteins by MuRF-mediated ubiquitination (Cohen et al. 2009) seems an obvious candidate mechanism, but there is reason to suspect more complex mechanisms. Both myosin and actin have low turnover rates and the turnover rate of actin has, in some studies, been reported to be 2-fold slower than for myosin (Martin, 1981). Differences in protein content could thus be due to protein-specific differences in turnover rates despite a similar transcriptional down-regulation. In addition, there is a tight interplay between sarcomere-specific chaperones and the ubiquitin-dependent degradation of sarcomeric proteins (Willis et al. 2009). A number of different chaperones are expressed in muscle and αB-crystallin is one of the most abundant heat shock proteins in muscle. αB-Crystallin protects actin from degradation and stabilises actin polymers (Wang & Spector, 1995). The increased αB-crystalline protein levels at the longest durations would agree with an actin-specific protein protection mechanism under ICU conditions.
Protein synthesis
Fractional protein synthesis rate increased at the longest NMB duration, i.e. 9–14 days, in both the deep oxidative and the superficial glycolytic regions of the gastrocnemius muscle. A large variability in fractional protein synthesis rate has been observed in patients after long durations of the ICU intervention (Essen et al. 1998; Gamrin et al. 2000; Tjader et al. 2004). The large variability among critically ill ICU patients may, at least in part, be related to the considerable variability in the underlying disease, pharmacological treatment and age among the patients, but the present results indicate that the increased fractional protein synthesis rate in ICU patients may be secondary to the ICU intervention. Thus, protein synthesis rate increased at the longest duration in spite of a significant transcriptional down-regulation of myofibrillar proteins. The significant up-regulation of different protein degradation pathways and protein chaperones may be major contributing factors to the overall increase in protein synthesis rate. The changes in protein synthesis and measures of degradation pathways indicate a rapid turnover of proteins in muscle, and the muscle wasting that occurs suggests that degradation is exceeding synthesis rate. It is not clear from the current study whether changes in muscle protein synthesis occurred for all protein groups or is specific to any particular groups of proteins involved in any specific function.
Conclusions
The experimental rat ICU model used in this work offers an excellent system to study skeletal muscle structure and function in response to the ICU condition at durations similar to those observed in the clinical setting. The results from the present time-resolved analyses demonstrate changes in skeletal muscle structure and function resembling the muscle wasting observed in ICU patients, such as a maintained muscle size during the first days, followed by accelerated wasting and impaired muscle function. The preferential myosin loss observed after longer durations of unloading and mechanical ventilation in the rodent ICU model is considered to be a pathognomonic finding in ICU patients with AQM (Larsson et al. 2000), suggesting that the mechanical silencing represents an important etiological factor in this specific acquired myopathy. Furthermore, muscle wasting and preferential loss of myosin were preceded by activation of the ubiquitin–proteasome pathway, the nuclear translocation of the transcriptional repressors MuRF1 and MuRF2 and the transcriptional regulator and autophagy adaptor p62, and were paralleled by decreased myosin mRNA levels. Progressive activation of the autophagy–lysosome system and late up-regulation of the small heat shock protein αB-crystallin marked only late stages of muscle loss. This suggests a very complex and highly coordinated system of protein synthesis, degradation and protection unique for the severe muscle wasting and impaired muscle function associated with the muscle silencing in mechanically ventilated, sedated and pharmacologically neuromuscularly blocked ICU patients.
Acknowledgments
We wish to thank medical students Per Danielsson, Max Andersson and Johan Svensson for excellent assistance with morphological measurements of muscle cross-sections. This study was supported by grants from the Swedish Research Council (8651), the European Commission (MyoAge, EC Fp7 CT-223756 and COST CM1001), King Gustaf V and Queen Victoria's Foundation, and Association Française contre les Myopathies to L.L. M.G. and S.P. are supported by the Medical Research Council of Great Britain; M.G. holds the BHF Chair of Molecular Cardiology. The authors declare no conflict of interest.
Glossary
Abbreviations
- AQM
acute quadriplegic myopathy
- CSA
cross-sectional area
- HsP
heat shock protein
- ICU
intensive care unit
- LC3b
MAP1LC3B microtubule-associated protein 1 light chain 3 beta
- MAFbx
muscle-specific F-box protein
- MMP
mixed muscle protein
- MuRF
muscle-specific RING finger protein
- MyHC
myosin heavy chain
- NMB
neuromuscular block
- NMBA
neuromuscular blocking agents
- SRF
serum response factor
- V0
maximum velocity of unloaded shortening
Author contributions
The experimental work was performed in the research laboratories of BD in the Department of Neuroscience, Hershey Medical Center, and LL in the Department of Neuroscience, Clinical Neurophysiology, Uppsala University with the assistance of XT, AMG, MLD, GR, ML, SA, JO, RQ and YH. Intracellular signalling and confocal imaging analyses were done by MG and SP. Gene and protein expression analyses were performed by SA, MLD, GR, AMG, YH and VCB. Single fibre contractile recordings were performed by JO. LL wrote the manuscript with assistance from JO, MG, GCF, SN and BD. All authors have approved the final version.
Supplementary material
Suppl. Fig. 1
As a service to our authors and readers, this journal provides supporting information supplied by the authors. Such materials are peer-reviewed and may be re-organized for online delivery, but are not copy-edited or typeset. Technical support issues arising from supporting information (other than missing files) should be addressed to the authors
References
- Ahlbeck K, Fredriksson K, Rooyackers O, Maback G, Remahl S, Ansved T, et al. Signs of critical illness polyneuropathy and myopathy can be seen early in the ICU course. Acta Anaesthesiol Scand. 2009;53:717–723. doi: 10.1111/j.1399-6576.2009.01952.x. [DOI] [PubMed] [Google Scholar]
- Balagopal P, Ford GC, Ebenstein DB, Nadeau DA, Nair KS. Mass spectrometric methods for determination of [13C]leucine enrichment in human muscle protein. Anal Biochem. 1996;239:77–85. doi: 10.1006/abio.1996.0293. [DOI] [PubMed] [Google Scholar]
- Banduseela VC, Ochala J, Chen YW, Goransson H, Norman H, Radell P, et al. Gene expression and muscle fiber function in a porcine ICU model. Physiol Genomics. 2009;39:141–159. doi: 10.1152/physiolgenomics.00026.2009. [DOI] [PubMed] [Google Scholar]
- Bodine SC, Latres E, Baumhueter S, Lai VK, Nunez L, Clarke BA, et al. Identification of ubiquitin ligases required for skeletal muscle atrophy. Science. 2001;294:1704–1708. doi: 10.1126/science.1065874. [DOI] [PubMed] [Google Scholar]
- Cheung AM, Tansey CM, Tomlinson G, Diaz-Granados N, Matte A, Barr A, et al. Two year outcomes, health care use and costs in survivors of acute respiratory distress syndrome. Am J Respir Crit Care Med. 2006;174:538–544. doi: 10.1164/rccm.200505-693OC. [DOI] [PubMed] [Google Scholar]
- Cohen S, Brault JJ, Gygi SP, Glass DJ, Valenzuela DM, Gartner C, et al. During muscle atrophy, thick, but not thin, filament components are degraded by MuRF1-dependent ubiquitylation. J Cell Biol. 2009;185:1083–1095. doi: 10.1083/jcb.200901052. [DOI] [PMC free article] [PubMed] [Google Scholar]
- De Jonghe B, Sharshar T, Lefaucheur JP, Authier FJ, Durand-Zaleski I, Boussarsar M, et al. Paresis acquired in the intensive care unit: a prospective multicenter study. JAMA. 2002;288:2859–2867. doi: 10.1001/jama.288.22.2859. [DOI] [PubMed] [Google Scholar]
- Du J, Wang X, Miereles C, Bailey JL, Debigare R, Zheng B, et al. Activation of caspase-3 is an initial step triggering accelerated muscle proteolysis in catabolic conditions. J Clin Invest. 2004;113:115–123. doi: 10.1172/JCI200418330. [DOI] [PMC free article] [PubMed] [Google Scholar]
- Dubowitz V. Muscle Biopsy: A Practical Approach. London: Bailliere Tindal & Cox; 1985. [Google Scholar]
- Dworkin BR, Dworkin S. Learning of physiological responses: I. Habituation, sensitization, and classical conditioning. Behav Neurosci. 1990;104:298–319. doi: 10.1037//0735-7044.104.2.298. [DOI] [PubMed] [Google Scholar]
- Dworkin BR, Dworkin S. Baroreflexes of the rat. III. Open-loop gain and electroencephalographic arousal. Am J Physiol Regul Integr Comp Physiol. 2004;286:R597–R605. doi: 10.1152/ajpregu.00469.2003. [DOI] [PubMed] [Google Scholar]
- Edman KA. The velocity of unloaded shortening and its relation to sarcomere length and isometric force in vertebrate muscle fibres. J Physiol. 1979;291:143–159. doi: 10.1113/jphysiol.1979.sp012804. [DOI] [PMC free article] [PubMed] [Google Scholar]
- Edström L, Larsson L. Effects of age on muscle fibre characteristics of fast- and slow-twitch single motor units in the rat. Journal of Physiology. 1987;392:129–145. doi: 10.1113/jphysiol.1987.sp016773. [DOI] [PMC free article] [PubMed] [Google Scholar]
- Essen P, McNurlan MA, Gamrin L, Hunter K, Calder G, Garlick PJ, Wernerman J. Tissue protein synthesis rates in critically ill patients. Crit Care Med. 1998;26:92–100. doi: 10.1097/00003246-199801000-00022. [DOI] [PubMed] [Google Scholar]
- Fabiato A. Computer programs for calculating total from specified free or free from specified total ionic concentrations in aqueous solutions containing multiple metals and ligands. Methods Enzymol. 1988;157:378–417. doi: 10.1016/0076-6879(88)57093-3. [DOI] [PubMed] [Google Scholar]
- Ford GC, Cheng KN, Halliday D. Analysis of (1–13C)leucine and (13C)KIC in plasma by capillary gas chromatography/mass spectrometry in protein turnover studies. Biomed Mass Spectrom. 1985;12:432–436. doi: 10.1002/bms.1200120814. [DOI] [PubMed] [Google Scholar]
- Friedrich O, Fink RH, Hund E. Understanding critical illness myopathy: approaching the pathomechanism. J Nutr. 2005;135:1813S–1817S. doi: 10.1093/jn/135.7.1813S. [DOI] [PubMed] [Google Scholar]
- Frontera WR, Larsson L. Contractile studies of single human skeletal muscle fibers: a comparison of different muscles, permeabilization procedures, and storage techniques. Muscle Nerve. 1997;20:948–952. doi: 10.1002/(sici)1097-4598(199708)20:8<948::aid-mus3>3.0.co;2-6. [DOI] [PubMed] [Google Scholar]
- Galler S, Hilber K. Tension/stiffness ratio of skinned rat skeletal muscle fibre types at various temperatures. Acta Physiol Scand. 1998;162:119–126. doi: 10.1046/j.1365-201X.1998.0272f.x. [DOI] [PubMed] [Google Scholar]
- Gamrin L, Essen P, Hultman E, McNurlan MA, Garlick PJ, Wernerman J. Protein-sparing effect in skeletal muscle of growth hormone treatment in critically ill patients. Ann Surg. 2000;231:577–586. doi: 10.1097/00000658-200004000-00018. [DOI] [PMC free article] [PubMed] [Google Scholar]
- Goll DE, Neti G, Mares SW, Thompson VF. Myofibrillar protein turnover: the proteasome and the calpains. J Anim Sci. 2008;86:E19–E35. doi: 10.2527/jas.2007-0395. [DOI] [PubMed] [Google Scholar]
- Hayashi M, Freiman DG. An improved method of fixation for formalin-sensitive enzymes with special reference to myosin adenosine triphosphatase. J Histochem Cytochem. 1966;14:577–581. doi: 10.1177/14.8.577. [DOI] [PubMed] [Google Scholar]
- Herridge MS, Cheung AM, Tansey CM, Matte-Martyn A, Diaz-Granados N, Al-Saidi F, et al. One-year outcomes in survivors of the acute respiratory distress syndrome. N Engl J Med. 2003;348:683–693. doi: 10.1056/NEJMoa022450. [DOI] [PubMed] [Google Scholar]
- Higuchi H, Yanagida T, Goldman YE. Compliance of thin filaments in skinned fibers of rabbit skeletal muscle. Biophys J. 1995;69:1000–1010. doi: 10.1016/S0006-3495(95)79975-1. [DOI] [PMC free article] [PubMed] [Google Scholar]
- Hirano M, Ott BR, Raps EC, Minetti C, Lennihan L, Libbey NP, et al. Acute quadriplegic myopathy: a complication of treatment with steroids, nondepolarizing blocking agents, or both. Neurology. 1992;42:2082–2087. doi: 10.1212/wnl.42.11.2082. [DOI] [PubMed] [Google Scholar]
- Hudson LD, Lee CM. Neuromuscular sequelae of critical illness. N Engl J Med. 2003;348:745–747. doi: 10.1056/NEJMe020180. [DOI] [PubMed] [Google Scholar]
- Ingber DE. Control of capillary growth and differentiation by extracellular matrix. Use of a tensegrity (tensional integrity) mechanism for signal processing. Chest. 1991;99:34S–40S. [PubMed] [Google Scholar]
- Ingber DE. Cellular tensegrity: defining new rules of biological design that govern the cytoskeleton. J Cell Sci. 1993;104:613–627. doi: 10.1242/jcs.104.3.613. [DOI] [PubMed] [Google Scholar]
- Ingber DE. Tensegrity: the architectural basis of cellular mechanotransduction. Annu Rev Physiol. 1997;59:575–599. doi: 10.1146/annurev.physiol.59.1.575. [DOI] [PubMed] [Google Scholar]
- Ingber D. Mechanical signaling. Ann N Y Acad Sci. 2002a;961:162–163. doi: 10.1111/j.1749-6632.2002.tb03074.x. [DOI] [PubMed] [Google Scholar]
- Ingber DE. Mechanical signaling and the cellular response to extracellular matrix in angiogenesis and cardiovascular physiology. Circ Res. 2002b;91:877–887. doi: 10.1161/01.res.0000039537.73816.e5. [DOI] [PubMed] [Google Scholar]
- Jaalouk DE, Lammerding J. Mechanotransduction gone awry. Nat Rev Mol Cell Biol. 2009;10:63–73. doi: 10.1038/nrm2597. [DOI] [PMC free article] [PubMed] [Google Scholar]
- Jeong EM, Wang X, Xu K, Hossain MM, Jin JP. Nonmyofilament-associated troponin T fragments induce apoptosis. Am J Physiol Heart Circ Physiol. 2009;297:H283–H292. doi: 10.1152/ajpheart.01200.2008. [DOI] [PMC free article] [PubMed] [Google Scholar]
- Kabeya Y, Mizushima N, Ueno T, Yamamoto A, Kirisako T, Noda T, et al. LC3, a mammalian homologue of yeast Apg8p, is localized in autophagosome membranes after processing. EMBO J. 2000;19:5720–5728. doi: 10.1093/emboj/19.21.5720. [DOI] [PMC free article] [PubMed] [Google Scholar]
- Lacomis D, Zochodne DW, Bird SJ. Critical illness myopathy. Muscle Nerve. 2000;23:1785–1788. doi: 10.1002/1097-4598(200012)23:12<1785::aid-mus1>3.0.co;2-j. [DOI] [PubMed] [Google Scholar]
- Lange S, Ehler E, Gautel M. From A to Z and back? Multicompartment proteins in the sarcomere. Trends Cell Biol. 2006;16:11–18. doi: 10.1016/j.tcb.2005.11.007. [DOI] [PubMed] [Google Scholar]
- Lange S, Xiang F, Yakovenko A, Vihola A, Hackman P, Rostkova E, et al. The kinase domain of titin controls muscle gene expression and protein turnover. Science. 2005;308:1599–1603. doi: 10.1126/science.1110463. [DOI] [PubMed] [Google Scholar]
- Larsson L. Melbourne, Australia: 2008a. Acute quadriplegic myopathy and myosin loss in ICU patients. Underlying mechanisms, improved diagnostics and a specific intervention strategy. Australian Physiological Society Meeting. [Google Scholar]
- Larsson L. New Orleans: 2008b. Myosin loss and muscle paralysis in ICU patients: Underlying mechanisms and specific intervention strategies. New Directions in Muscle Biology. [Google Scholar]
- Larsson L, Biral D, Campione M, Schiaffino S. An age-related type IIB to IIX myosin heavy chain switching in rat skeletal muscle. Acta Physiol Scand. 1993;147:227–234. doi: 10.1111/j.1748-1716.1993.tb09493.x. [DOI] [PubMed] [Google Scholar]
- Larsson L, Li X, Edstrom L, Eriksson LI, Zackrisson H, Argentini C, Schiaffino S. Acute quadriplegia and loss of muscle myosin in patients treated with nondepolarizing neuromuscular blocking agents and corticosteroids: mechanisms at the cellular and molecular levels [see comments] Crit Care Med. 2000;28:34–45. doi: 10.1097/00003246-200001000-00006. [DOI] [PubMed] [Google Scholar]
- Larsson L, Moss RL. Maximum velocity of shortening in relation to myosin isoform composition in single fibres from human skeletal muscles. J Physiol. 1993;472:595–614. doi: 10.1113/jphysiol.1993.sp019964. [DOI] [PMC free article] [PubMed] [Google Scholar]
- Lee TC, Chow KL, Fang P, Schwartz RJ. Activation of skeletal α-actin gene transcription: the cooperative formation of serum response factor-binding complexes over positive cis-acting promoter serum response elements displaces a negative-acting nuclear factor enriched in replicating myoblasts and nonmyogenic cells. Mol Cell Biol. 1991;11:5090–5100. doi: 10.1128/mcb.11.10.5090. [DOI] [PMC free article] [PubMed] [Google Scholar]
- Leijten FS, Harinck-de Weerd JE, Poortvliet DC, de Weerd AW. The role of polyneuropathy in motor convalescence after prolonged mechanical ventilation. JAMA. 1995;274:1221–1225. [PubMed] [Google Scholar]
- Li M, Larsson L. Force-generating capacity of human myosin isoforms extracted from single muscle fibre segments. J Physiol. 2010;588:5105–5114. doi: 10.1113/jphysiol.2010.199067. [DOI] [PMC free article] [PubMed] [Google Scholar]
- Ljungqvist OH, Persson M, Ford GC, Nair KS. Functional heterogeneity of leucine pools in human skeletal muscle. Am J Physiol Endocrinol Metab. 1997;273:E564–E570. doi: 10.1152/ajpendo.1997.273.3.E564. [DOI] [PubMed] [Google Scholar]
- McDonald KS, Fitts RH. Effect of hindlimb unloading on rat soleus fiber force, stiffness, and calcium sensitivity. J Appl Physiol. 1995;79:1796–1802. doi: 10.1152/jappl.1995.79.5.1796. [DOI] [PubMed] [Google Scholar]
- MacFarlane IA, Rosenthal FD. Severe myopathy after status asthmaticus. Lancet. 1977;2:615. doi: 10.1016/s0140-6736(77)91471-4. [DOI] [PubMed] [Google Scholar]
- Mammucari C, Milan G, Romanello V, Masiero E, Rudolf R, Del Piccolo P, et al. FoxO3 controls autophagy in skeletal muscle in vivo. Cell Metab. 2007;6:458–471. doi: 10.1016/j.cmet.2007.11.001. [DOI] [PubMed] [Google Scholar]
- Martin AF. Turnover of cardiac troponin subunits. Kinetic evidence for a precursor pool of troponin-I. J Biol Chem. 1981;256:964–968. [PubMed] [Google Scholar]
- Martyn DA, Smith L, Kreutziger KL, Xu S, Yu LC, Regnier M. The effects of force inhibition by sodium vanadate on cross-bridge binding, force redevelopment, and Ca2+ activation in cardiac muscle. Biophys J. 2007;92:4379–4390. doi: 10.1529/biophysj.106.096768. [DOI] [PMC free article] [PubMed] [Google Scholar]
- Mearini G, Gedicke C, Schlossarek S, Witt CC, Kramer E, Cao P, Gomes MD, et al. Atrogin-1 and MuRF1 regulate cardiac MyBP-C levels via different mechanisms. Cardiovasc Res. 2010;85:357–366. doi: 10.1093/cvr/cvp348. [DOI] [PMC free article] [PubMed] [Google Scholar]
- Metges CC, Petzke KJ, Hennig U. Gas chromatography/combustion/isotope ratio mass spectrometric comparison of N-acetyl- and N-pivaloyl amino acid esters to measure 15N isotopic abundances in physiological samples: a pilot study on amino acid synthesis in the upper gastro-intestinal tract of minipigs. J Mass Spectrom. 1996;31:367–376. doi: 10.1002/(SICI)1096-9888(199604)31:4<367::AID-JMS310>3.0.CO;2-V. [DOI] [PubMed] [Google Scholar]
- Moss RL. Sarcomere length-tension relations in frog skinned muscle fibres during calcium activation at short lengths. J Physiol. 1979;292:177–192. doi: 10.1113/jphysiol.1979.sp012845. [DOI] [PMC free article] [PubMed] [Google Scholar]
- Nates JL, Cooper DJ, Day B, Tuxen DV. Acute weakness syndromes in critically ill patients – a reappraisal. Anaesth Intensive Care. 1997;25:502–513. doi: 10.1177/0310057X9702500509. [DOI] [PubMed] [Google Scholar]
- Nordquist J, Hoglund AS, Norman H, Tang X, Dworkin B, Larsson L. Transcription factors in muscle atrophy caused by blocked neuromuscular transmission and muscle unloading in rats. Mol Med. 2007;13:461–470. doi: 10.2119/2006-00066.Nordquist. [DOI] [PMC free article] [PubMed] [Google Scholar]
- Norman H, Kandala K, Kolluri R, Zackrisson H, Nordquist J, Walther S, et al. A porcine model of acute quadriplegic myopathy: a feasibility study. Acta Anaesthesiol Scand. 2006a;50:1058–1067. doi: 10.1111/j.1399-6576.2006.01105.x. [DOI] [PubMed] [Google Scholar]
- Norman H, Nordquist J, Andersson P, Ansved T, Tang X, Dworkin B, Larsson L. Impact of post-synaptic block of neuromuscular transmission, muscle unloading and mechanical ventilation on skeletal muscle protein and mRNA expression. Pflugers Arch. 2006b;453:53–66. doi: 10.1007/s00424-006-0110-5. [DOI] [PubMed] [Google Scholar]
- Norman H, Zackrisson H, Hedstrom Y, Andersson P, Nordquist J, Eriksson LI, et al. Myofibrillar protein and gene expression in acute quadriplegic myopathy. J Neurol Sci. 2009;285:28–38. doi: 10.1016/j.jns.2009.04.041. [DOI] [PMC free article] [PubMed] [Google Scholar]
- Ochala J, Larsson L. Effects of a preferential myosin loss on Ca2+ activation of force generation in single human skeletal muscle fibres. Exp Physiol. 2008;93:486–495. doi: 10.1113/expphysiol.2007.041798. [DOI] [PubMed] [Google Scholar]
- Pizon V, Iakovenko A, Van Der Ven PF, Kelly R, Fatu C, Furst DO, et al. Transient association of titin and myosin with microtubules in nascent myofibrils directed by the MURF2 RING-finger protein. J Cell Sci. 2002;115:4469–4482. doi: 10.1242/jcs.00131. [DOI] [PubMed] [Google Scholar]
- Powers SK, Kavazis AN, DeRuisseau KC. Mechanisms of disuse muscle atrophy: role of oxidative stress. Am J Physiol Regul Integr Comp Physiol. 2005;288:R337–R344. doi: 10.1152/ajpregu.00469.2004. [DOI] [PubMed] [Google Scholar]
- Regnier M, Martin H, Barsotti RJ, Rivera AJ, Martyn DA, Clemmens E. Cross-bridge versus thin filament contributions to the level and rate of force development in cardiac muscle. Biophys J. 2004;87:1815–1824. doi: 10.1529/biophysj.103.039123. [DOI] [PMC free article] [PubMed] [Google Scholar]
- Rich MM, Bird SJ, Raps EC, McCluskey LF, Teener JW. Direct muscle stimulation in acute quadriplegic myopathy. Muscle Nerve. 1997;20:665–673. doi: 10.1002/(sici)1097-4598(199706)20:6<665::aid-mus2>3.0.co;2-6. [DOI] [PubMed] [Google Scholar]
- Rich MM, Pinter MJ, Kraner SD, Barchi RL. Loss of electrical excitability in an animal model of acute quadriplegic myopathy. Ann Neurol. 1998a;43:171–179. doi: 10.1002/ana.410430207. [DOI] [PubMed] [Google Scholar]
- Rich MM, Raps EC, Bird SJ. Distinction between acute myopathy syndrome and critical illness polyneuropathy. Mayo Clin Proc. 1995;70:198–200. doi: 10.4065/70.2.198-a. [DOI] [PubMed] [Google Scholar]
- Rich MM, Teener JW, Raps EC, Bird SJ. Muscle inexcitability in patients with reversible paralysis following steroids and neuromuscular blockade. Muscle Nerve. 1998b;21:1231–1232. doi: 10.1002/(sici)1097-4598(199809)21:9<1231::aid-mus21>3.0.co;2-t. [DOI] [PubMed] [Google Scholar]
- Rich MM, Teener JW, Raps EC, Schotland DL, Bird SJ. Muscle is electrically inexcitable in acute quadriplegic myopathy. Neurology. 1996;46:731–736. doi: 10.1212/wnl.46.3.731. [DOI] [PubMed] [Google Scholar]
- Rudis MI, Guslits BJ, Peterson EL, Hathaway SJ, Angus E, Beis S, Zarowitz BJ. Economic impact of prolonged motor weakness complicating neuromuscular blockade in the intensive care unit. Crit Care Med. 1996;24:1749–1756. doi: 10.1097/00003246-199610000-00024. [DOI] [PubMed] [Google Scholar]
- Sandri M. Signaling in muscle atrophy and hypertrophy. Physiology (Bethesda) 2008;23:160–170. doi: 10.1152/physiol.00041.2007. [DOI] [PubMed] [Google Scholar]
- Sandri M. Autophagy in health and disease: 3. Autophagy involvement in muscle atrophy. Am J Physiol Cell Physiol. 2010;298:C1291–C1297. doi: 10.1152/ajpcell.00531.2009. [DOI] [PubMed] [Google Scholar]
- Seneff MG, Wagner D, Thompson D, Honeycutt C, Silver MR. The impact of long-term acute-care facilities on the outcome and cost of care for patients undergoing prolonged mechanical ventilation. Crit Care Med. 2000;28:342–350. doi: 10.1097/00003246-200002000-00009. [DOI] [PubMed] [Google Scholar]
- Seow CY, Shroff SG, Ford LE. Detachment of low-force bridges contributes to the rapid tension transients of skinned rabbit skeletal muscle fibres. J Physiol. 1997;501:149–164. doi: 10.1111/j.1469-7793.1997.149bo.x. [DOI] [PMC free article] [PubMed] [Google Scholar]
- Sher JH, Shafiq SA, Schutta HS. Acute myopathy with selective lysis of myosin filaments. Neurology. 1979;29:100–106. doi: 10.1212/wnl.29.1.100. [DOI] [PubMed] [Google Scholar]
- Solomon V, Goldberg AL. Importance of the ATP-ubiquitin-proteasome pathway in the degradation of soluble and myofibrillar proteins in rabbit muscle extracts. J Biol Chem. 1996;271:26690–26697. doi: 10.1074/jbc.271.43.26690. [DOI] [PubMed] [Google Scholar]
- Spencer JA, Eliazer S, Ilaria RL, Jr, Richardson JA, Olson EN. Regulation of microtubule dynamics and myogenic differentiation by MURF, a striated muscle RING-finger protein. J Cell Biol. 2000;150:771–784. doi: 10.1083/jcb.150.4.771. [DOI] [PMC free article] [PubMed] [Google Scholar]
- Supinski GS, Wang W, Callahan LA. Caspase and calpain activation both contribute to sepsis-induced diaphragmatic weakness. J Appl Physiol. 2009;107:1389–1396. doi: 10.1152/japplphysiol.00341.2009. [DOI] [PMC free article] [PubMed] [Google Scholar]
- Tidball JG, Spencer MJ. Expression of a calpastatin transgene slows muscle wasting and obviates changes in myosin isoform expression during murine muscle disuse. J Physiol. 2002;545:819–828. doi: 10.1113/jphysiol.2002.024935. [DOI] [PMC free article] [PubMed] [Google Scholar]
- Tjader I, Rooyackers O, Forsberg AM, Vesali RF, Garlick PJ, Wernerman J. Effects on skeletal muscle of intravenous glutamine supplementation to ICU patients. Intensive Care Med. 2004;30:266–275. doi: 10.1007/s00134-003-2048-9. [DOI] [PubMed] [Google Scholar]
- van Mook WN, Hulsewe-Evers RP. Critical illness polyneuropathy. Curr Opin Crit Care. 2002;8:302–310. doi: 10.1097/00075198-200208000-00006. [DOI] [PubMed] [Google Scholar]
- Walsh K. Cross-binding of factors to functionally different promoter elements in c-fos and skeletal actin genes. Mol Cell Biol. 1989;9:2191–2201. doi: 10.1128/mcb.9.5.2191. [DOI] [PMC free article] [PubMed] [Google Scholar]
- Wang K, Spector A. Alpha-crystallin can act as a chaperone under conditions of oxidative stress. Invest Ophthalmol Vis Sci. 1995;36:311–321. [PubMed] [Google Scholar]
- Willis MS, Ike C, Li L, Wang DZ, Glass DJ, Patterson C. Muscle ring finger 1, but not muscle ring finger 2, regulates cardiac hypertrophy in vivo. Circ Res. 2007;100:456–459. doi: 10.1161/01.RES.0000259559.48597.32. [DOI] [PMC free article] [PubMed] [Google Scholar]
- Willis MS, Schisler JC, Portbury AL, Patterson C. Build it up – Tear it down: protein quality control in the cardiac sarcomere. Cardiovasc Res. 2009;81:439–448. doi: 10.1093/cvr/cvn289. [DOI] [PMC free article] [PubMed] [Google Scholar]
- Yu F, Degens H, Larsson L. The influence of thyroid hormone on myosin isoform composition and shortening velocity of single skeletal muscle fibres with special reference to ageing and gender. Acta Physiol Scand. 1999;167:313–316. doi: 10.1046/j.1365-201x.1999.00620.x. [DOI] [PubMed] [Google Scholar]
- Zhao J, Brault JJ, Schild A, Cao P, Sandri M, Schiaffino S, et al. FoxO3 coordinately activates protein degradation by the autophagic/lysosomal and proteasomal pathways in atrophying muscle cells. Cell Metab. 2007;6:472–483. doi: 10.1016/j.cmet.2007.11.004. [DOI] [PubMed] [Google Scholar]
Associated Data
This section collects any data citations, data availability statements, or supplementary materials included in this article.