

Abstract
Simultaneous monitoring of many functioning β-cells is essential for understanding β-cell dysfunction as an early event in the progression to diabetes. Intrinsic optical signal (IOS) imaging has been shown to allow high resolution detection of stimulus-evoked physiological responses in the retina and other neural tissues. In this paper, we demonstrate the feasibility of using IOS imaging for functional examination of insulin secreting INS-1 cells, a popular model for investigating diabetes associated β-cell dysfunction. Our experiments indicate that IOS imaging permits simultaneous monitoring of glucose-stimulated physiological responses in multiple cells with high spatial (sub-cellular) and temporal (sub-second) resolution. Rapid IOS image sequences revealed transient optical responses that had time courses tightly correlated with the glucose stimulation.
OCIS codes: (170.2655) Functional monitoring and imaging, (170.4580) Optical diagnostics for medicine, (170.3880) Medical and biological imaging, (330.5380) Physiology
1. Introduction
Islets of Langerhans are micro-organs in the pancreas that contain several types of endocrine cells, including the β-cells. Pancreatic islet β-cells are the only cell type that produces and releases insulin, the major hormone for accurate control of the glucose level in the blood, i.e. glucose homeostasis. It is well known that β-cell dysfunction can cause elevated glucose levels, i.e., the common symptoms of diabetes, which has become a global epidemic. It is estimated that 200 million people in the world are currently suffering from diabetes, and the number may increase to 366 million in 2030 [1, 2]. Thus, quantitative evaluation of β-cell function is essential for the advanced study and reliable diagnosis of diabetes, and for quality control of isolated islets in clinical transplantation. Several nuclear imaging techniques, including single photon emission computed tomography (SPECT), positron emission tomography (PET) and magnetic resonance imaging (MRI) have been established for noninvasive measurement of β-cell mass [3], but the mass information alone is not sufficient for understanding the complex mechanisms underlying diabetes. In principle, optical imaging approaches, including optical coherence tomography (OCT) [4, 5] and confocal microscopy [6], can provide high resolution morphological imaging of pancreatic islets. However, morphological and functional abnormalities of islet cells are not always directly correlated. Because glucose-induced insulin release is driven by a series of electrical activities in the β-cells [7], including the oscillations in intracellular Ca2+ and electrical membrane potential, electrophysiological measurements, such as intracellular potential recording, have been explored for functional study and evaluation of β-cells [8], but simultaneous electrophysiological measurement of multiple functioning β-cells is difficult. It is well established that β-cells are electrically coupled in a network in intact islets for effective regulation of glucose-induced insulin release [9, 10], thus simultaneous monitoring of many β-cells is essential for better understanding of β-cell dysfunction that is an early event in the progression to diabetes. Given the fact that the calcium influx is tightly correlated with insulin release, calcium fluorescence imaging has been explored for functional evaluation of glucose-evoked β-cell activities in intact islets [11]. However, photo-toxicity and photo-bleaching have been the common problems for fluorescent dye based imaging. Moreover, loading of fluorescent dyes into the center part of intact islets is difficult, although calcium imaging of β-cells at the islet periphery is readily practical [12].
The purpose of this study is to demonstrate the feasibility of high (sub-cellular) resolution functional imaging of pancreatic islet β-cells using transient intrinsic optical signals (IOSs) correlated with glucose stimulation. IOS imaging has been established for high resolution detection of stimulus-evoked physiological responses in the retina [13, 14] and other neural tissues [15–17]. Fast IOSs have time courses that are comparable to stimulus-evoked electrophysiological kinetics [18, 19], and allows simultaneous monitoring of coherent interactions of multiple neurons working together [20]. Given the fact that neurons and islet β-cells share many biochemical and molecular mechanisms, including their electrophysiological oscillation activities, we hypothesized that IOS imaging could provide a new method for high resolution evaluation of glucose-evoked responses in the islet β-cells.
2. Method
2.1. Preparation of insulin secreting INS-1 cell line
The insulin secreting INS-1 cell line was employed for this study. INS-1 cells express many important features of normal pancreatic islet β-cells, and thus provide a popular model for studying diabetes related pathological changes of β-cells in the islets of Langerhans. The INS-1 cells, a kind gift from Dr. John A. Corbett (Department of Biochemistry, Medical College of Wisconsin, Milwaukee, WI) were cultured in RPMI-1640 (Gibco, Carlsbad, CA) supplemented with 10% fetal bovine serum (FBS, Atlanta Biologicals, Atlanta, GA), 2 mM L-glutamine (Invitrogen, Carlsbad, CA), 10 mM HEPES (Invitrogen), 1 mM sodium pyruvate (Invitrogen) and 55 µM 2-mercaptoethanol (Gibco). Cells were routinely expanded to 90% confluency in 75 cm2 tissue culture treated flasks at 37°C in an atmosphere of 95% air and 5% CO2. In this study, the cells were plated onto 6-well tissue culture treated plates and cultured overnight. At 1 hr before glucose stimulation, the culture medium was switched to Phosphate Buffered Saline (Gibco) containing 2.5 mM glucose.
2.2. Experimental setup
Figure 1 gives the schematic diagram of the experimental setup. Equipped with a high-speed CMOS camera (PCO1200, PCO AG, Kelheim, Germany), the imaging system can support sub-second temporal resolution and sub-cellular spatial resolution. During the IOS imaging experiment continuous illumination of NIR light was used for IOS imaging of β-cell activity. After recording pre-stimulus baseline images for 30-s, 100µL of 250 mM glucose was added for β-cell stimulation, and post-stimulus images were recorded for 5-min at a speed of 10 frames/s. After the delivery of the stimulus, overall glucose concentration of the recording chamber solution increased from 2.5 mM (pre-stimulus) to 25 mM (post-stimulus), and was confirmed using a portable blood glucose meter after the IOS imaging measurement. More than a dozen of measurements have been carried out with the same stimulus and imaging parameters. Transient IOSs were routinely observed in the INS-1 cells that tightly correlate with the glucose stimulation.
Fig. 1.
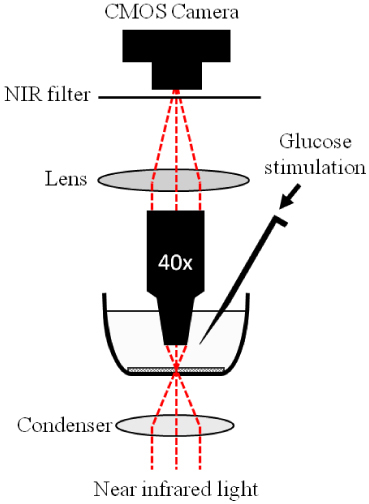
Schematic diagram of the experimental setup for the IOS imaging of INS-1 cells. During the measurement, the cells were continuously illuminated by NIR light for recording of stimulus-evoked IOSs. The glucose stimulus was injected directly into the solution surrounding the INS-1 cells. A 40x water dipping objective was employed to minimize potential fluid vibration caused by glucose injection so that the effect of glucose delivery-associated water fluctuation on IOS imaging was negligible.
2.3. Data processing and cell area calculation
Details of the IOS image processing have been reported in previous publications [19, 21]. Briefly, the IOS images were reconstructed by processing the raw images (Fig. 2A ) as follows: 1) The pre-stimulus baseline images were averaged, pixel by pixel, and that average was taken as the background light intensity, I, of each pixel; 2) The background light intensity was subtracted from each subsequently recorded frame sequentially, pixel by pixel, to obtain the dynamic optical response, ΔI, of each pixel of the images; 3) The image sequence of ΔI/I was constructed to show the dynamic IOSs (Fig. 2B) correlated with the stimulus.
Fig. 2.
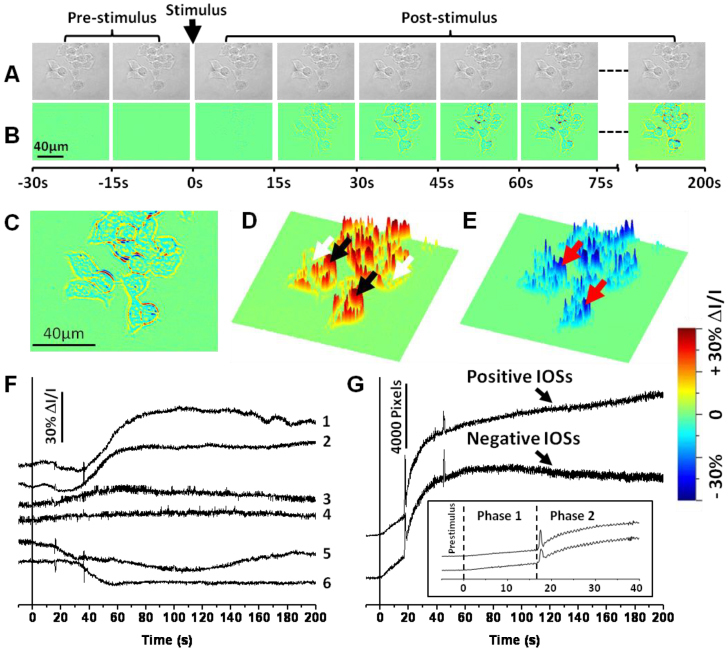
(A) Representative CMOS images of the INS-1 cells before differential processing. (B) IOS image sequence. The raw CMOS images were recorded with a speed of 10 frame/s. Each illustrated frame is an average over a 15-s interval (150 frames). (C) Enlarged image of the seventh frame in Fig. 2B. (D) Three dimensional (3D) presentation of the positive (increasing) IOSs in Fig. 2C. Black and white arrows point to pixels with positive IOSs around cells and inside cells respectively. (E) 3D presentation of the negative (decreasing) IOSs in Fig. 2C. Red arrows point to pixels with negative IOSs. (F) Representative localized IOSs of individual pixels. Each pixel corresponds to a 0.3 µm x 0.3 µm area. The vertical black line marks the stimulus onset. Traces 1 and 2 represent are from pixels at the black arrowheads in Fig. 2D (Positive IOSs around cells). Traces 3 and 4 are from the pixels at the white arrowheads in Fig. 2D (Positive IOSs inside cells). Traces 5 and 6 are from the red arrowheads in Fig. 2E (Negative IOSs). (G) Statistic calculation of the overall IOS changes over all cells. The vertical black line marks the stimulus onset. Inset: Enlarged image of the first 50-s of the IOS curves in Fig. 2G. Dotted lines mark the onset of phase 1 and phase 2.
In order to characterize the correlation between IOSs and physical changes such as swelling or shrinking of β-cells, the spatiotemporal pattern of selective line areas of raw (Fig. 3B and 3C) and IOS (Fig. 3E and 3F) images were compared. The volume dynamics of individual cells were also quantitatively analyzed (Fig. 4 ). During the analysis, the boundaries of representative β-cells were first obtained in order to perform pixel counting within the boundaries. The images were processed in Matlab using a new variational level set formulation method [22]. This method accurately predicts the edge of a selected cell (Fig. 4A) and follows the changes of this edge throughout the entire image sequence. Then, all the pixels within the edge were counted to determine the cell size change.
Fig. 3.
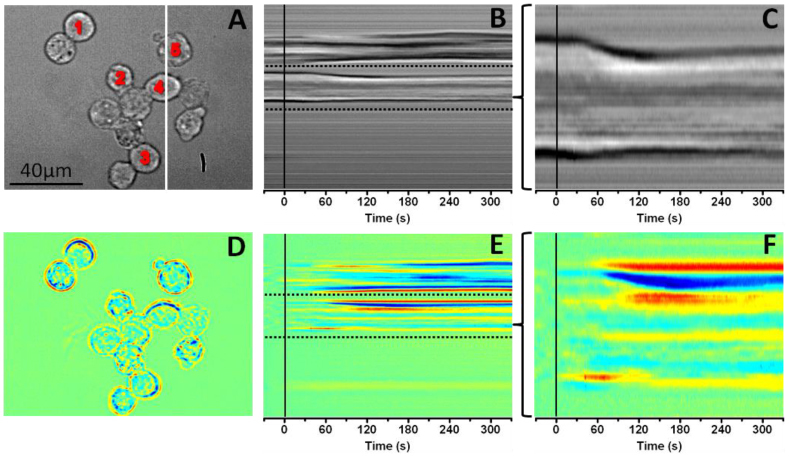
(A) Representative CMOS image of the INS-1 cells before differential processing. The white line indicates the x-axis location from where the spatiotemporal image sequences in Fig. 3B and 3E were produced. The numbers indicate the cells that were used to produce the five temporal change curves in Fig. 4B. (B) Spatiotemporal sequence of the raw images produced from the white line area in Fig. 3A. The vertical black line marks the stimulus onset. The dashed line area was enlarged to produce Fig. 3C. (C) Enlarged image of the dashed line area in Fig. 3B. The vertical black line marks the stimulus onset. (D) IOS image of Fig. 3A. (E) Spatiotemporal sequence of IOS images produced from the white line area in Fig. 3A. The vertical black line marks the stimulus onset. The dashed line area was enlarged to produce Fig. 3F. (F) Enlarged image of the dashed line area in Fig. 3E. The vertical black line marks the stimulus onset.
Fig. 4.
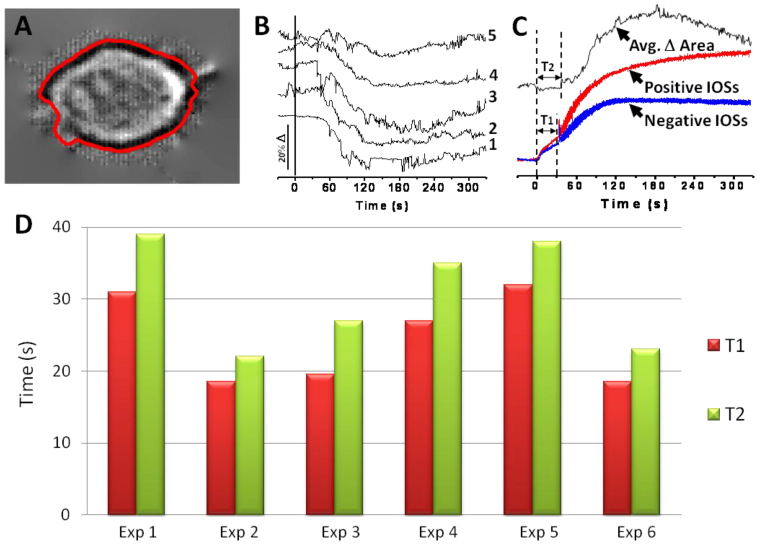
(A) Enlarged image of cell 4 in Fig. 3A. The enclosed red line around the cell represents the boundary calculated by the variational level set formulation method. (B) Area change curves. Curve 1~5 correspond to area changes of cell 1~5 in Fig. 3A. The vertical black line marks the stimulus onset. (C) Comparison of area changes and IOS changes. The area change curve is the average of the 5 curves in Fig. 4B. It is vertically inverted in this figure to make illustration simpler. The IOS curves represent the positive and the negative IOS changes of the whole image sequence over all cells. The dotted lines indicate T1 (Length of IOS phase 1) and T2 (Time before significant cell shape change). (D) Comparison of T1 and T2 from 6 different experimental trials.
3. Results
Figure 2 shows representative IOS images of the stimulus activated INS-1 cells. Both positive and negative IOSs were consistently observed (Fig. 2C, 2D and 2E). The edge area of each cell was dominated by robust positive IOSs (e.g., black arrowheads in Fig. 2D). In contrast, the center area of each cell was dominated by negative IOSs (e.g., red arrowheads in Fig. 2E), although relatively low magnitude positive IOSs could be also identified (e.g., white arrowheads in Fig. 2D).
Figure 2F shows localized IOSs of individual pixels (0.3 µm x 0.3 µm). Examination at sub-cellular resolution further confirmed that transient IOSs are tightly correlated with the glucose stimulation. If we ignore the difference of IOS polarity (i.e., positive or negative) and magnitude, the time courses, especially the on-going phase of the IOSs are comparable to that of previous reported electrical activities of isolated β-cells [8], and islets. Major components of these IOSs approach peak magnitude within 50-100 s, but the reset phase was longer lasting and not all pixels returned to baseline during the 200 s recording period.
Both positive and negative IOSs undergo a two-phase intensity change (Fig. 2G). The first phase of the transient IOSs occurred almost immediately (<1s) after the delivery of the glucose stimulus, this phase had a relatively slow increase rate compared to the second phase. The second phase, tightly followed the first phase, occurred ~20 s after the onset of the stimulus. This second phase response showed robust high magnitude IOS changes, particularly at the periphery of each cell, and sustained throughout the recording period.
The spatiotemporal patterns shown in Fig. 3 represent dynamic cellular size changes correlated with the glucose stimulation. In Fig. 3B and 3C, a transient shrinking response occurred after the glucose stimulation, and corresponding IOSs are shown in Fig. 3E and 3F. Enlarged view (Fig. 3C) of the area between two dashed lines in Fig. 3B (raw image) shows that most of the shrinking of the cell appeared approximately 30 s after the stimulation, and reached the peak magnitude within ~120 s. However, the enlarged image of the identical area in Fig. 3E (IOS image) revealed that early IOSs occurred almost immediately after the glucose stimulus were delivered.
Figure 4B shows dynamic cellular size changes of individual cells 1~5 in Fig. 3A. Figure 4B shows that the size of each cell decreased significantly (~10-20%) after the glucose stimulation. The top curve (black) in Fig. 4C is the average of all five curves in Fig. 4B; while red and blue curves show corresponding temporal changes of averaged positive and negative IOSs of the image area shown in Fig. 3D. The IOS curves, as described before, showed two distinct phases of changes, the first phase occurred immediately after the stimulus onset and lasting for approximately 30 s, followed by the second phase high magnitude IOS response. In Fig. 4C, T1 represents the offset of the first phase IOS response (and the onset of the second phase IOS response), and T2 shows the time point where significant (three sigma standard) cellular change was observed. In Fig. 4D, the T1 and T2 of six different experimental trials were plotted to illustrate the correlation between the onset of phase 2 IOSs and the onset of significant cellular size changes of corresponding cells. Although the T1 of each sample exhibits slight differences (ranged between 18-s to 32-s) in the time course, the corresponding T2 of each experiment was tightly correlated with its T1.
4. Discussion
In this study we have demonstrated the feasibility of NIR imaging of transient IOSs in stimulus activated INS-1 cells. The time courses of major IOSs are comparable to that of previously reported electrical activities of β-cells in isolated islets [8]. High resolution IOS images revealed both positive and negative IOSs within the β-cells. While cell boundaries showed predominantly positive IOSs, cell interiors displayed both positive and negative optical responses. Transient shrinking responses of INS-1 cells were consistently observed to be tightly correlated to the glucose stimulation (Fig. 3 and Fig. 4). We speculate that the shrinking response of INS-1 cells is functionally related to glucose-induced insulin release and associated calcium flux dynamics. The similar time courses of T1 and T2 shown in Fig. 4 suggest that the initiation of second phases IOSs, at least at the periphery of each cell, are triggered primarily from transient physical changes such as shrinkage. In contrast, the early, first phase IOSs may result from intracellular changes, such as nuclear infolding [23] and/or mitochondria deformations that are correlated with stimulus-evoked cellular metabolism [24]. While the major IOSs show a two-phase response, it is interesting that a spike-like peak at the end of T1 (Fig. 2G and Fig. 4C) was consistently observed in the overall dynamic IOS change curves. A similar peak was also occasionally observed in later stage of some trials (Fig. 2G). These characteristic peaks were observed throughout all six experimental trials shown in Fig. 4D. We speculate that this response might reflect signals from the pulsate release of insulin granules and/or calcium oscillation.
In conclusion, our experiment study and analysis suggests that multiple sources and mechanisms produce the IOSs. Further investigation is necessary for understanding the sources and mechanisms of IOSs in these glucose activated β-cells. We anticipate that, in association with simultaneous electrophysiological measurement and/or calcium imaging, further characterization of the glucose-evoked IOSs in β-cells may lead to a new methodology for noninvasive, functional evaluation of the pancreatic islets. Moreover, high resolution IOS imaging of both periphery and center parts of intact islets can be readily achieved using depth-resolved OCT, without the need for exogenous dyes. Depth-resolved OCT imaging of stimulus-evoked IOSs in the retina [21, 25, 26] and other neural tissues [27, 28] has been recently demonstrated. We are currently pursuing depth-resolved OCT imaging of IOSs in isolated, intact pancreatic islets. Depth-resolved IOS imaging of glucose-evoked activities in intact islets can provide simultaneous monitoring of dynamic interactions among many β-cells, and thus may lead to a new, superior method for the investigation of diabetes associated β-cell dysfunction. Moreover, high resolution IOS imaging may also provide a noninvasive method for functional screening of isolated islets that could lead to an enhanced success rate of islet transplantation.
Acknowledgments
This research is supported by the Dana Foundation (Brain and Immuno-Imaging Grant program), the Eyesight Foundation of Alabama, the National Institutes of Health (NIH) ( 1R21RR025788-02 and 5-u-42-RR023246), and the Islet Resource Facility of UAB Comprehensive Diabetes Center (UAB IRF-CDC).
References and links
- 1.Malaisse W. J., Louchami K., Sener A., “Noninvasive imaging of pancreatic beta cells,” Nat. Rev. Endocrinol 5(7), 394–400 (2009). 10.1038/nrendo.2009.103 [DOI] [PubMed] [Google Scholar]
- 2.Wild S., Roglic G., Green A., Sicree R., King H., “Global prevalence of diabetes: estimates for the year 2000 and projections for 2030,” Diabetes Care 27(5), 1047–1053 (2004). 10.2337/diacare.27.5.1047 [DOI] [PubMed] [Google Scholar]
- 3.Holmberg D., Ahlgren U., “Imaging the pancreas: from ex vivo to non-invasive technology,” Diabetologia 51(12), 2148–2154 (2008). 10.1007/s00125-008-1140-7 [DOI] [PubMed] [Google Scholar]
- 4.Villiger M., Goulley J., Friedrich M., Grapin-Botton A., Meda P., Lasser T., Leitgeb R. A., “In vivo imaging of murine endocrine islets of Langerhans with extended-focus optical coherence microscopy,” Diabetologia 52(8), 1599–1607 (2009). 10.1007/s00125-009-1383-y [DOI] [PubMed] [Google Scholar]
- 5.Villiger M., Goulley J., Martin-Williams E. J., Grapin-Botton A., Lasser T., “Towards high resolution optical imaging of beta cells in vivo,” Curr. Pharm. Des. 16(14), 1595–1608 (2010). 10.2174/138161210791164153 [DOI] [PubMed] [Google Scholar]
- 6.Brissova M., Fowler M. J., Nicholson W. E., Chu A., Hirshberg B., Harlan D. M., Powers A. C., “Assessment of human pancreatic islet architecture and composition by laser scanning confocal microscopy,” J. Histochem. Cytochem. 53(9), 1087–1097 (2005). 10.1369/jhc.5C6684.2005 [DOI] [PubMed] [Google Scholar]
- 7.Ikeuchi M., Fujimoto W. Y., Cook D. L., “Rat islet cells have glucose-dependent periodic electrical activity,” Horm. Metab. Res. 16(3), 125–127 (1984). 10.1055/s-2007-1014717 [DOI] [PubMed] [Google Scholar]
- 8.Antunes C. M., Salgado A. P., Rosário L. M., Santos R. M., “Differential patterns of glucose-induced electrical activity and intracellular calcium responses in single mouse and rat pancreatic islets,” Diabetes 49(12), 2028–2038 (2000). 10.2337/diabetes.49.12.2028 [DOI] [PubMed] [Google Scholar]
- 9.Nittala A., Ghosh S., Wang X. J., “Investigating the Role of Islet Cytoarchitecture in Its Oscillation Using a New beta-Cell Cluster Model,” Plos. One 2, (2007). 10.1371/journal.pone.0000983 [DOI] [PMC free article] [PubMed] [Google Scholar]
- 10.Rocheleau J. V., Remedi M. S., Granada B., Head W. S., Koster J. C., Nichols C. G., Piston D. W., “Critical role of gap junction coupled K-ATP channel activity for regulated insulin secretion,” PLoS Biol. 4(2), 221–227 (2006). 10.1371/journal.pbio.0040026 [DOI] [PMC free article] [PubMed] [Google Scholar]
- 11.Speier S., Nyqvist D., Cabrera O., Yu J., Molano R. D., Pileggi A., Moede T., Köhler M., Wilbertz J., Leibiger B., Ricordi C., Leibiger I. B., Caicedo A., Berggren P. O., “Noninvasive in vivo imaging of pancreatic islet cell biology,” Nat. Med. 14(5), 574–578 (2008). 10.1038/nm1701 [DOI] [PMC free article] [PubMed] [Google Scholar]
- 12.Manning Fox J. E., Gyulkhandanyan A. V., Satin L. S., Wheeler M. B., “Oscillatory membrane potential response to glucose in islet beta-cells: a comparison of islet-cell electrical activity in mouse and rat,” Endocrinology 147(10), 4655–4663 (2006). 10.1210/en.2006-0424 [DOI] [PubMed] [Google Scholar]
- 13.Harary H. H., Brown J. E., Pinto L. H., “Rapid light-induced changes in near infrared transmission of rods in Bufo marinus,” Science 202(4372), 1083–1085 (1978). 10.1126/science.102035 [DOI] [PubMed] [Google Scholar]
- 14.Pepperberg D. R., Kahlert M., Krause A., Hofmann K. P., “Photic modulation of a highly sensitive, near-infrared light-scattering signal recorded from intact retinal photoreceptors,” Proc. Natl. Acad. Sci. U.S.A. 85(15), 5531–5535 (1988). 10.1073/pnas.85.15.5531 [DOI] [PMC free article] [PubMed] [Google Scholar]
- 15.Cohen L. B., Keynes R. D., Hille B., “Light scattering and birefringence changes during nerve activity,” Nature 218(5140), 438–441 (1968). 10.1038/218438a0 [DOI] [PubMed] [Google Scholar]
- 16.Foust A. J., Rector D. M., “Optically teasing apart neural swelling and depolarization,” Neuroscience 145(3), 887–899 (2007). 10.1016/j.neuroscience.2006.12.068 [DOI] [PMC free article] [PubMed] [Google Scholar]
- 17.Tasaki I., Watanabe A., Sandlin R., Carnay L., “Changes in fluorescence, turbidity, and birefringence associated with nerve excitation,” Proc. Natl. Acad. Sci. U.S.A. 61(3), 883–888 (1968). 10.1073/pnas.61.3.883 [DOI] [PMC free article] [PubMed] [Google Scholar]
- 18.Li Y. G., Zhang Q. X., Liu L., Amthor F. R., Yao X. C., “High spatiotemporal resolution imaging of fast intrinsic optical signals activated by retinal flicker stimulation,” Opt. Express 18(7), 7210–7218 (2010). 10.1364/OE.18.007210 [DOI] [PMC free article] [PubMed] [Google Scholar]
- 19.Yao X. C., Zhao Y. B., “Optical dissection of stimulus-evoked retinal activation,” Opt. Express 16(17), 12446–12459 (2008). 10.1364/OE.16.012446 [DOI] [PubMed] [Google Scholar]
- 20.Li Y. C., Strang C., Amthor F. R., Liu L., Li Y. G., Zhang Q. X., Keyser K., Yao X. C., “Parallel optical monitoring of visual signal propagation from the photoreceptors to the inner retina layers,” Opt. Lett. 35(11), 1810–1812 (2010). 10.1364/OL.35.001810 [DOI] [PMC free article] [PubMed] [Google Scholar]
- 21.Yao X. C., Yamauchi A., Perry B., George J. S., “Rapid optical coherence tomography and recording functional scattering changes from activated frog retina,” Appl. Opt. 44(11), 2019–2023 (2005). 10.1364/AO.44.002019 [DOI] [PubMed] [Google Scholar]
- 22.C. X. Chunming Li, Changfeng Gui, and Martin D. Fox, “Level Set Evolution without Re-initialization: A New Variational Formulation,” in Proceeding of IEEE International Conference on Computer Vision and Pattern Recognition (San Diego, 2005), pp. 430–436. [Google Scholar]
- 23.Wittmann M., Queisser G., Eder A., Wiegert J. S., Bengtson C. P., Hellwig A., Wittum G., Bading H., “Synaptic activity induces dramatic changes in the geometry of the cell nucleus: interplay between nuclear structure, histone H3 phosphorylation, and nuclear calcium signaling,” J. Neurosci. 29(47), 14687–14700 (2009). 10.1523/JNEUROSCI.1160-09.2009 [DOI] [PMC free article] [PubMed] [Google Scholar]
- 24.Kawauchi S., Sato S., Ooigawa H., Nawashiro H., Ishihara M., Kikuchi M., “Simultaneous measurement of changes in light absorption due to the reduction of cytochrome c oxidase and light scattering in rat brains during loss of tissue viability,” Appl. Opt. 47(22), 4164–4176 (2008). 10.1364/AO.47.004164 [DOI] [PubMed] [Google Scholar]
- 25.Bizheva K., Pflug R., Hermann B., Povazay B., Sattmann H., Qiu P., Anger E., Reitsamer H., Popov S., Taylor J. R., Unterhuber A., Ahnelt P., Drexler W., “Optophysiology: depth-resolved probing of retinal physiology with functional ultrahigh-resolution optical coherence tomography,” Proc. Natl. Acad. Sci. U.S.A. 103(13), 5066–5071 (2006). 10.1073/pnas.0506997103 [DOI] [PMC free article] [PubMed] [Google Scholar]
- 26.Srinivasan V. J., Chen Y., Duker J. S., Fujimoto J. G., “In vivo functional imaging of intrinsic scattering changes in the human retina with high-speed ultrahigh resolution OCT,” Opt. Express 17(5), 3861–3877 (2009). 10.1364/OE.17.003861 [DOI] [PMC free article] [PubMed] [Google Scholar]
- 27.Akkin T., Landowne D., Sivaprakasam A., “Optical coherence tomography phase measurement of transient changes in squid giant axons during activity,” J. Membr. Biol. 231(1), 35–46 (2009). 10.1007/s00232-009-9202-4 [DOI] [PubMed] [Google Scholar]
- 28.Graf B. W., Ralston T. S., Ko H. J., Boppart S. A., “Detecting intrinsic scattering changes correlated to neuron action potentials using optical coherence imaging,” Opt. Express 17(16), 13447–13457 (2009). 10.1364/OE.17.013447 [DOI] [PMC free article] [PubMed] [Google Scholar]