

Abstract
RNA-binding proteins of the Musashi (Msi) family are expressed in stem cell compartments and in aggressive tumors, but they have not yet been widely explored in the blood. Here we demonstrate that Msi2 is the predominant form expressed in hematopoietic stem cells (HSCs), and its knockdown leads to reduced engraftment and depletion of HSCs in vivo. Overexpression of human MSI2 in a mouse model increases HSC cell cycle progression and cooperates with the chronic myeloid leukemia–associated BCR-ABL1 oncoprotein to induce an aggressive leukemia. MSI2 is overexpressed in human myeloid leukemia cell lines, and its depletion leads to decreased proliferation and increased apoptosis. Expression levels in human myeloid leukemia directly correlate with decreased survival in patients with the disease, thereby defining MSI2 expression as a new prognostic marker and as a new target for therapy in acute myeloid leukemia (AML).
Musashi family RNA-binding proteins have been linked to tissue stem cells but not yet studied extensively in the blood1,2. Deregulation of key genes that control self-renewal and cell fate decisions in HSCs can contribute to the onset and progression of leukemia3. To identify previously unknown regulators of HSC function and leukemogenesis, we performed gene expression profiling of sorted mouse hematopoietic stem and progenitor cells (defined as LinlowSca1+c-Kit+; LSK cells) and committed progenitor cells (LinlowSca1−c-Kit+; LK cells) and analyzed genes that were differentially expressed in these populations. Numerous genes implicated in leukemia were preferentially expressed in hematopoietic stem and progenitor cells, including those encoding the transcription factors ecotropic viral integration site-1 (Mecom, also known as Evi1), pre-B-cell leukemia homeobox 1 (Pbx1) and members of the homeobox A cluster (Hoxa) (Supplementary Fig. 1a). Notably, the gene encoding the Msi2 RNA-binding protein, which has been found to be fused with the HOXA9 locus as a result of chromosomal translocations in two individuals with blast crisis chronic myelogenous leukemia (CML-BC)4,5, was expressed fivefold higher in hematopoietic stem and progenitor cells relative to committed progenitor cells (Supplementary Fig. 1a). Msi2 expression is upregulated in leukemic progenitors transduced with Vp16/Meis1, a fusion of the Vp16 activation domain to the transcription factor Meis1, indicating that Msi2 might be a key gene for self-renewal in leukemia6.
The Msi proteins affect asymmetric cell division, germ and somatic stem cell function and cell fate determination in various somatic tissues7. The Msi gene family is evolutionarily conserved and encodes two closely related proteins, Msi1 and Msi2. Msi1 binds consensus motifs in the 3′untranslated regions of mRNAs, interacts with the poly(A)–binding protein and competes for eukaryotic initiation factor-4G, thereby interfering with translation initiation8. Msi1 can target developmental transcription factors and cell cycle regulators. Specifically, Msi1 directly binds and suppresses mRNA translation of Numb, a negative regulator of Notch signaling, which influences neural development9. Through an indirect mechanism, Msi1 increases growth factor signaling, leading to enhanced phosphorylation of extracellular signal-regulated kinase (Erk) in mammary epithelial progenitors2. Thus, Msi1 directly and indirectly affects multiple targets that influence both cell proliferation and cell fate decisions. The function and targets of Msi2 have not been characterized as extensively as for Msi1, although there is evidence supporting their functional redundancy in neural progenitor cells1.
RESULTS
MSI2 is expressed in HSCs
To understand the role of Msi2 in hematopoiesis, we characterized its expression by quantitative RT-PCR in fractionated cell populations from mouse bone marrow and spleen. We observed higher expression of Msi2 in populations enriched for hematopoietic stem cells compared to progenitor cells, differentiated myeloid cells and lymphocytes, confirming our microarray results (Fig. 1a)10. Msi1 mRNA was nearly undetectable by microarray and quantitative RT-PCR (Supplementary Fig. 1b,c). To test the role of Msi2 expression in hematopoiesis, we knocked down Msi2 with short hairpin RNA and confirmed its reduced expression in a leukemic cell line (Supplementary Fig. 1d). We then sorted, transduced and transplanted enriched hematopoietic stem and progenitor cell populations with shRNA vectors that co-expressed enhanced GFP (EGFP; Fig. 1b) into wild-type C57BL/6 mice. Six weeks after transplantation, we observed a reduced percentage of total EGFP+ cells in the peripheral blood and in long-term HSCs of the bone marrow relative to input populations and to mice engrafted with control shRNA–infected cells (Fig. 1c–d). Although we did not specifically assess homing of the HSCs, the reduced contribution of Msi-2–depleted cells was not likely due to a general defect in homing of hematopoietic cells to the bone marrow (Supplementary Fig. 1e). The loss of engraftment of Msi2-depleted HSCs indicates that Msi2 has a major role in HSC function after marrow transplantation.
Figure 1.
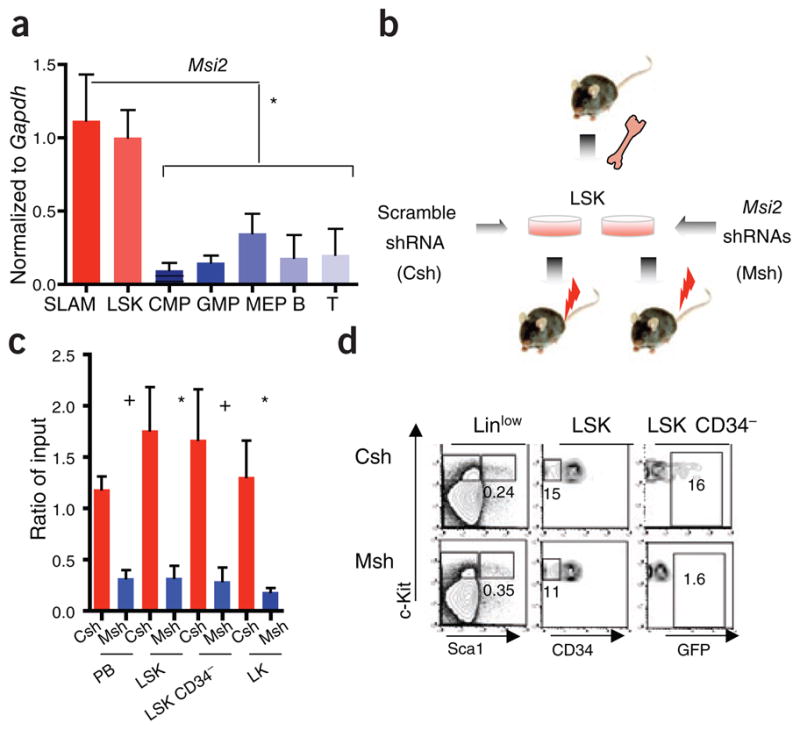
Msi2 is expressed in HSCs, and its depletion reduces engraftment in vivo. (a) Quantitative RT-PCR of Msi2 expression in purified hematopoietic populations. SLAM, CMP, common myeloid progenitor; GMP, granulocyte monocyte progenitor; MEP, myeloerythroid progenitor; B, T, lymphocytes. Error bars represent s.e.m. for at least four experiments. (b) Strategy for Msi2 shRNA knockdown in vivo. Viral vectors carrying control scrambled shRNA (Csh) or shRNAs targeting Msi2 (Msh) along with EGFP were transduced into LSK cells followed by transplant into lethally irradiated mice (red bolts). (c) Relative engraftment of whole peripheral blood (PB) and purified bone marrow stem and progenitor cell populations (LSK, Linlow Sca+ c-Kit+; long-term HSC, LSK CD34+; LK, LinlowSca−c-Kit+) by cells infected with shRNA (Msh or Csh at 6 weeks after transplant. The ratio of EGFP+ cells in the indicated populations is relative to input (representative of three independent transplants and at least eight mice; NS, not significant, +P < 0.05, *P < 0.01, statistical nomenclature used throughout subsequent figures). (d) Representative flow cytometric analysis of bone marrow stem and progenitor cells from engrafted mice at 6 weeks after transplant.
To examine how increased MSI2 expression might alter stem cell dynamics and to model human leukemia, we developed a transgenic mouse strain in which expression of human MSI2 is doxycycline inducible (Supplementary Figs. 2 and 3a)11,12. We verified dose-dependent, doxycycline-inducible expression of MSI2 both in vitro (Supplementary Fig. 3b) and in vivo (Supplementary Fig. 3c,d). We initially examined how MSI2 could alter hematopoietic progenitor cell function by performing in vitro colony-forming unit (CFU) assays with mouse bone marrow cells. When MSI2 expression was induced, we observed a significant decrease in multipotent granulocyte-erythroid-monocyte-megakaryocyte (CFU-GEMM) and megakaryocyte (CFU-MEG) colonies (P < 0.05) but no differences in granulocytic, monocytic or mixed granulocytic-monocytic colonies (Supplementary Fig. 3e). Moreover, we detected no change in the serial replating potential of progenitors (Supplementary Fig. 3f), suggesting that ectopic MSI2 expression did not provoke aberrant self-renewal. Flow cytometry of hematopoietic colonies formed in vitro showed decreased Gr1 and increased c-Kit staining, indicating a more immature myeloid phenotype, which was confirmed by inspection of cell morphology (Supplementary Fig. 3g,h). Myeloid cells formed in the presence of interleukin-3 or granulocyte-macrophage colony–stimulating factor alone were similarly immature (Supplementary Fig. 3i–k). Taken together, these in vitro data indicate that overexpression of MSI2 inhibits differentiation of early myeloid, megakaryocytic and granulocytic lineages.
MSI2 overexpression alters HSC function
To examine how increased MSI2 influences stem and progenitor cell function in vivo, we examined recipient mice that were reconstituted with bone marrow from control mice harboring a reverse tetracycline transactivator only (rtTA) or MSI2-transgenic mice. Six weeks after transplantation, we induced MSI2 overexpression with 5 d of doxycy-cline treatment and measured the acute effects in the stem and myeloid progenitor cell compartments of the bone marrow. We observed a significant increase in hematopoietic stem and progenitor cells (LSK cells) within bone marrow of MSI2-induced mice, in terms of both percentage (Fig. 2a and Supplementary Fig. 4a) and absolute cell numbers (Supplementary Fig. 4b). This coincided with a decrease in the percentage and number of the common myeloid progenitor and myeloid erythroid progenitor cells (Supplementary Fig. 4b,c). In the transplant recipients, MSI2 induction also increased the number of long-term HSCs (defined as SLAM: LSK and CD150+CD48−, or LSK and CD34−; Fig. 2b)10. We observed comparable effects in primary (nontransplanted) MSI2-inducible mice administered doxycycline for 5 d (Supplementary Fig. 5a,b). The quantitative expansion of total hematopoietic stem and progenitor (LSK) cells was accompanied by a decrease in the percentage of long-term HSCs, indicating a preferential expansion of the short-term HSC (Fig. 2a and Supplementary Fig. 4d). Consistent with this, the increase in HSC numbers was associated with a reduction in quiescent (G0) cell numbers and a concomitant increase in the percentage of G1 and cycling cells (S-G2-M) in both hematopoietic stem and progenitor cells and in long-term HSCs (Fig. 2c and Supplementary Fig. 4e). To further define the effects of MSI2 on stem cell proliferation, we sorted SLAM cells and multipotential progenitors (MPPs), (LSK, CD150−CD48−) and found that ectopic MSI2 expression increased the proliferation of MPPs but not long-term HSCs (Supplementary Fig. 4f). The observed expansion of MPPs is consistent with our previous in vivo results suggesting an expansion of the LSKs (Fig. 2a). The long-term HSCs and MPPs were not undergoing increased apoptosis in response to ectopic MSI2 activity (Supplementary Fig. 4g). We found an increase in the frequency of cobblestone area–forming cells, reflecting primitive hematopoietic progenitors, in MSI2-induced cells compared to control cells (Supplementary Fig. 4h), providing further evidence that MSI2 expression can lead to short-term progenitor cell expansion.
Figure 2.

Ectopic MSI2 expression compromises HSC function. Bone marrow from control rtTA (C) or MSI2-transgenic (M) mice was transplanted into irradiated CD45.1+ congenic mice. Six weeks after transplantation, doxycycline was given for 5 d, and bone marrow was analyzed for HSC and progenitor cells. (a) Representative flow cytometric plots, with percentages of cells expressing markers as indicated. The analyzed populations are indicated above the plots. (b) Quantification of long-term HSCs (SLAM: LSK CD150+CD48+ or LSK CD34−). (c) Cell cycle analysis performed with Hoechst and pyronin Y, gated on hematopoietic stem and progenitor cells (LSK cells) (representative experiment from at least seven mice; error bars, s.e.m.). (d) Gene set enrichment analysis (GSEA) on microarray data of MSI2-overexpressing LSKs (Supplementary Methods). (e) Determination of ERK phosphorylation in LSKs after stimulation with SCF. Representative plot shown; histogram indicates combined analysis of five mice from two independent experiments. (f) Determination of symmetric versus asymmetric cell divisions in purified LSKs. Immunofluorescence images stained for Numb (left) and DAPI (right) and bright field (middle). Scale bars, 10 μm. A quantification is presented as pie charts below the images (C, n = 4 experiments, 70% symmetric ± 9.2% (n = 58 cells) and M, n = 5 experiments, 33% symmetric ± 13.2% (n = 61 cells), P < 0.004). (g) White blood cell counts (WBC) in recipient mice administered doxycycline for the indicated lengths of time. Each point represents one mouse; the line indicates the mean WBC of the cohort. (h) Analysis of relative engraftment in peripheral blood after competitive transplants in which MSI2-transgenic (M), or control rtTA (C), bone marrow (CD45.2+) was mixed with competitor wild-type marrow (CD45.1+) at the indicated ratios. (i) Percentage CD45.2+ cells in the long-term HSC (LSK CD34−), LSK and LK cell compartments in the bone marrow of mice transplanted with a 3:1 ratio of MSI2- or rtTA-expressing (CD45.2+) cells to wild-type cells (CD45.1+) at 20 weeks after transplantation, +P < 0.05, **P < 0.001.
We performed transcriptome profiling in hematopoietic stem and progenitor cells to identify pathways activated by MSI2 expression using gene set enrichment analysis13. We found increased expression of RAS mitogen-activated protein kinase (Mapk)-, cyclin D1- and Myc-induced gene expression signatures in response to MSI2 induction (Fig. 2d and Supplementary Table 1). These data, in conjunction with a previous study indicating that Msi1 can alter Mapk signaling in mammary progenitors2, prompted us to stimulate hematopoietic stem and progenitor cells with stem cell factor (SCF), after which we observed enhanced phospho-Erk levels (Fig. 2e). The increased Erk signaling coincides with expansion of the HSCs. Asymmetric partitioning of Numb protein in HSCs that have recently undergone cell division is known to mark the more committed (Numb-positive) of the two daughter cells14. Because Numb is a known Msi1 target, we examined how MSI2 induction alters Numb localization during cell division14. The percentage of cells undergoing asymmetric Numb segregation increased in MSI2-expressing hematopoietic stem and progenitor cells (Fig. 2f), indicating commitment toward progenitor fate.
To further test the impact of MSI2 on stem cell function and maintenance of the hematopoietic system in vivo, we performed both whole-marrow and mixed competitive transplants with bone marrow from control rtTA and mice in which the MSI2 gene is doxycycline inducible. In initial experiments, we administered doxycycline starting 4 weeks after engraftment. Mice analyzed at 6 and 16 weeks showed reduced numbers of neutrophils, lymphocytes and platelets and increases in hematocrit and mean corpuscular volume (Fig. 2g and Supplementary Fig. 6a–f). In competitive transplants, MSI2-inducible or control rtTA bone marrow (CD45.2+) was mixed with CD45.1+ congenic competitor cells in either 1:1 or 3:1 ratios. As in the noncompetitive transplant setting, we observed a reduced contribution from MSI2-expressing cells in peripheral blood, with a 50% decrease in hematopoietic chimerism at both ratios (Fig. 2h). We observed this relative deficiency of MSI2-expressing CD45.2+ cells in myeloid, B and T lineages and at time points corresponding to reconstitution from both short-term and long-term HSCs (6 and 20 weeks, respectively; Supplementary Fig. 7a–d). A reduced contribution from MSI2-expressing cells was likewise directly analyzed in the long-term HSC and progenitor cell compartments 20 weeks after transplantation (Fig. 2i and Supplementary Fig. 8). Together, these data indicate that ectopic MSI2 expression drives proliferation of long-term HSCs toward progenitors, resulting in reduced stem cell pools.
MSI2 cooperates with BCR-ABL1 during leukemogenesis
Several recent reports have linked MSI family members to the pathogenesis of solid tumors. Expression of MSI1 is increased in pediatric brain tumors, and knockdown of MSI1 in the HCT116 colon adenocarcinoma cell line reduces tumor burden in vivo5,15. Mice transplanted with doxycycline-inducible MSI2 bone marrow and followed for 1 year with continuous doxycycline treatment did not develop leukemia, although spleen and liver weights were modestly increased (Supplementary Fig. 9a,b). Notably, however, we observed only minimal MSI2 overexpression in these mice after 1 year of doxycycline treatment, indicating that selection against cells expressing high amounts of MSI2 occurs over time (Supplementary Fig. 9c). To test whether MSI2 overexpression might transform immortalized cell lines in culture, we transduced the mouse interleukin-3–dependent pro-B cell line Ba/F3 with an MSI2-expressing retrovirus (Fig. 3a). We observed cytokine-independent growth, consistent with hematopoietic transformation (Fig. 3b). Thus, we hypothesized that MSI2 might potentiate transformation in hematopoietic cells in cooperation with other genetic lesions. To test whether MSI2 could cooperate with the CML-specific oncogene BCR-ABL1 to induce disease progression, we transduced doxycycline-inducible MSI2 bone marrow cells with BCR-ABL1 and assessed leukemia development after bone marrow transplantation. Doxycycline treatment was initiated 3 d after transplantation, and mice were killed within 14 d owing to a rapid and lethal myeloproliferative disease. When compared to transformation with BCR-ABL1 alone, concurrent expression of MSI2 resulted in increased tumor burden in the peripheral blood, bone marrow and spleen (Fig. 3c–f and Supplementary Fig. 10a,b), and flow cytometry of splenic cells revealed a shift toward a more immature myeloid phenotype (signified by the markers Mac1highGr1low; Fig. 3g and Supplementary Fig. 10c). Consistent with the observed increase in the immature Mac1highGr1low population, inspection of peripheral blood smears (Supplementary Fig. 10d) and analysis of bone marrow and spleen histology (Fig. 3h) showed increased numbers of leukemic blasts and infiltration with immature myeloid cells. In this mouse model, the leukemia-initiating cells (LICs) are defined as BCR-ABL1+Lin−c-Kit+Sca+ (ref. 16). However, despite the increased tumor burden in the mice subjected to transformation by both BCR-ABL1 and MSI2, we detected no difference in the number or frequency of phenotypic LICs (Supplementary Fig. 10e,f). Although not affecting the numbers of LICs, MSI2 seems to functionally alter the LIC compartment when expressed with BCR-ABL1, as MSI2 induces a more immature myeloid leukemia that resembles the accelerated or blastic phases of human CML.
Figure 3.

Ectopic MSI2 cooperates with BCR-ABL1 in promoting leukemia progression. (a) Immunoblot of BaF3 cells transduced with control vector MSCV-IRES-EGFP (MIG) or vector carrying MSI2 (M). (b) Numbers of EGFP+ BaF3 cells remaining 4 d after cytokine withdrawal. Representative of five independent experiments from two independent clones, details in Supplementary Methods. (c–f) Analysis of disease parameters including spleen and liver weight (c), white blood cell count (d) and bone marrow and spleen cellularity (e,f) in diseased mice killed at 14 d (representative of ten mice per group and two independent assays). (g) Flow cytometric analysis of spleen cells from leukemic mice, stained for Mac1 and Gr1 and gated on BCR-ABL1+GFP+ cells. Average percentages for the diseased cohort are indicated near gates for Mac1highGr1high and Mac1highGr1low populations, +P < 0.05, **P < 0.001. Supplementary Figure 10c contains statistical analyses. (h) H&E staining of bone marrow (BM) and spleen (SP) from diseased mice. Scale bars, 250 μm.
Given that MSI2 can act as a cooperating oncogene in our mouse model, we examined MSI2 expression in human leukemia and found MSI2 over-expression in cell lines from individuals with AML and CML-BC (Fig. 4a and Supplementary Fig. 11a). Knockdown experiments have implicated a functional role for MSI1 in several cancers17–19. To test the functional role of increased MSI2 expression in leukemic cells, we transduced several cell lines with lentiviral shRNA vectors targeting MSI2 (Supplementary Fig. 11b,c). Knockdown of MSI2 led to a decrease in proliferation in the AML cell lines NOMO-1 and THP-1 and the CML-BC cell lines AR230 and LAMA-84, and all four leukemic cell lines showed a marked induction of apoptosis, as assessed by annexin V staining (Fig. 4b,c and Supplementary Fig. 11b–d). Five days after MSI2 knockdown, LAMA-84 cells became more differentiated, as evidenced by increased expression of CD11b and CD16 (Fig. 4d and Supplementary Fig. 11d). We also observed increased NUMB protein amounts upon MSI2 knockdown, consistent with the reported role of MSI1 in suppressing NUMB mRNA translation (Supplementary Fig. 11c)9.
Figure 4.

Increased MSI2 expression in human myeloid leukemias is associated with aggressive disease and immature phenotype. (a) Immunoblot analysis in human AML cell lines, normal human bone marrow cell and granulocytes. The MSI2 doublet indicates two alternative isoforms from the MSI2 gene. (b) Cell proliferation in the indicated cell lines after infection with lentivirus expressing control or MSI2-specific shRNAs. Error bars indicate s.e.m. from at least five independent experiments per cell line scramble control (red) and two different shRNAs (blue). (c,d) Apoptosis and differentiation based on annexin staining and CD16, CD11b staining. A representative flow cytometric plot is shown in Supplementary Figure 11d; error bars represent s.e.m. from at least three independent experiments. +P < 0.05, *P < 0.01, **P < 0.001. (e) Analysis of Oncomine gene expression data with increased MSI2 expression in myeloid blast crisis (n = 33) versus chronic phase (n = 57, P < 0.001)24,30, accelerated phase (n = 9) and lymphoid leukemia (B-ALL; n = 6). (f) Survival analysis in human subjects (n = 436) of the Bullinger data set stratified by MSI2 expression. MSI2 high and low expression is detailed in the Supplementary Methods, (median survival, 693 d versus 238 d; P = 0.0004. (g) Survival analysis in human subjects (n = 163), in the Metzeler data set for the cohort of CN-AML divided by MSI2 expression27. (h) Unsupervised clustering of the MSI2 shRNA gene signature in the human subjects from the Bullinger data set in f. Gene expression patterns of the subjects with the positive cluster represents subjects that fit with the MSI2–knocked-down gene signature, whereas the negative cluster represents subjects that cluster into a separate group from the shRNA gene signature. Subjects with MSI2-high expression in red and MSI2-low expression in green are plotted above the clustering based on f. The FLT3 internal tandem mutation is indicated by blue lines, and NPM1 status is indicated with black lines. (i) Overall survival plot of positive correlation and negative correlation clusters from the MSI2 shRNA gene expression signature in h. P < 0.004.
To better understand the role of MSI2 in human leukemias, we assessed the gene expression profiles of the four human leukemia cell lines 72 h after MSI2 knockdown. As expected, MSI2 was the most downregulated gene (Supplementary Fig. 12a). Gene signatures that were significantly altered upon MSI2 knockdown include decreased expression of target genes downstream of each of the following pathways: Wnt, Ras-Mapk and Myc (Supplementary Fig. 12b–e and Supplementary Table 1)20–22. Notably, we found these pathways to be upregulated in mouse hematopoietic stem cells and progenitor cells overexpressing MSI2 (Fig. 2d and Supplementary Table 1). Additionally, we noted that a differentiation signature comprised of genes with higher expression in granulocyte monocyte progenitors compared to HSCs23 correlated positively with the gene expression profile of MSI2-knockdown leukemic cells (Supplementary Fig. 12f). Collectively, these data demonstrate that decreased MSI2 expression is associated with decreased expression of proliferation and survival genes, along with elevated expression of markers of myeloid differentiation.
Increased MSI2 expression associates with worse clinical prognosis
To determine whether aberrant MSI2 expression might also have a role in primary human leukemia, we examined MSI2 expression in a previously published gene expression data set obtained from individuals with CML24. Our examination of these data showed increased levels of MSI2 in CML-BC relative to chronic-phase CML (Fig. 4e). We found NUMB expression levels significantly lower than those of MSI2, in both chronic phase and blast crisis (P < 0.001) (Supplementary Fig. 12g). Increased Numb expression and reduced disease burden was previously observed in a study in which the hedgehog pathway was ablated in mouse BCR-ABL1–transduced HSCs25. Taken together, our data implicate increased levels of MSI2 in AML and CML-BC and establish an inverse correlation with NUMB expression.
We also examined MSI2 expression data derived from 436 individuals with AML. Expression of MSI2 was markedly associated with specific cytogenetic and molecular genetic aberrations. For example, subjects with AML with inversion of chromosome 16 showed lower MSI2 levels relative to other leukemia subgroups (P <0.05; Supplementary Fig. 13a), whereas MSI2 expression was higher in individuals harboring monosomy 7 (P < 0.001; Supplementary Fig. 13a). Furthermore, elevated MSI2 expression was associated with fms-related tyrosine kinase-3 (FLT3) internal tandem duplications and nucleophosmin-1 (NPM1) mutations but not with mixed-lineage-leukemia 1 partial tandem duplication (MLL-PTD) and CCAAT/enhancer binding protein alpha (CEBPa) (Supplementary Fig. 13b–e)26. More notably, subjects with AML with MSI2 mRNA expression above the median were characterized by worse clinical outcome (median overall survival, 405 d versus 845 d; P < 0.001, Fig. 4f and Supplementary Fig. 13f)26. This effect of MSI2 on prognosis was not due to its association with cytogenetic subgroups, as excluding the good-prognosis group harboring the inversion of chromosome 16 still yielded a significant result on prognosis (P < 0.01) (Supplementary Fig. 13g). In contrast to MSI2, MSI1 was not expressed in subjects with CML or AML or in the leukemic cell lines (Supplementary Fig. 14a–c and data not shown). Ultimately, multivariate Cox proportional-hazard regression analysis demonstrated that MSI2 is an independent prognostic marker in AML when considering age, French-American-British classification of leukemia pathology, cytogenetics and the mutation status of FLT3 and NPM1 (Supplementary Tables 2 and 3).
We confirmed the association between MSI2 expression and poor clinical prognosis in an independent cohort of subjects with AML with normal karyotype (Fig. 4g and Supplementary Table 4)27. In this data set, gene expression signatures from people with cytogenetically normal AML (CN-AML) and a poor clinical outcome positively correlated with gene expression signatures of people in the MSI2-high subset and negatively correlated with genes altered by MSI2 knockdown (Supplementary Fig. 15a and Supplementary Table 1)27. We selected the genes from the MSI2-knockdown expression signature and performed an unsupervised clustering of the AML samples; this defined two main clusters (Fig. 4h and Supplementary Table 5). The positive cluster correlated with the MSI2-knockdown signature in individuals with improved survival, whereas the negative cluster was associated with poor prognosis (Fig. 4i). Additionally, oncogenic and HSC gene expression signatures were positively correlated with those of individuals in the CN-AML high-MSI2-expression data set (Supplementary Fig. 15b and Supplementary Table 4).
DISCUSSION
In summary, we have shown by overexpression and knockdown strategies in both mouse and human systems that the mRNA-binding protein MSI2 influences proliferation and differentiation of HSCs and myeloid progenitors. Moreover, we have observed that dysregulated MSI2 expression is associated with aggressive myeloid leukemia, thereby implicating MSI2 as a previously unknown regulator of both normal and malignant hematopoiesis (Supplementary Fig. 16a,b). Several factors that regulate hematopoietic differentiation and progenitor cell fate determination, such as the transcription factors IKAROS and CCAAT/enhancer binding protein (CEBP) family members as well as microRNAs in the Let7 family, have been implicated in leukemogenesis by arresting differentiation and promoting self-renewal3,28,29. The MSI2 RNA-binding protein may act similarly to these factors by regulating HSC proliferation and maintaining an undifferentiated gene expression program in leukemia, contributing to poor clinical outcome. Targeting MSI2 may ultimately allow selective suppression of leukemic stem cell populations and provide a new therapeutic strategy in leukemia.
METHODS
Methods and any associated references are available in the online version of the paper at http://www.nature.com/nm/.
Supplementary Material
Acknowledgments
We would like to thank S. Armstrong (Children’s Hospital Boston) for valuable reagents. We would like to acknowledge T. Zhang, D. Kalaitzidis, K. Gritsman, P. Stern and S. Sykes for their critical suggestions and J.-A. Kwon for assistance with microarray processing. We would like to thank M. Wernig for his assistance with the project. M.G.K. was supported by the US National Institutes of Health (NIH) National Institute of Diabetes and Digestive and Kidney Diseases Career Development Award. This work was supported by grants from the NIH (D.G.G., R.J. and G.Q.D.), the Leukemia and Lymphoma Society (D.G.G. and G.Q.D.) and the Howard Hughes Medical Institute (D.G.G. and G.Q.D.). C.J.L. was supported by a Ruth L. Kirschstein Fellowship from the NIH.
Footnotes
Accession codes. All microarray experiments have been deposited in the Gene Expression Omnibus (GEO) database under superSeries accession number GSE22778.
Note: Supplementary information is available on the Nature Medicine website.
AUTHOR CONTRIBUTIONS
M.G.K. led the project, performed the experiments and wrote the manuscript; C.J.L. performed experiments and revised the manuscript; F.A.-S. performed data analysis; L.B. provided clinical samples and microarray analysis; B.B., S.Z., K.M., W.T., M.P., R.O., M.G., W.E., C.S. and S.F. performed experiments; S.W.L. and M.F. provided pathology analysis; B.L.E. provided suggestions and project oversight; D.G.G., R.J. and G.Q.D. co-directed the project and revised the manuscript.
COMPETING FINANCIAL INTERESTS
The authors declare no competing financial interests.
Reprints and permissions information is available online at http://npg.nature.com/reprintsandpermissions/.
References
- 1.Sakakibara S, et al. RNA-binding protein Musashi family: roles for CNS stem cells and a subpopulation of ependymal cells revealed by targeted disruption and antisense ablation. Proc Natl Acad Sci USA. 2002;99:15194–15199. doi: 10.1073/pnas.232087499. [DOI] [PMC free article] [PubMed] [Google Scholar]
- 2.Wang XY, et al. Musashi1 modulates mammary progenitor cell expansion through proliferin-mediated activation of the Wnt and Notch pathways. Mol Cell Biol. 2008;28:3589–3599. doi: 10.1128/MCB.00040-08. [DOI] [PMC free article] [PubMed] [Google Scholar]
- 3.Tenen DG. Disruption of differentiation in human cancer: AML shows the way. Nat Rev Cancer. 2003;3:89–101. doi: 10.1038/nrc989. [DOI] [PubMed] [Google Scholar]
- 4.Barbouti A, et al. A novel gene, MSI2, encoding a putative RNA-binding protein is recurrently rearranged at disease progression of chronic myeloid leukemia and forms a fusion gene with HOXA9 as a result of the cryptic t(7;17)(p15;q23) Cancer Res. 2003;63:1202–1206. [PubMed] [Google Scholar]
- 5.Hemmati HD, et al. Cancerous stem cells can arise from pediatric brain tumors. Proc Natl Acad Sci USA. 2003;100:15178–15183. doi: 10.1073/pnas.2036535100. [DOI] [PMC free article] [PubMed] [Google Scholar]
- 6.Wang GG, Pasillas MP, Kamps MP. Persistent transactivation by meis1 replaces hox function in myeloid leukemogenesis models: evidence for co-occupancy of meis1-pbx and hox-pbx complexes on promoters of leukemia-associated genes. Mol Cell Biol. 2006;26:3902–3916. doi: 10.1128/MCB.26.10.3902-3916.2006. [DOI] [PMC free article] [PubMed] [Google Scholar]
- 7.Okano H, et al. Function of RNA-binding protein Musashi-1 in stem cells. Exp Cell Res. 2005;306:349–356. doi: 10.1016/j.yexcr.2005.02.021. [DOI] [PubMed] [Google Scholar]
- 8.Kawahara H, et al. Neural RNA-binding protein Musashi1 inhibits translation initiation by competing with eIF4G for PABP. J Cell Biol. 2008;181:639–653. doi: 10.1083/jcb.200708004. [DOI] [PMC free article] [PubMed] [Google Scholar]
- 9.Imai T, et al. The neural RNA-binding protein Musashi1 translationally regulates mammalian numb gene expression by interacting with its mRNA. Mol Cell Biol. 2001;21:3888–3900. doi: 10.1128/MCB.21.12.3888-3900.2001. [DOI] [PMC free article] [PubMed] [Google Scholar]
- 10.Kiel MJ, Yilmaz OH, Iwashita T, Terhorst C, Morrison SJ. SLAM family receptors distinguish hematopoietic stem and progenitor cells and reveal endothelial niches for stem cells. Cell. 2005;121:1109–1121. doi: 10.1016/j.cell.2005.05.026. [DOI] [PubMed] [Google Scholar]
- 11.Hochedlinger K, Yamada Y, Beard C, Jaenisch R. Ectopic expression of Oct-4 blocks progenitor-cell differentiation and causes dysplasia in epithelial tissues. Cell. 2005;121:465–477. doi: 10.1016/j.cell.2005.02.018. [DOI] [PubMed] [Google Scholar]
- 12.Beard C, Hochedlinger K, Plath K, Wutz A, Jaenisch R. Efficient method to generate single-copy transgenic mice by site-specific integration in embryonic stem cells. Genesis. 2006;44:23–28. doi: 10.1002/gene.20180. [DOI] [PubMed] [Google Scholar]
- 13.Subramanian A, et al. Gene set enrichment analysis: a knowledge-based approach for interpreting genome-wide expression profiles. Proc Natl Acad Sci USA. 2005;102:15545–15550. doi: 10.1073/pnas.0506580102. [DOI] [PMC free article] [PubMed] [Google Scholar]
- 14.Wu M, et al. Imaging hematopoietic precursor division in real time. Cell Stem Cell. 2007;1:541–554. doi: 10.1016/j.stem.2007.08.009. [DOI] [PMC free article] [PubMed] [Google Scholar]
- 15.Sureban SM, et al. Knockdown of RNA binding protein musashi-1 leads to tumor regression in vivo. Gastroenterology. 2008;134:1448–1458. doi: 10.1053/j.gastro.2008.02.057. [DOI] [PubMed] [Google Scholar]
- 16.Huntly BJ, et al. MOZ-TIF2, but not BCR-ABL, confers properties of leukemic stem cells to committed murine hematopoietic progenitors. Cancer Cell. 2004;6:587–596. doi: 10.1016/j.ccr.2004.10.015. [DOI] [PubMed] [Google Scholar]
- 17.Kanai R, et al. Augmented therapeutic efficacy of an oncolytic herpes simplex virus type 1 mutant expressing ICP34.5 under the transcriptional control of musashi1 promoter in the treatment of malignant glioma. Hum Gene Ther. 2007;18:63–73. doi: 10.1089/hum.2006.107. [DOI] [PubMed] [Google Scholar]
- 18.Nikpour P, et al. The RNA binding protein Musashi1 regulates apoptosis, gene expression and stress granule formation in urothelial carcinoma cells. J Cell Mol Med. 2010 May 14; doi: 10.1111/j.1582-4934.2010.01090.x. published online. [DOI] [PMC free article] [PubMed] [Google Scholar]
- 19.Kanai R, et al. Enhanced therapeutic efficacy of oncolytic herpes vector G207 against human non-small cell lung cancer–expression of an RNA-binding protein, Musashi1, as a marker for the tailored gene therapy. J Gene Med. 2006;8:1329–1340. doi: 10.1002/jgm.965. [DOI] [PubMed] [Google Scholar]
- 20.Creighton CJ. Multiple oncogenic pathway signatures show coordinate expression patterns in human prostate tumors. PLoS One. 2008;3:e1816. doi: 10.1371/journal.pone.0001816. [DOI] [PMC free article] [PubMed] [Google Scholar]
- 21.Bild AH, et al. Oncogenic pathway signatures in human cancers as a guide to targeted therapies. Nature. 2006;439:353–357. doi: 10.1038/nature04296. [DOI] [PubMed] [Google Scholar]
- 22.Guo J, Jin J, Cooper LF. Dissection of sets of genes that control the character of wnt5a-deficient mouse calvarial cells. Bone. 2008;43:961–971. doi: 10.1016/j.bone.2008.06.011. [DOI] [PubMed] [Google Scholar]
- 23.Krivtsov AV, et al. Transformation from committed progenitor to leukaemia stem cell initiated by MLL-AF9. Nature. 2006;442:818–822. doi: 10.1038/nature04980. [DOI] [PubMed] [Google Scholar]
- 24.Radich JP, et al. Gene expression changes associated with progression and response in chronic myeloid leukemia. Proc Natl Acad Sci USA. 2006;103:2794–2799. doi: 10.1073/pnas.0510423103. [DOI] [PMC free article] [PubMed] [Google Scholar]
- 25.Zhao C, et al. Hedgehog signalling is essential for maintenance of cancer stem cells in myeloid leukaemia. Nature. 2009;458:776–779. doi: 10.1038/nature07737. [DOI] [PMC free article] [PubMed] [Google Scholar]
- 26.Bullinger L, et al. Use of gene-expression profiling to identify prognostic subclasses in adult acute myeloid leukemia. N Engl J Med. 2004;350:1605–1616. doi: 10.1056/NEJMoa031046. [DOI] [PubMed] [Google Scholar]
- 27.Metzeler KH, et al. An 86-probe-set gene-expression signature predicts survival in cytogenetically normal acute myeloid leukemia. Blood. 2008;112:4193–4201. doi: 10.1182/blood-2008-02-134411. [DOI] [PMC free article] [PubMed] [Google Scholar]
- 28.Mullighan CG, et al. BCR-ABL1 lymphoblastic leukaemia is characterized by the deletion of Ikaros. Nature. 2008;453:110–114. doi: 10.1038/nature06866. [DOI] [PubMed] [Google Scholar]
- 29.Viswanathan SR, et al. Lin28 promotes transformation and is associated with advanced human malignancies. Nat Genet. 2009;41:843–848. doi: 10.1038/ng.392. [DOI] [PMC free article] [PubMed] [Google Scholar]
- 30.Kang H, et al. Gene expression classifiers for relapse-free survival and minimal residual disease improve risk classification and outcome prediction in pediatric B-precursor acute lymphoblastic leukemia. Blood. 2009;115:1394–1405. doi: 10.1182/blood-2009-05-218560. [DOI] [PMC free article] [PubMed] [Google Scholar]
Associated Data
This section collects any data citations, data availability statements, or supplementary materials included in this article.