

Abstract
The mTOR mediated PI3K/AKT/mTOR signal transduction pathway has been demonstrated to play a key role in a broad spectrum of cancers. Starting from the mTOR selective inhibitor 1 (Torin1), a focused medicinal chemistry effort led to the discovery of an improved mTOR inhibitor 3 (Torin2), which possesses an EC50 of 0.25 nM for inhibiting cellular mTOR activity. Compound 3 exhibited 800-fold selectivity over PI3K (EC50: 200 nM) and over 100-fold binding selectivity relative to 440 other protein kinases. Compound 3 has significantly improved bioavailability (54%), metabolic stability and plasma exposure relative to compound 1.
Introduction
The Mammalian Target of Rapamycin (mTOR) is a highly conserved serine/threonine protein kinase and is a key element in the PI3K/AKT/mTOR signal pathway.1 Upon activation by extra cellular inputs such as insulin, energy stress, growth factors and nutrients, mTOR regulates a variety of fundamental cellular processes such as proliferation, growth and metabolism.2,3 mTOR is a member of PIKK kinase family, which also includes PI3K, ATR, ATM, DNA-PK and SMG-1. Structurally their catalytic domains all share high sequence identity to the PI3K kinase but differ significantly in sequence and secondary structure from the protein kinases.4 In cells mTOR exists in at least two functionally distinct protein complexes, mTORC1 and mTORC2. The mTORC1 complex is composed of Raptor, LST8, PRAS40 and Deptor and is responsible for regulated protein synthesis through phosphorylation of S6K1 and 4E-BP1. The mTORC2 complex consists of Rictor, LST8, SIN1, Deptor and Protor and regulates cell proliferation and survival through phosphorylation of Akt/PKB.5 The PI3K/Akt/mTOR signal transduction pathway is frequently deregulated in human cancers and thereby has attracted considerable attention as an oncology drug discovery target.6,7,8,9
Successful development of rapalogs (rapamycin and related analogs) as treatments of specific cancers has provided clinical validation of mTOR as an anti-cancer drug discovery target.10 However, existing rapalogs do not fully inhibit mTORC1 and are unable to acutely inhibit mTORC2.11,12 In addition, a negative feedback loop exists through S6K/IRS1/PI3K that results in pathway activation upon inhibition of mTORC1 by rapamycin which may also serve to limit the efficacy of the rapalogs.13 There is currently great interest in clinically testing the hypothesis that ATP-competitive mTOR inhibitors will exhibit more broad-based and profound anti-tumor activity relative to the rapalogs. In the recent years there has been a significant investment in developing potent and selective mTOR inhibitors which has resulted in compounds such as 2-(4-amino-1-isopropyl-1H-pyrazolo[3,4-d]pyrimidin-3-yl)-1H-indol-5-ol(PP242),14 (5-(2-((2R,6S)-2,6-dimethylmorpholino)-4-morpholinopyrido[2,3-d]pyrimidin-7-yl)-2-methoxyphenyl)methanol(KU63794),15 (5-(2,4-bis((S)-3-methylmorpholino)pyrido[2,3-d]pyrimidin-7-yl)-2-methoxyphenyl)methanol (AZD8055),16 methyl 4-(1-(1-(methoxycarbonyl)piperidin-4-yl)-4-morpholino-1H-pyrazolo[3,4-d]pyrimidin-6-yl)phenylcarbamate (WYE-354),17 (1s,4s)-4-(4-amino-5-(7-methoxy-1H-indol-2-yl)imidazo[1,5-f][1,2,4]triazin-7-yl)cyclohexanecarboxylic acid (OSI-027),18 1-(4-(8-oxa-3-azabicyclo[3.2.1]octan-3-yl)-1-(1,4-dioxaspiro[4.5]decan-8-yl)-1H-pyrazolo[3,4-d]pyrimidin-6-yl)-3-methylurea (WYE-125132),19 (E)-4-((2-(4,6-dimorpholino-1,3,5-triazin-2-yl)hydrazono)methyl)-2,6-dimethoxyphenol (KU-BMCL-200908069-1),20 1-(4-(4-(8-oxa-3-aza-bicyclo[3.2.1]octan-3-yl)-1-(2,2,2-trifluoroethyl)-1H-pyrazolo[3,4-d]pyrimidin-6-yl)phenyl)-3-(4-(4-methylpiperazin-1-yl)phenyl)urea (Wyeth-BMCL-200910096-27),21 and compound 1. 22
Compound 1 is a highly potent and selective mTOR inhibitor that exhibits the ability to inhibit mTOR in vivo. However the low yielding synthetic route, poor water solubility, short half-life (T1/2), and low oral bioavailability limits the use of 1 as a pharmacological tool in vivo. In order to address some of these deficiencies we initiated a medicinal chemistry campaign that resulted in the identification of a highly potent and selective mTOR inhibitor 3 (Torin2), which is easier to produce on scale and exhibits improved pharmacokinetic properties which should enable it use in vivo experiments.
Results and discussion
Compound 1 exhibits very rapid metabolism upon incubation with mouse and human hepatocytes (T1/2 of 4 min) which suggests that the compound may be subject to rapid first-pass metabolism in the liver. Consistent with this finding, the observed half-life following intravenous delivery of 1 to mice was 30 minutes. Oral administration of 1 revealed that the compound possessed very limited oral bioavailability. We reasoned that if we could reduce the molecular weight of 1, we might remove sites of metabolism and also obtain a more water soluble compound. Replacement of the propionyl-piperazine moiety of 1 with a fluorine yielded compound 2 which maintained potent cellular mTOR (EC50: 25 nM) inhibitory activity and selectivity versus PI3K (EC50: >1250 nM). The isolated mouse microsome stability of compound was significantly improved compared to 1 (T1/2 of 17.7 min) (Table 1). This result encouraged us to prepare a focused series of analogs with replacements to the quinoline moiety which ultimately resulted in the identification of 3 (Figure 1).
Table 1.
Pharmacological characterization of compound 1 and 2.a
| Entry | mTORC1 IC50(nM) | mTOR EC50(nM) | PI3K EC50(nM) | Mouse microsome stability T1/2(min) |
|---|---|---|---|---|
| 1 | 0.29 | 2 | 1800 | 4 |
| 2 | 37.1 | 25 | >1250 | 17.7 |
Determinations are the mean of two of independent measurements with standard error of <20%,
Figure 1. Representative structure of library.

The targeted library was generated using a four-step synthetic sequence which commenced from 4-chloro-6-bromo-quinoline compound 4. A nucleophilic substitution with appropriate anilines provided general intermediates 5, which was subsequently subjected to NaBH4 reduction to afford the alcohol compounds 6. Benzylic alcohol oxidation with MnO2 followed by Horner-Wadsworth-Emmons olefination furnished the tricyclic core scaffold 7. Finally variation of the Ar2 position was achieved using palladium mediated coupling reactions to afford the target compounds 8.
Reagents and conditions: 1. Appropriate aniline, 1,4-dioxane, 90°C, 4-12 h; 2. NaBH4, EtOH, rt, 2-4 h; 3. a) MnO2, CH2Cl2, rt, 2-6 h, b) triethyl phosphonoacetate, K2CO3, EtOH, 100 °C, 12h; 4. Ar2B(OH)2, PdCl2(Ph3P)2, Na2CO3, 1,4-dioxane, 80 °C, 4-12 h.
By variation the substitutions of the Ar1 and Ar2 groups, a focused library was generated (Figure 1) and the biological characterizations are summarized in table 2.
Table 2.
Enzymatic and cellular activities of compounds 3,9-31a
| Entry | R1 (para) |
R2 (meta) |
R3 (ortho) |
Ar2 | mTORC1 IC50(nM) | mTOR EC50(nM) | PI3K EC50(nM) |
|---|---|---|---|---|---|---|---|
| 9 | F | CF3 | H |  |
4.6 | 10 | >1250 |
| 10 | F | CF3 | H |  |
69.3 | 50 | 1000 |
| 11 | F | CF3 | H | 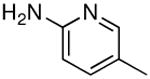 |
2.9 | 1 | 250 |
| 12 | F | CF3 | H | 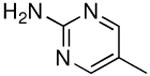 |
16.4 | 1 | 500 |
| 13 | F | CF3 | H | 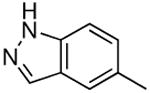 |
76.0 | 25 | 500 |
| 14 | F | CF3 | H | 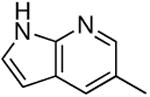 |
15.2 | 1 | 750 |
| 15 | F | CH3 | H |  |
35.5 | 10 | 1000 |
| 16 | F | CH3 | H | 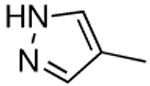 |
7.0 | 10 | >1250 |
| 17 | F | CH3 | H | 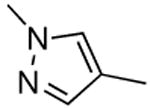 |
59.5 | 50 | 1000 |
| 18 | F | CH3 | H | 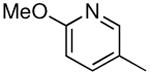 |
77.8 | 20 | 1000 |
| 19 | F | CH3 | H |  |
303 | 20 | >1250 |
| 20 | F | CH3 | H |  |
43.0 | 10 | >1250 |
| 21 | F | CH3 | H |  |
2.2 | 2 | 250 |
| 22 | F | Cl | H |  |
26.7 | 10 | 500 |
| 23 | F | Cl | H |  |
79.2 | 50 | 1000 |
| 24 | F | Cl | H | 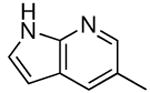 |
1.4 | 1 | 750 |
| 25 | F | Cl | H |  |
2.5 | 1 | 750 |
| 26 | F | Cl | H |  |
24.4 | 2 | 250 |
| 27 | F | F | H |  |
18.9 | 5 | 750 |
| 28 | F | F | H | 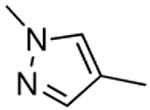 |
84.4 | 100 | 1000 |
| 29 | F | H | CF3 | 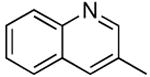 |
4.8 | 25 | >1250 |
| 30 | F | H | CF3 |  |
107.5 | 250 | 1250 |
| 31 | F | H | CF3 | 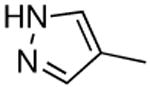 |
19.2 | 35 | 1250 |
| 3 | H | CF3 | H |  |
2.1 | 0.25 | 200 |
the IC50 determinations are the mean of two of independent measurement with standard error of <20%,
Substitution of the acyl piperazine ring with fluoro at the R1 position (compound 2) resulted in a 10-fold loss of potency in cellular mTOR assays. Replacement of the quinoline side chain at the Ar2 position with pyrazole (9) and methyl pyrazole (10) resulted in 5-25-fold reduction in activity. Replacement of the quinoline of 2 with aminopyridine (11), aminopyrimidine (12) and 7-azo-indole (14) groups resulted in compounds with potent mTOR inhibitory activity. However compounds 11 and related analogs demonstrated higher PI3K inhibitory activity. Indazole replacement (13) resulted in 10-fold loss of potency relative to 14 indicating that a beta nitrogen was required for the activity potentially suggesting a hydrogen-bond accepting moiety is required at this position. A similar activity trend was observed when CF3 was substituted with CH3 (15-21) at the R2 position. 7-azo-indole analog (21) possessed the most potent mTOR inhibitory activity but also exhibited significant activity against PI3K. Replacement of CF3 with smaller groups such as Cl (22-26) and F (27,28) resulted in compounds with similar potency against mTOR and PI3K. 7-aza-indole analog (24) and aminopyrimidine analog (25) exhibited the best potency as inhibitors of mTOR while still possessing more than 500 fold selectivity relative to PI3K. Introduction of the CF3 group at R3 position (29-31) resulted in a 20-100 fold loss of activity against mTOR suggesting either steric impediments to substitution at this position or unfavorable effects on the conformation of the compound. Removal of F from the R1 position while maintaining the aminopyridine side chain (3) resulted in the best balance of highly potent inhibition of mTOR(EC50 0.25 nM) while maintaining 800-fold selectivity relative to PI3K (EC50 200 nM).
We attempted to rationalize the observed structure-activity relationship (SAR) by docking compound 3 into a homology model of mTOR built using a PI3Kγ crystal structure (PDB code 3DBS) (Figure 2A). Similar to 1,22 compound 3 is predicted to engage in a ‘hinge’ hydrogen bond with V2240 using the quinoline nitrogen as well as engage a second hydrogen bond between Y2225 and pyridine nitrogen inside inner hydrophobic pocket. In addition, two hydrogen bonds are predicted to exist between the aniline amino group of 3 with D2195 and D2357 in the inner hydrophobic pocket and this may provide an explanation for the approximate 10-fold potency increase in mTOR inhibition compared to 1. The same binding mode was observed in PI3Kγ modeling study with compound 3. V882 served as a hinge binding point and in the inner hydrophobic pocket Y867, D841 and D964 provided three more hydrogen bonds with aminopyridine side chain analogous to Y2225, D2195 and D2357 of mTOR. This may provide a rationale for why compound 3 begins to inhibit PI3K. (Figure 2B)
Figure 2.

Model of 3 (green sticks) docked into a homology model of mTOR (grey ribbons) (A) and PI3Kγ (PDB 3DBS) (grey ribbons) (B). Potential hydrogen bonds are shown with hatched red lines.
Pharmacodynamics and Pharmacokinetics
In order to determine which compounds might be optimal for use in murine tumor studies, we selected a set of compounds based on the mTOR activity, selectivity over PI3K, synthetic feasibility and structural diversity. First the compounds were evaluated for their stability when incubated in the presence of isolated mouse liver microsomes. A subset of compounds were then advanced into pharmacodynamic (PD) studies monitoring the phosphorylation status of S6K T389 and Akt T308 in the lung and liver by western blot six hours after oral administration. The pharmacodynamic response was approximately scored with 1 being assigned a “+++” score (“++++” indicates over 95%, “+++” indicates 80-95%, “++” indicates 60-80 % and “+” indicates 40-60 % inhibition of pS6K and pAkt compared to vehicle). The results are summarized in table 3. Compounds 3, 9, 14, 16 and 17 exhibited similar or better pharmacodynamic effects relative to 1 while compounds 2, 15, 23 and 24 were less effective than 1. Compounds 19, 21, 25, 26, 27 and 28 did not exhibit inhibition of the S6K or Akt phosphorylation after 6 hours. The liver microsome stability results varied significantly amongst the compounds. Compounds 2, 3, 19, 25, 26 and 27 all exhibited more than a 10 min half-life but this did not predict which compounds would exhibit a robust pharmacodynamic effect. Several compounds such as 19, 25, 26 and 27 exhibited poor pharmacodynamics despite having superior microsome stability relative to 1 while other very short-lived compounds such as 9, 14, 16 and 17 exhibited more sustained pharmacodynamics. The basis for this discrepancy is currently unknown but may result from a sustained mTOR inhibition due to a slow off-rate from the kinase for some compounds. The oral PD studies employed a different formulation (10%NMP, 40% PEG in water) relative to the oral PK studies (0.5% w/v Na CMC with 0.1% w/v Tween-80) so the degree of drug exposure in the PD studies can not be directly extrapolated from the PK studies.
Table 3.
Pharmacodynamics and liver microsome stability of selected compounds.
| Entry | Structure | PD | T1/2(min) | PI3K/mTOR (Selectivity fold) |
|---|---|---|---|---|
| 2 |  |
++ | 11.7 | 50 |
| 3 | 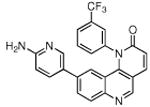 |
++++ | 11.7 | 800 |
| 9 |  |
+++ | 4.2 | 125 |
| 14 |  |
++++ | 1.5 | 750 |
| 15 | 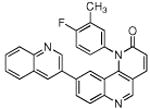 |
++ | 3.3 | 100 |
| 16 |  |
++++ | 3.2 | 83 |
| 17 |  |
++++ | 2.7 | 20 |
| 19 | 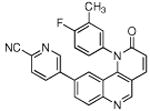 |
None | 14.4 | 62.5 |
| 21 |  |
None | 1.8 | 125 |
| 23 |  |
++ | 3.7 | 20 |
| 24 | 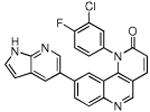 |
++ | 2.1 | 750 |
| 25 |  |
None | 20.6 | 750 |
| 26 |  |
None | 14.5 | 500 |
| 27 | 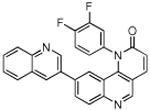 |
None | 22.9 | 150 |
| 28 |  |
None | 4.5 | 10 |
Compounds that exhibited the best pharmacodynamic properties were subject to pharmacokinetic evaluation in mice following intravenous and oral administration (Table 4). As has been predicted by the mouse liver microsome stability study, all compounds exhibited a half-life of less than 2 hours when dosed to male Swiss albino mice. Compound 3 exhibited the best bioavailability (51%) and overall exposure despite possessing a short half-life and was selected for further evaluation. Compared to compound 1, the bioavailability of 3 was improved by approximately 10-fold.22 Most of the compounds exhibited rapid absorption following oral administration to mice. All the compounds studied had low to moderate clearance and exhibited volumes of distribution close to the total body water. The possible reasons for the low bioavailability for the majority of the compounds could be poor absorption which may be due to the limited water solubility of the compounds.
Table 4.
PK properties of selected compounds.a
| Entry | Cmax (ng/mL) I.V./P.O. |
Tmax (h) PO |
AUC (h*ng/mL) I.V./P.O. |
T1/2 (h) I.V. |
CL (mL/min/Kg) I.V. |
Vss (L/Kg) I.V. |
F (%) P.O. |
|---|---|---|---|---|---|---|---|
| 3 | 1540/3968 | 0.25 | 850/4311 | 0.72 | 19.6 | 1.0 | 51 |
| 9 | 426/430 | 0.5 | 391/755 | 0.63 | 42.6 | 2.42 | 19.2 |
| 14 | 1639/98 | 1.0 | 803/352 | 1.09 | 20.8 | 1.30 | 4.2 |
| 16 | 1035/853 | 0.5 | 1110/2410 | 1.46 | 15.0 | 1.16 | 21.6 |
| 17 | -/1039 | 0.5 | 728/2068 | 0.99/1.31 | 22.9 | 1.08 | 28 |
C57BL/6 male mouse was dosed at 1 mg/kg for the intravenous (IV), 10 mg/kg for the oral (PO).
Kinase Selectivity profiling
To characterize the kinase selectivity of 3 we profiled its ability to bind to a panel of 440 kinases using the Ambit KinomeScan™ technology23 (Table 5). Compound 3 exhibited excellent overall selectivity (S(5) score(1 μM) = 0.02)24 and has strong binding to mTOR(4.6), CSNK1E(2.7), several PI3Ks(0-3.5), CSF1R(2.4) and MKNK2(0.9). Compound 3 was subject to further profiling against a panel of lipid kinases using the Invitrogen SelectScreen® technology which exhibited potent biochemical inhibition of PI3Ks and DNA-PK in addition to mTOR (Table 6). From our cellular PI3K assays we know there is approximately at 40-fold discrepancy between the biochemical PI3K IC50 and the cellular EC50. It remains to be determined whether DNA-PK is inhibited by 3 in cellular assays. It is interesting to note that the enzymatic selectivity ratio for inhibition of mTor versus PI3K for both 3 (enzyme ratio = 2) and Torin1 (enzyme ratio =60)22 substantially underestimates the observed ratio for cellular inhibition of these targets: 3 (cell ratio = 800) and Torin1 (cell ratio = 900).
Table 5.
Kinome Scan™ profile of 3a
| Kinase | % control | Kinase | % control |
|---|---|---|---|
| mTOR | 4.6 | CSF1R | 2.4 |
| CSNK1E | 2.7 | MKNK2 | 0.9 |
| PIK3C2G | 3.5 | PIK3CA | 0.55 |
| PIK3CA(C420R) | 0.1 | PIK3CA(E542K) | 0.25 |
| PIK3CA(E545K) | 0.25 | PIK3CA(H1047L) | 0 |
| PIK3CA(H1047Y)) | 1.4 | PIK3CA(I800L) | 0 |
| PIK3CA(M1043I) | 1 | PIK3CA(Q546K) | 0.35 |
| PIK3CG | 0.2 | PIK4CB | 1.7 |
Compound 3 was profiled at a concentration of 1 μM against a diverse panel of 442 kinases by Ambit Biosciences
Table 6.
LanthaScreen™ profile of 3 using the invitrogen lipid kinase panela
| Kinase | IC50(nM) | Kinase | IC50(nM) |
|---|---|---|---|
| PI4K α | >10000 | P110 α/p85α | 4.68 |
| PI4K β | 18.3 | P110δ/P85α | 17.5 |
| PI3K-C2 α | 28.1 | P110γ | 5.67 |
| PI3K-C2β | 24.5 | DNA-PK | 0.5 |
| hVPS34 | 8.58 | mTOR | 2.81 |
Kinase targets were tested with biochemical enzymatic kinase assays using the SelectScreen® Kinase Profiling Service (Life Technologies Corporation, Madison, WI)
Conclusion
Starting from the selective mTOR inhibitor 1, we used a focused medicinal chemistry approach guided by cellular assays and pharmacokinetic and pharmacodynamic assays to develop 3 which possesses properties that make it more suitable for use in murine tumor studies. Compound 3 possesses a 250 pM EC50 for inhibiting mTOR in cells while maintaining 800-fold cellular selectivity relative to inhibition of PI3K and most other protein kinases. Compound 3 exhibits good bioavailability and exposure and can maintain strong inhibition of mTOR activity in lung and liver to at least six hours after a single dose of 20 mg/kg. Compound 3 is a useful pharmacological tool for further exploring the therapeutic potential of mTOR inhibitors for the treatment of cancer.
Experimental Procedures
Chemistry
All solvents and reagents were used as obtained. 1H NMR spectra were recorded with a Varian Inova 600 NMR spectrometer and referenced to dimethyl sulfoxide. Chemical shifts are expressed in ppm. In the NMR tabulation, s indicates singlet; d, doublet; t, triplet; q, quartet; m, multiplet; and br, broad peak. Mass spectra were measured with Waters Micromass ZQ using an ESI source coupled to a Waters 2525 HPLC system operating in reverse mode with an Waters Sunfire™ C18 5μm 4.6×50 mm column. Purification of compounds was performed with either a Teledyne ISCO combiflash Rf system or a Waters Micromass ZQ preparative system. The purity of all compounds was ≥95%. The purity was analyzed on an above mentioned Waters LC-MS Symmetry (C18 column, 4.6 × 50 mm, 5μM) using a gradient of 5-95% acetonitrile in water containing 0.05% trifluoacetic acid (TFA) over 8 min (10 min run time) at a flow rate of 2 mL/min.
General procedure for the preparation of compounds
To a solution of compound 4 (ethyl 6-bromo-4-chloroquinoline-3-carboxylate, 1 eq.) in 1,4-dioxane at room temperature in a sealed tube was added aniline (1 eq.). The resultant solution was heated to 90 °C for 4-12 h. After cooled down to room temperature, a solution of NaOH (1 N) was added to neutralize the solution followed by dilution with water and extraction with ethyl acetate. After drying with Na2SO4, the solvents were removed and the residue was purified by ISCO (Hexanes: EtOAc) to furnish compound 5.
To a solution of compound 5 (1 eq.) in EtOH at room temperature was added NaBH4(10 eq.), the resultant solution was stirred at room temperature for 2-4 h before diluted with EtOAc and filtered through celite. The filtrate was concentrated under vacuum and the residue was dissolved in EtOAc and brine. After separation, the organic layer was dried over MgSO4 and concentrated under vacuum. The residue was purified by ISCO (hexanes: EtOAc) to afford compound 6.
To a solution of compound 6 in CH2Cl2 (1 eq.) at room temperature was added MnO2 (5 eq. mass). After 2-6 h, the reaction mixture was filtered through celite. The filtrate was concentrated in a sealed tube and dissolved in dry EtOH after which, K2CO3 (3 eq.) and triethyl phosphonoacetate were added. The resultant mixture was heated to 100 °C for 12h before cooling down to room temperature. Upon removal of the solvents under vacuum, the residue was diluted with water following by extraction with EtOAc. Purification of the residue by ISCO (hexanes: EtOAc) provided compound 7.
To a solution of compound 7 in 1,4-dioxane at room temperature was added subsequently PdCl2(Ph3P)2 (0.1 eq.), Na2CO3(3 eq., 1 N) and boronic acids or pinacol boronate esters. After degassing, the resultant mixture was heated to 80 °C for 4-12 h before cooling down to room temperature and filtration through celite. Upon removal of the solvents, the residue was subjected to column purification (CH2Cl2: MeOH) to furnish the desired compounds 8.
Compound 3 was prepared following above procedures (15% overall yield). LC-MS: (M+H) 433.13. 1H NMR (600 MHz, DMSO-d6) δ 9.09 (s, 1H), 8.31 (d, J = 9.6 Hz, 1H), 8.11 (s, 1H), 8.03 (d, J = 9.0 Hz, 1H), 8.00 (d, J = 7.8 Hz, 1H), 7.92 (dd, J = 8.4, 1.8 Hz, 1H), 7.86 (dd, J = 8.4, 7.8 Hz, 1H), 7.78 (d, J = 8.4 Hz, 1H), 7.72 (d, J = 2.4 Hz, 1H), 7.04 (dd, J = 8.4, 2.4 Hz, 1H), 6.91 – 6.93 (m, 2H), 6.38 (d, J = 8.4 Hz, 1H), 6.18 (s, 2H).
Characterization of in vitro biochemical activity with the mTORC1 complex, mTOR and PI3K Cellular Assays, Ambit in vitro KinomeScan™ kinase selectivity profile and In vivo pharmacokinetic studies please see reference 22.
In vivo pharmacodynamic studies
Compound 3 powder was first dissolved at 25 mg/mL in 100% N-methyl-2-pyrrolidone and then diluted 1:4 with sterile 50% PEG400 prior to injection. Six-week old male C57BL/6 mice were fasted overnight prior to drug treatment. The mice were treated with vehicle (for 10 h) or 3 (20 mg/kg for 6h) via oral gavage and then re-fed 1 h prior to sacrifice (CO2 asphyxiation). Liver and lung were collected and frozen on dry ice. The frozen tissue was thawed on ice and lysed by sonication in tissue lysis buffer (50mM HEPES, pH 7.4, 40 mM NaCl, 2 mM EDTA, 1.5 mM sodium orthovanadate, 50mM sodium fluoride, 10 mM sodium pyrophosphate, 10 mM sodium β-glycerophosphate, 0.1% SDS, 1.0% sodium deoxycholate, and 1.0% Triton, supplemented with protease inhibitor cocktail tablets (Roche)). The concentration of clear lysate was measured using the Bradford assay and samples were subsequently normalized by protein content and analyzed by SDS-PAGE and immunoblotting.
Molecular modeling
Compound 3 was docked into an mTOR homology model built from a published PI3Kγ crystal structure complexed with GDC-0941 (PDB: 3DBS) using AutoDock vina.22,25
Supplementary Material
Scheme 1.

Discovery of 3 starting from 1
Scheme 2.

Chemical synthesis of a focused library.
Acknowledgments
We thank Life Technologies Corporation, SelectScreen® Kinase Profiling Service for performing enzymatic biochemical kinase profiling and Ambit Bioscience for performing KinomeScan™ profiling. We also want to thank Sai Advantium Pharma Limited (India) for the pharmacokinetic studies and Michael Cameron for performing in vitro microsome stability studies and NIH grants GM079575-03.
Abbreviations
- mTOR
mammalian Target of Rapamycin
- Akt
v-akt murine thymoma viral oncogene homolog 1
- ATP
adenosine triphosphate
- PIKK
PI3K related kinases
- DNA-PK
DNA activated protein kinase
- ATM
Ataxia Telangiectasia mutated kinase
- ATR
Ataxia Telangiectasia and Rad-3-related kinase
- SMG-1
Serine/threonine protine kinase -1
- 4E-BP1
Eukaryotic translation initiation factor 4E-binding protein 1
- PK
Pharmacokinetics
Footnotes
Supporting Information Available: Spectral data of 2, 9-31. This material is available free of charge via the Internet at http://pubs.acs.org.
References
- 1.Guertin DA, Sabatini DM. Defining the role of mTOR in cancer. Cancer Cell. 2007;12:9–22. doi: 10.1016/j.ccr.2007.05.008. [DOI] [PubMed] [Google Scholar]
- 2.Sarbassov DD, Ali SM, Sabatini DM. Growing roles for the mTOR pathway. Curr Opin Cell Biol. 2005;17:596–603. doi: 10.1016/j.ceb.2005.09.009. [DOI] [PubMed] [Google Scholar]
- 3.Ma XM, Blenis J. Molecular mechanisms of mTOR mediated translational control. Nat Rev Mol Cell Biol. 2009;10:307–318. doi: 10.1038/nrm2672. [DOI] [PubMed] [Google Scholar]
- 4.Abraham RT. PI 3-kinase related kinases: “big” players in stress-induced signaling pathways. DNA Repair. 2004;3:883–887. doi: 10.1016/j.dnarep.2004.04.002. [DOI] [PubMed] [Google Scholar]
- 5.Sabatini DM. mTOR and cancer: insights into a complex relationship. Nat Rev Cancer. 2006;6:729–734. doi: 10.1038/nrc1974. [DOI] [PubMed] [Google Scholar]
- 6.Shaw RJ, Cantley LC. Ras, PI(3)K and mTOR signaling controls tumour cell growth. Nature. 2006;441:424–430. doi: 10.1038/nature04869. [DOI] [PubMed] [Google Scholar]
- 7.Faivre S, Kroemer G, Raymond E. Current development of mTOR inhibitors as anticancer agents. Nat Rev Drug Discov. 2006;5:671–688. doi: 10.1038/nrd2062. [DOI] [PubMed] [Google Scholar]
- 8.Shor B, Gibbons JJ, Abraham RT, Yu K. Targeting mTOR globally in cancer: thinking beyond rapamycin. Cell Cycle. 2009;8:3831–3837. doi: 10.4161/cc.8.23.10070. [DOI] [PubMed] [Google Scholar]
- 9.Meric-Bernstam F, Gonzalez-Angulo AM. Targeting the mTOR singaling network for cancer therapy. J clin Oncol. 2009;27:2278–2287. doi: 10.1200/JCO.2008.20.0766. [DOI] [PMC free article] [PubMed] [Google Scholar]
- 10.Lane HA, Breuleux M. Optimal targeting of the mTORC1 kinase in human cancer. Curr Opin Cell Biol. 2009;21:219–229. doi: 10.1016/j.ceb.2009.01.016. [DOI] [PubMed] [Google Scholar]
- 11.Thoreen CC, Kang SA, Chang J, Liu Q, Zhang J, Gao Y, Reichling LJ, Sim T, Sabatini DM, Gray NS. An ATP-competitive Mammalian Target of Rapamycin Inhibitor Reveals Rapamycin-resistant Functions of mTORC1. J Bio Chem. 2009;284:8023–8032. doi: 10.1074/jbc.M900301200. [DOI] [PMC free article] [PubMed] [Google Scholar]
- 12.Jacinto E, Loewith R, Schmidt A, Lin S, Ruegg MA, Hall A, Hall MN. Mammalian TOR complex2 controls the actin cytoskeleton and is rapamycin insensitive. Nat Cell Biol. 2004;6:1122–1128. doi: 10.1038/ncb1183. [DOI] [PubMed] [Google Scholar]
- 13.Wan X, Harkavy B, Shen N, Grohar P, Helman LJ. Rapamycin induces feedback activation of Akt signaling through an IGF-1R-dependent mechanisms. Oncogene. 2007;26:1932–1940. doi: 10.1038/sj.onc.1209990. [DOI] [PubMed] [Google Scholar]
- 14.Feldman ME, Apsel B, Uotila A, Loewith R, Kinght ZA, Ruggero D, Shokat KM. Active-Site Inhibitors of mTOR Target Rapamycin-Resistant Outputsof mTORC1 and mTORC2. PLoS Biology. 2009;7:371–383. doi: 10.1371/journal.pbio.1000038. [DOI] [PMC free article] [PubMed] [Google Scholar]
- 15.Garcia-martinez JM, Moran J, Clarke RG, Gray A, Cosulich SC, Chresta CM, Alessi DR. Ku-0063794 is a specific inhibitor of the mammalian target of rapamycin (mTOR) Biochem J. 2009;421:29–42. doi: 10.1042/BJ20090489. [DOI] [PMC free article] [PubMed] [Google Scholar]
- 16.Chresta CM, Davies BR, Hickson I, Harding T, Cosulich S, Critchlow SE, Vincent JP, Ellson R, Jones D, Sini P, james D, Howard Z, Dudley P, Hughes G, Smith L, Maguire S, Hummersone M, Malagu K, Menear K, Jenkins R, Jacobsen M, Smith GCM, Guichard S, Pass M. AZD8055 Is a Potent, Selective, and Orally Bioavailable ATP-Competitive Mammalian Target of Rapamycin Kinase Inhibitor with In vitro and In vivo Antitumor Activity. Cancer Res. 2010;70:288–298. doi: 10.1158/0008-5472.CAN-09-1751. [DOI] [PubMed] [Google Scholar]
- 17.Yu K, Toral-Barza L, Shi C, Zhang W, Lucas J, Shor B, Kim J, Verheijen J, Curran K, Malwitz DJ, Cole DC, Ellingboe J, Ayral-kaloustian S, Mansour TS, Gibbons JJ, Abraham RT, Nowak P, Zask A. Biochemical, Cellular, and In vivo Activity of Novel ATP-Competitive and Selective Inhibitors of the Mammalian Target of Rapamycin. Cancer Res. 2009;69:6232–6240. doi: 10.1158/0008-5472.CAN-09-0299. [DOI] [PubMed] [Google Scholar]
- 18.Barr S, Russo S, Buck E, Epstein D, Miglarese M. Co-targeting mTOR and IGF-1R/IR results in synergistic activity against a broad array of tumor cell lines, independent of KRAS mutation status. AACR 101st Annual meeting; Washington DC. April, 2010; p. 1632. [Google Scholar]
- 19.Yu K, Shi C, Toral-Barza L, Shor B, Kim JE, Zhang WG, Mahoney R, Gaydos C, Tardio L, Kim SK, Conant R, Curran K, Kaplan J, Verheijen J, Ayral-kaloustian S, Mansour TS, Abraham RT, Zask A, Gibbons JJ. Beyond Rapalog therapy: preclinical pharmacology and antitumor activity of WYE-125132, an ATP-competitive and specific inhibitor of mTORC1 and mTORC2. Cacner Res. 2010;70:621–631. doi: 10.1158/0008-5472.CAN-09-2340. [DOI] [PubMed] [Google Scholar]
- 20.Menear KA, Gomez S, Malagu K, Balley C, Blackburn K, Cockcroft X, Ewen S, Fundo A, Gall AL, Hermann G, Sebastian L, Sunose M, Persnot T, Torode E, Hickson I, Martin NM, Smith GCM, Pike KG. Identification and optimization of novel and selective small molecular weight kinase inhibitors of mTOR. Bioorg Med Chem Lett. 2009;19:5898–5901. doi: 10.1016/j.bmcl.2009.08.069. [DOI] [PubMed] [Google Scholar]
- 21.Richard DJ, Verheijen JC, Curran K, Kaplan J, Troal-Barza L, Hollander I, Lucas J, Yu K, Zask A. Incorporation of water-solubilizing groups in pyrazolopyrimidine mTOR inhibitors: Discovery of highly potent and selective analogs with improved human microsomal stability. Bioorg Med Chem Lett. 2009;19:6830–6835. doi: 10.1016/j.bmcl.2009.10.096. [DOI] [PubMed] [Google Scholar]
- 22.Liu Q, Chang J, Wang J, Kang SA, Thoreen CC, Markhard A, Hur W, Zhang J, Sim T, Sabatini DM, Gray NS. Discovery of 1-(4-(4-propionylpiperazin-1-yl)-3-(trifluoromethyl)phenyl)-9-(quinolin-3-yl)benzo[h][1,6]naphthyridin-2(1H)-one as a highly potent, selective Mammalian Target of Rapamycin (mTOR) inhibitor for the treatment of cancer. J Med Chem. 2010;53:7146–7155. doi: 10.1021/jm101144f. [DOI] [PMC free article] [PubMed] [Google Scholar]
- 23.Fabian MA, Biggs WH, III, Treiber DK, Atteridge CE, Azimioara MD, Benedetti MG, Carter TA, Ciceri P, Edeen PT, Floyd M, Ford JM, Galvin M, Gerlach JL, Grotzfeld RM, Herrgard S, Insko DE, Insko MA, Lai AG, Lélias JM, Mehta SA, Milanov ZV, Velasco AM, Wodicka LM, Patel HK, Zarrinkar PP, Lockhart DJ. A small molecule-kinase interaction map for clinical kinase inhibitors. Nat Biotechnol. 2005;23:329–336. doi: 10.1038/nbt1068. [DOI] [PubMed] [Google Scholar]
- 24.For selectivity score calculation S(5) see http://www.kinomescan.com/pdfs/Screening_Report_New.pdf
- 25.Thompson DO. Cyclodextrins--enabling excipients: their present and future use in pharmaceuticals. Crit Rev Ther Drug Carrier Syst. 1997;14:1–104. [PubMed] [Google Scholar]
- 26.Trott O, Olson AJ. Autodock vina: Improving the speed and accuracy of docking with a new scoring function, efficient optimization, and multithreading. J Comput Chem. 2010;31:455–461. doi: 10.1002/jcc.21334. [DOI] [PMC free article] [PubMed] [Google Scholar]
Associated Data
This section collects any data citations, data availability statements, or supplementary materials included in this article.