

Abstract
This work describes the application of NMR to the measurement of secondary deuterium (2° 2H) and carbon-13 (13C) kinetic isotope effects (KIES) at positions 9 to 13 within the substrate linoleic acid (LA) of soybean lipoxygenase-1. The KIEs have been measured using linoleic acid labeled with either protium (11,11-h2-LA) or deuterium (11,11-d2-LA) at the reactive C11 position, which has been previously shown to yield a primary deuterium isotope effect of ca. 80. The conditions of measurement yield the intrinsic 2° 2H and 13C KIEs on kcat/Km directly for 11,11-d2-LA, whereas the values for the 2° 2H KIEs for 11,11-h2-LA are obtained after correction for a kinetic commitment. The pattern of the resulting 2° 2H and 13C isotope effects reveals values that lie far above those predicted from changes in local force constants. Additionally, many of the experimental values cannot be modeled by electronic effects, torsional strain, or the simple inclusion of a tunneling correction to the rate. Although previous studies have shown the importance of extensive tunneling for cleavage of the primary hydrogen at C11 of LA, the present findings can only be interpreted by extending the conclusion of non-classical behavior to the secondary hydrogens and carbons that flank the position undergoing C-H bond cleavage. A quantum mechanical method introduced by Buhks et al. [J. Phys. Chem. 85, 3763 (1981)] to model the inner sphere reorganization that accompanies electron transfer has been shown to be able to reproduce the scale of the 2° 2H KIEs.
Keywords: tunneling, hydrogen transfer, soybean lipoxygenase, secondary kinetic isotope effects, Marcus theory, reorganization energy, quantum transition state theory, proton-coupled electron transfer, enzyme catalysis, C-H bond activation
Introduction
Soybean lipoxygenase 1 (SLO-1), the archetypal member of the lipoxygenase family of enzymes, is of interest for a number of reasons. First, dysregulation of lipoxygenase function has been associated with common disease states: asthma 1, atherosclerosis 2 arthritis 1 and several cancers 3,4. Second, the lipoxygenases are notable for their ability to catalyze difficult chemical transformations, namely the selective activation of C-H bonds on hydrocarbon scaffolds. Third, the mechanism by which SLO-1 achieves this key catalytic step is inherently quantum mechanical. Perhaps the most obvious manifestation of quantum behavior in the SLO-1 catalyzed oxidation of linoleic acid (Scheme 1) is the very large primary kinetic isotope effect (KIE) upon the unimolecular rate constant (kH/kD ≃ 80, 25 °C) that is only weakly temperature-dependent 5-7. Interestingly, a number of other enzymes that activate C-H bonds by radical mechanisms also have large primary deuterium KIEs. Among well-known examples are methane monooxygenase 8,9 the non-heme iron, alpha-ketoglutarate-dependent TauD 10, methylmalonyl CoA mutase 11,12, aromatic amino acid hydroxylases 13, acylCoA desaturase 14 and fatty acid alpha-oxygenase 15. While the analyses of these huge primary isotope effects have been carried out using modified Marcus expressions that incorporate a term that describes the sampling of distance between the H- donor and acceptor, the contribution of motions within the backbone of substrate to the tunneling process has not been explicitly addressed. To this end, we have turned to the measurement of carbon and secondary deuterium kinetic isotope effects in the SLO-1 reaction.
Scheme 1.

Consensus mechanism for oxidation of linoleic acid catalyzed by soybean lipoxygenase-1.
In an early study of secondary isotope effects in the yeast alcohol dehydrogenase reaction, a comparison of the 2° kH/kT (protium in the primary position) to the 2° kD/kT (deuterium in the primary position) indicated deviations from the semi-classical Swain-Schaad relationship in a direction predicted for hydrogen tunneling. This study provided one of the first direct confirmations of the contribution of hydrogen tunneling to an enzyme reaction, though in the context of a hydride transfer rather than the hydrogen atom transfer characteristic of SLO-116. Extension of the original studies in the yeast alcohol dehydrogenase system to a range of alcohol dehydrogenases revealed varying degrees of non-classical behavior, with an unexpected trend being the dependence of deviations on the 2° kD/kT rather than kH/kT values 17-19. Such observations have led to a re-evaluation of the secondary hydrogen kinetic effects in the context of a full tunneling model, bringing our view of active site chemistry in the alcohol dehydrogenases much closer to that of SLO-1 20,21.
The nature of the SLO-1 substrate, linoleic acid, offers the opportunity to measure a series of secondary and carbon effects at various position along the substrate chain, starting at the reactive C11 position and moving away from this position toward either the C1 or C18 positions of substrate. Additionally, it has been possible to compare 2° 2H under the condition of either protium or deuterium cleavage from the reactive C11 position. The experimental strategy, which utilizes labeling and NMR measurement methods pioneered by Singleton for small molecules 22 is summarized in Scheme 2. This involves a combinatorial method in which selected carbons are either slightly enriched in deuterium at the positions targeted for secondary deuterium kinetic isotope effect measurements or used at the level of natural C13 abundance in the case of carbon isotope effect measurements at the same positions. As will be shown in this work, the aggregate data are fully consistent with a quantum treatment for hydrogen transfer from the primary position that is accompanied by differing degrees of inner sphere reorganization in a position-specific manner. Significantly, the extent of inner sphere reorganization far exceeds semi-classical limits, implicating the contribution of quantum mechanical behavior from the backbone atoms of substrate that accompanies the extensive tunneling of the primary, transferred hydrogen.
Scheme 2.

A) Method for measuring 2° 2H KIEs at positions C9, C10, C12, and C13 using combinatorially-2H-labeled linoleic acid. B) Method for measuring 13C KIEs at positions C9-C13 using naturally-13C-labeled linoleic acid.
Materials and Methods
Expression and Purification of Soybean Lipoxygenase-1
Soybean lipoxygenase-1 (SLO-1) was expressed on the pT7-7 plasmid in the BL21(D3) strain of E. coli. An initial culture was generated from frozen cell stocks on Luria Agar plates treated with 50 μg/mL ampicillin. Single colonies of these plates were then used to inoculate 40 mL cultures of Luria-Bertani broth containing 50 μg/mL ampicillin. These cultures were grown at 37 °C until cloudy (about 6 hours). Aliquots (5 mL) of this culture were used to inoculate each of 6-4 L flasks containing 1.5 L of 2×YT broth treated with 3 % (v/v) ethanol and 50 μg/mL ampicillin. These cultures were grown for approximately 6 hours at 37 °C. At this time, the cultures were treated with 1.5 mL 50 mg/mL ampicillin and allowed to incubate at 15 °C for about 96 hours. Cells were then harvested by centrifugation and frozen at −80 °C.
Lysis of the cell paste involved incubation on ice for about 1 hour in a lysis buffer {50 mM Tris-HCl (pH 7.5), 50 mM NaCl, 1 mM EDTA, 10 % (v/v) glycerol, 0.1 % Tween20, 0.2mM aminoethylbenzenesulfonyl fluoride (AEBSF), 10% (v/v) 10× Bugbuster, and 50 μL benzonase}. For each gram of cell paste, 4 mL of lysis buffer was prepared. The lysis mixture was then centrifuged at 4 °C and 27000g in an SS-34 rotor for 20 minutes. The supernatant was dialyzed against 4 L of 20 mM Bis-Tris (pH 6.0) buffer for 1 hour and this dialyzed supernatant was loaded onto a 1″ × 12″ SP-sepharose fast flow column followed by 20 mM Bis-Tris (pH 6.0) buffer. After absorbance at 280 nm due to non-adhering species approached baseline, an elution buffer consisting of 0.5 M NaCl and 20 mM Bis-Tris (pH 6.0) was used to elute SLO-1 off of the column. Activity was usually detected in fractions 7-13 when collecting 10 mL fractions. The collected active fractions were then dialyzed overnight against 4 L of 20 mM Bis-Tris (pH 6.0). The dialyzed solution was centrifuged at 27000g in an SS-34 rotor for 20 minutes to remove a white particulate that forms during dialysis. The supernatant was injected onto an FPLC system with a 10 mL Mono-S column using the same loading buffer as for the SP-sepharose column. A salt gradient for protein elution went from 0.00 to 0.25 M NaCl in 20 mM Bis-Tris (pH 6.0) buffer. FPLC purification utilized a flow rate of 2.5 mL/minute. Most activity was obtained in fractions 18-25 when collecting 5 mL fractions. SLO-1 activity was assayed by observing the formation of 13-hydroperoxy-9,11-(Z,E)-octadecadienoic acid (HPOD) at 234 nm upon the addition of 2 μL of a column fraction to 498 μL of 100 μM linoleic acid in 0.1 M borate buffer (pH 9.0).
Synthesis of Labeled Linoleic Acids
The full synthesis of linoleic acid (11,11-h2-LA) and 11,11-d2-LA with approximately 4 % deuterium label in the 9, 10, 12, and 13 positions is described in 23 and the Supporting Information. The primary concern was to generate a low but measurable level of deuterium labeling in the vinylic positions of the linoleic acid isotopomers so that an insignificant number of the individual molecules would have two deuterium labels in the vinylic positions. The deuterium labeling at these positions was necessary for the ultimate quantitative D-NMR measurements which yielded the raw data used to compute kinetic isotope effects. The vinylic labeling was achieved by reducing 9,12-octadecadienoic acid with 1.5 equivalents of catecholborane followed by acetolysis in a mixture of 12 % (mol/mol) d-acetic acid and 88 % (mol/mol) acetic acid. This reduction method is ideally suited to the experiments described herein because it does not lead to scrambling of the hydrogen or deuterium atoms into the 8, 11, and 14-positions, as do some heterogeneous metallic catalyst methods24. Additionally, over-reduction is prevented by both steric and electronic properties of the hydroboration product 25,26.
Reactions for KIE Determination
Secondary 2H KIEs were determined for the oxidation of 11,11-d2-LA and linoleic acid, each labeled with approximately 4 % 2H at the 9, 10, 12, and 13 positions. These reactions were carried out between 21 and 23 °C. A similar protocol was used to measure 13C KIEs with natural abundance substrates. A 12 L 3-neck round-bottomed flask was charged with 10 L of 0.1 M borate (pH 9.0). To this was added approximately 0.63 ml of the combinatorially labeled 11,11-d2-LA or linoleic acid dissolved in 100 mL (20.3 mM stock concentration). This mixture was allowed to stir slowly for about 1 hour before spectrophotometrically determining the initial concentration of linoleic acid at 234 nm, which was typically in the range of 165-170 μM. Three aliquots of 500 μL were taken before reaction was initiated by the addition of SLO-1. These aliquots were diluted 1:2 with 0.1 M borate (pH 9.0). A 495 μL aliquot of this diluted solution was added to a cuvette, the absorbance was zeroed, and 5 μL of approximately 1 mg/mL SLO-1 in 0.1 M borate (pH 9.0) was added to the cuvette. The absorbance was followed at 234 nm. The final absorbance (corrected for the small absorbance of SLO-1) was a check on the initial concentration of substrate in the reaction. Two types of reactions were performed for each isotopically-labeled substrate. Two standard reactions of 10 L were taken to 100 % conversion so that NMR on this product could be used to report on the initial fraction of labeling (R0) at each position (9, 10, 12, and 13). These standard reactions typically required about 3 mg of SLO-1 to complete the consumption of the combinatorially-labeled linoleic acid, and about 30 mg of SLO-1 to completely consume the combinatorially-labeled 11,11-d2-LA. Three sample reactions of 10 L were taken to approximately 35 % conversion for the eventual NMR determination of the fraction of deuterium label at each vinylic position, RP. These partial conversion reactions usually required about 1 mg and 10 mg SLO-1 to achieve the appropriate fractional conversion of combinatorially-labeled linoleic acid and 11,11-d2-LA, respectively. The large amount of SLO-1 was necessary, given that SLO-1 typically becomes progressively inactive over time, and these reactions typically took place over 24 hours.
The sample reactions were quenched when the reaction appeared to have stopped and the fractional conversion was near the desired 35 % completion mark as determined by absorbance for HPOD at 234 nm. The quenching process involved the addition of about 600 mL diethyl ether followed by the addition of 3.9 g NaBH4, 136.9 g KH2PO4, and 584.4 g NaCl. The NaBH4 was used to reduce 13-hydroperoxy-9,11-(Z,E)-octadecadienoic acid to 13-hydroxy-9,11-(Z,E)-octadecadienoic acid (HOD). The KH2PO4 acidified the solution to aid in extraction of linoleic acid and the reduced product, as did the added salt (NaCl). We note that the KH2PO4 should be added slowly, as NaBH4 evolves hydrogen rapidly in the presence of acid, and foaming can occur due to the soapy nature of the substrate and product. The quenched reactions were separated into three approximately equivalent volumes and extracted in a 4 L separatory funnel with 6-200 mL volumes of diethyl ether. After extraction, the combined ether layers were washed with about 200 mL brine. The ether was then removed using rotary evaporation. The residual oil containing linoleic acid and/or HOD was methylated using diazomethane prepared via the addition of N-methyl-N-Nitrosourea to a biphasic mixture of 4.5 mL 15 % KOH and 10 mL diethyl ether. The methyl esters of the linoleic acid and HOD were separated via flash chromatography using 200 mesh neutral silica as the stationary phase in a 2.5″ × 14″ column. The mobile phase consisted of (in order) 1000 mL of 20 % diethyl ether/80 % hexanes, then 500 mL 30 % diethyl ether/70 % hexanes, then 500 mL 50 % diethyl ether/50 % hexanes. About 160 fractions of about 10 mL were collected. The methyl linoleate typically eluted from fraction 15 to fraction 30, and the methyl ester of HOD (MHOD) eluted between fractions 100 and 140.
Assignment of 13C and 2H Peaks for MHOD
In order to interpret the quantitative NMR measurements of 13C and 2H spectra, it was necessary to unambiguously assign the resonances to the correct position on the MHOD molecule. Since, 2H and 1H spectra have the same chemical shift dispersion, it is possible to assign the 2H spectrum from coupling associations and other information in the 1H NMR spectra. 1H NMR spectra of 11-d-MHOD and MHOD allowed for the unambiguous assignment of the 1H resonances at the 9, 11, and 13 positions. The 13 position was assigned as the resonance at 3.21 ppm (dt, J=6, 6 Hz, 1H). The 11 position was assigned to the resonance at 6.37 ppm (dd, J=11, 15 Hz, 1H) by virtue of its disappearance in the spectrum of 11-d-MHOD. The 9 position at 5.31 ppm (dt, J=7, 11 Hz, 1H) was assigned based on the fact that, of the four olefinic resonances, it was the only one for which the splitting pattern did not simplify upon going from 11-d-MHOD to MHOD. Finally, the 10 and 12 positions were assigned based on shared couplings between the 9 and 10 positions and the 12 and 13 positions. The resonance assigned to the 12 position is 5.60 ppm (dd, J=6, 15 Hz, 1H), and is obviously coupled with the 13 position as well as the 11 position. The resonance assigned to the 10 position is at 5.92 ppm (dd, J=11, 11 Hz, 1H). These couplings are consonant with a resonance coupled to both the 9 and 11 positions. The couplings and chemical shifts of the lines associated with MHOD are available in the Supporting Information. The assignments made via couplings and differences in the spectra for 11-d-MHOD and MHOD were confirmed using a short TOCSY experiment.
Assignments of 13C NMR lines relied upon the use of HMQC, since the proton resonances were already accurately assigned. All 13C NMR spectra were obtained at 125.77 MHz in d6-DMSO at a constant temperature of 23.2 °C. A total of 12 resonances were assigned out of the 19 possible. The assignments are: OMe: 51.1 ppm, C1: 173.2 ppm, C2: 33.3 ppm, C3: 27.1 ppm, C7: 37.3 ppm, C8: 24.8 ppm, C9: 123.7 ppm, C10: 130.7 ppm, C11: 138.1 ppm, C12: 128.4 ppm, C13: 70.6 ppm.
Quantitative NMR Measurements
Quantitative 13C NMR spectra were obtained using a Bruker DRX-500 spectrometer equipped with a broad band probe at 125.77 MHz in a 5mm NMR tube in d6-DMSO filled to 5 cm. The temperature was held to 23.2 °C for all samples. The overall relaxation time was determined by inversion recovery. Over approximately 13 hours, 24 acquisitions of 64 scans each were acquired while locked on the deuterium signal in d6-DMSO. Scans of 131072 points acquired over 2.12 s were taken with a total delay of 32.12 s between excitation pulses. Inverse gated decoupling of proton signals was used to decouple while not inducing spurious NOE contributions to the 13C resonances. A π/6 pulse was used for excitation. The 24 FIDs acquired during each experiment were added together. Processing was performed by zero filling the FID with 128K points. Fourier transforms were performed with a line broadening of 0.25 Hz.
Quantitative 2H NMR spectra were obtained using a Bruker AVB-400 spectrometer equipped with a broadband probe at 61.42 MHz in a 5mm NMR tube in CCl4. Approximately 25 μg α,α,α-d3-toluene was added to each sample as an external standard. The amount of toluene versus MHOD was determined via 1H NMR spectroscopy with an appropriately long delay between excitations pulses determined by an inversion recovery experiment. The 13C resonances were decoupled using inverse gated decoupling in order to remove isotopic sidebands associated with the methyl group of the ester. The integrations of the methyl group of the ester functionality were compared to the integrations of the aromatic peaks of the α,α,α -d3-toluene standard. The 2H NMR spectra were run at 51.0 °C for all samples. Over approximately 12 hours, 12 acquisitions of 128 scans each were acquired unlocked with 30.46 s between excitation pulses. A π/2 pulse was used for excitation. Each FID was Fourier transformed with a 1.5 Hz line broadening, treated with a zero-order baseline correction, and then phased. Deconvolution was utilized to extract the relative peak areas since the deuterium peaks were quite broad. A Lorentzian fit to the peaks gave consistent integration from FID to FID. It should be noted here that, in order to perform these spectra at 51.0 °C, it was essential to employ an aprotic nonpolar solvent. Attempts to acquire spectra of MHOD at this temperature in DMSO and methanol resulted in degradation of MHOD which was evident after the course of 1 hour. The carbinol resonance for position 13 did not change in intensity, but the spectrum in the olefinic region became more complicated, and a new resonance appeared near 2 ppm. By the shift of the deuterium peaks in the NMR spectra and a subsequent proton NMR spectrum, it is believed that the degradation is a [1,5] sigmatropic hydrogen shift from the 8-position to the unsaturated 12 position of the MHOD molecule.
Calculation of KIEs and Error Estimates
Both 2H and 13C KIEs were measured by determining the fractionation of the NMR-active nuclei in the product, Rp, relative to the isotopic labeling in the 100 % conversion reactions, R0. Eq (1) was used to compute the KIE based on these measurements and the fractional conversion, F, of the partial conversion reactions. The error on individual KIE measurements was propagated based on the total differential eq (2) of the KIE expression in eq (1) and the standard errors of the dependent variables, Rp/R0 and F (cf. eqs (3a) and (b)).
| (1) |
| (2) |
| (3a) |
| (3b) |
For both substrates, l1,11-h2-LA and 11,11-d2-LA, six sets were determined using three partial conversion reactions and two 100 % completion reactions. Because the 100 % completion reactions were run separately and dealt with independently, it can be argued that they represent statistically independent measurements. The six resulting KIEs for each position were then averaged after weighting, to reflect the error in the individual measurements.
For the 13C KIEs, C7 was used as the reference peak since it is electronically and spatially removed from the center of reactivity and has an NMR resonance that is isolated and less susceptible to phase interference from nearby peaks. For this resonance, Rp/R0 is re-normalized to a value of unity. The same normalization factor is then applied to the values of Rp/R0 pertaining to the peaks of interest. This correction accounts for the differing amounts of MHOD that reside in the sample being analyzed but it rests on the assumption that the C7 peak does not undergo fractionation during the reaction. This assumption appears to be justified, since it yielded negligible 13C KIEs for the majority of the methylene groups that are isolated from C9–C13 positions on the carbon backbone of the linoleic acid substrate (see Table 1). Furthermore, this finding serves as confirmation that, aside from position C9 to C13 of substrate, there were no significant fractionations elsewhere in the substrate. While the majority of these peaks were not easily assigned, they offered the opportunity to examine fractionation at a large number of remote positions. For the 11,11-d2-LA sample, none of these peaks showed an appreciable normal 13C KIE, with the possible exception of peaks 9 and 17, Table 1. In the case of peak 9 (assignable to C2), the value reported might reflect some fractionation upon interaction of the bound carboxylate at C1 of substrate with an arginine side chain of protein. In contrast, almost all of the peaks examined for 11,11-h2-LA showed values in the range of 1-2 % (data not shown). A difference between the NMR spectra collected for the 11,11-h2-LA and 11,11-d2-LA samples was the irregular base line in the former case. In fact, though the control 13C KIE for 11,11-h2-LA at C2 was only 1.010, the error on this number was (0.011). Overall, the data indicated a much higher reliability for the 13C KIEs collected for 11,11-d2-LA which, thus, form the basis of the presented Results and Discussion.
Table 1.
Experimental 13C KIEs at positions remote from C9 to C13 of 11,11-d2-LA.
| NMR Peak No. | C2 (peak 9) | 10 | 11 | 15 | 16 | 17 | 18 |
|---|---|---|---|---|---|---|---|
| 13C KIE | 1.015 (0.008) | 1.002 (0.006) | 0.941 (0.004) | 0.997 (0.005) | 1.002 (0.009) | 1.013 (0.006) | 0.990 (0.003) |
2H KIEs were determined using an external NMR standard. These experiments were performed with 11,11-h2-LA and 11,11-d2-LA combinatorially-labeled at the C9, C10, C12, and C13 positions to the level of approximately 4 %. In contrast to potential complication in the 13C measurements, this minimizes spurious contributions from contaminants labeled at natural abundance. A standard with a sharp resonance was chosen: α,α,α-d3-toluene. The amount of external standard relative to MHOD in each NMR analysis was determined using 1H NMR. This normalization factor was used to determine the relative 2H content in the C9, C10, C12, and C13 positions for partial conversion reactions as compared to full conversion reactions. Thus, these KIEs are absolute and not relative to any ad hoc standard.
Equilibrium Isotope Effects on 2,5-Heptadiene
Equilibrium isotope effects were computed for the conversion of 2,5-heptadiene to the pentadienyl radical. Two conformers of the pentadienyl radical were used here. One conformer is the completely optimized (fully relaxed) radical. The other conformer maintains the dihedral angles in the carbon skeleton that were found in docking studies of linoleic acid into SLO-1 carried out by Hatcher et al. 27. The 2,5-heptadiene structure used is fully relaxed in both cases, since the competitive isotope effects measured here result from isotopic fractionation that occurs between the free substrate and the rate-determining step(s). All structures used for these computations were calculated using the B3LYP density functional for closed-shell systems and the unrestricted B3LYP density functional for doublet species within the Gaussian98W package. In every case, the 6-31+G(d,p) basis set was utilized.
Transition State Theory Computations
A structure 27 of linoleic acid docked 28 to the active site of the 1F8N.pdb 29 crystal structure of SLO-1 was abbreviated to 2,5-heptadiene. The four internal carbon skeleton dihedrals present in the bound ground state are, thus, preserved in the transition state model. The transition state for hydrogen atom abstraction from 2,5-heptadiene to cyclopentenyl radical was computed using the Gaussian98W suite 30. For the computation of ground state 2,5-heptadiene, the most stable structure was sought, and no constraints were placed on the reactant structure. The justification for this approach rests in the nature of the competitive kinetic isotope effect studies carried out herein, that explore the isotopic fractionation in going from the free substrate to the bound transition state structure of the rate-determining step. Density functional theory was employed for these calculations using the B3LYP functional 31,32; the 6-31+G(d,p) basis set 33 was utilized. Frequency calculations were then performed on the optimized structures. The transition state was found to have exactly one imaginary frequency corresponding to 1778.2i cm-1 for all light isotopes. A perl program was written to compute kinetic isotope effects from the force constant matrices generated in the frequency calculations. First, the perl program extracts and parses the force constant matrix for the reactant and transition state structures. Then, according to the isotopic substitution desired, the force constant matrix is weighted according to mass. The mass-weighted force constant matrix is diagonalized using the Math∷MatrixReal module available on CPAN 34. The resulting frequency eigenvalues (after discarding rotational and translational eigenvalues) were then placed into the Bigeleisen equation (vide infra). The full Bell correction was employed to correct for tunneling, using the correct form provided by Northrop 35, and 20 terms were computed. The expanded Bell calculation, often referred to as the finite parabola model, avoids the non-monotonic behavior of the Bell correction apparent when only the first or first few terms are used in the calculation in conjunction with large imaginary frequencies.
Results
Competitive 2H KIE measurements
Shown in Figure 1 are the 2H KIEs measured for SLO-1 catalyzed conversion of 11,11-h2-LA and 11,11-d2-LA using substrates labeled at approximately 4 % deuterium at the vinylic (C9, C10, C12, and C13) positions. The labeling method employed for these measurements (Scheme 2) was designed to increase a poor signal-to-noise that would occur had we used naturally abundant deuterium (< 0.02 %). Furthermore, 2H-NMR is not as sensitive as 13C-NMR1 where it was possible to use substrate with natural abundance 13C (see below). Two features of these measurements were the need to go to high fractional conversion and the analysis of the isotopic composition of product. The latter was necessitated by the closely-spaced 2H and 13C NMR resonances corresponding to positions 9, 10, 12, and 12 in linoleic acid. Because fractionation was measured in the product instead of reisolated reactant, random errors in relative fractionation (Rp/R0) have a greater impact upon the propagated error in the KIE, cf. eq (3b) 36.
Figure 1.

Competitive 2H KIEs at positions 9, 10, 12, and 13 for the oxidation of 11,11-h2 (A), and 11,11-d2-linoleic acids (B). Errors in last two digits are in parentheses. These numbers are statistically-weighted averages of 6 KIE determinations with associated statistically-weighted error computed from 2 standard (100 %) reactions and 3 partial (≈ 35 %) conversion reactions. The associated error on each of the 6 independent measurements was computed from propagated errors resulting from an average of 12 measurements of relative peak area (Rp or R0) for each reaction and the standard error in fractional conversion (F) for each partial conversion reaction.
The technical challenges surrounding the measurement of competitive KIEs at multiple positions in an enzymatic reaction are further compounded by the possible presence of kinetic complexity in enzymatic reactions. The kinetic parameters measured in these studies are upon kcat/Km and, as such, reflect both substrate binding and the subsequent hydrogen atom transfer, k3 in eq (4):
| (4) |
In earlier studies of the SLO-1 reaction under the conditions of the present studies, it had been shown that substrate binding was partially rate-determining for the C11 protio-substrate, but had become fully rate-determining when protium is substituted by deuterium at the reactive C11 position. This difference in the nature of rate-determining step(s) arises directly from the huge size of the primary kinetic isotope effect on k3. This means that the values for the KIEs in Figure 1B can be ascribed to intrinsic values while those in Figure 1A must be corrected for partial rate limitation by substrate-binding.
To correct the 2H KIEs in Figure 1A, we employ the kinetic scheme in eq (4), where the hydrogen abstraction is essentially irreversible, making the reverse commitment to C-H bond cleavage equal to zero. The intrinsic KIE 37 on k3 is then calculated from the observed KIE using eq (5):
| (5) |
where KIE(OBS) and KIE(INT) refer to the observed and intrinsic KIEs, respectively, and Cf is the forward commitment to catalysis, reflecting the ratio of k3 to k2, eq (4). The value for Cf can be obtained from the relationship between the primary deuterium isotope effect on kcat, where chemistry is fully rate-limiting for SLO-1, to the deuterium isotope effect on kcat/Km:
| (6) |
We were able to obtain a highly reliable estimate for Cf from the trends previously measured in Dkcat and D(kcat/Km) values using the recombinant form of SLO-1 of the present study. As seen in Supplementary Figure S1, the value of Cf is 2.52 at 22 °C. This leads to the intrinsic values for reaction of linoleic acid labeled with protium at the C11 position, Figure 2.
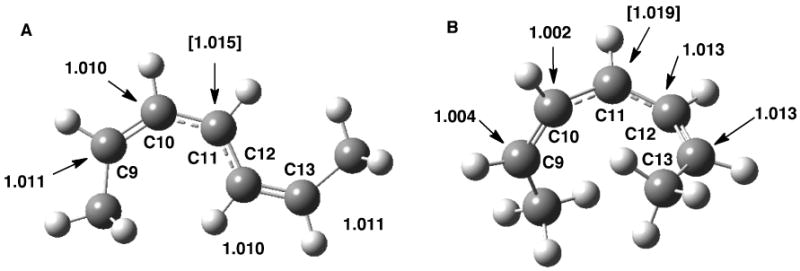
Figure 2.

Intrinsic 2H KIEs at positions 9, 10, 12, and 13 for the SLO-1 catalyzed oxidation of 11,11-h2-LA. The values in brackets denote the upper and lower bounds after correction for kinetic complexity corrections.
The results in Figures 1B & 2 show substantial deviation from what might be expected from rate-limiting conversion to a fully-delocalized pentadienyl radical. For both substrates, a pattern is evident, in which the KIEs for positions 9, 10, and 12 are larger than at position 13. This contrasts with the expectation of similar 2H KIEs for the C9/C13 and C10/C12 pairs. The sizable reduction for the value at the C13 position raises the likelihood of some restriction of motion at this position, which undergoes combination with O2 in the second half of the SLO-1 reaction, Scheme 1. We note that the intrinsic KIEs for transfer of protium (Figure 2) are not statistically different from those for deuterium (Figure 1B). While the level of error apparent in the numbers, especially for the computed intrinsic 2H KIEs for 11,11-h2-LA, make this comparison tentative, there is no detectable trend whereby the 2° 2H KIEs are reduced under conditions of cleavage of deuterium at C11. This contrasts with the clear evidence for a breakdown from the rule of the geometric mean for 2° 2H KIEs measured in other enzymatic C–H activation reactions 16-19,38.
Competitive 13C KIE measurements
Shown in Figure 3 are the 13C KIEs measured for SLO-1 catalyzed conversion of 11,11-d2-LA. With the possible exception at C13, the numbers are all larger than a control measurement at C2 of substrate (1.015 ± 0.008), as well as control KIEs calculated for the unassigned peaks 10, 11, and 15-18 in the 13C NMR spectra (Table 1). The KIE at the C2 position may be reflective of fractionation resulting from desolvation of the adjacent carboxylate position of linoleic acid. The numbers reported can be considered intrinsic KIEs, due to the enormous primary hydrogen isotope for cleavage of the C–D bond at the C11 position of substrate. While the 13C KIEs at positions C9, C10, C12 and C13, all appear smaller than at C11, the large (1 σ) errors, especially at C11, preclude a definitive conclusion in this regard. What is especially compelling is the unexpectedly large magnitude of 13C effects at all positions between C9 and C12.
Figure 3.

Competitive 13C KIEs at positions 9-13 for the oxidation of 11,11-d2-LA. Errors determined as described in Figure 1.
Discussion
A Pattern in the Magnitude of the Secondary 2H Kinetic Isotope Effects
The method of measurement employed herein, while allowing the simultaneous measurement of isotope effects at five carbon centers, also suffers from large inherent errors. Despite this limitation, the ability to measure the 2° 2H isotope effects with either protium or deuterium in the primary, C11 position of substrate greatly expands the scope of this work. Significantly, similar patterns can be observed independent of whether 11,11-h2-LA or 11,11-d2-LA is utilized. We note an asymmetry in the data, with a reduced 2H effect at C13.
A discussion of these data in the context of the precise mode of binding of substrate to SLO-1 is hampered by the absence of an X-ray structure between enzyme and linoleic acid. While a structure is available for the complex of enzyme with the product hydroperoxide, this is an abortive complex that is generally agreed to be very different from that of substrate. The active site structure that derives from modeling of the substrate into the active site is somewhat different depending on whether the carboxylate at C1 is allowed to face toward solvent or to interact with a buried arginine residue. This remains unresolved, though kinetic data from this laboratory have favored the binary complex in which the carboxylate faces out at elevated pH and reverses itself at low pH when the C-terminal carboxylate of substrate is protonated. Both modes of binding can, with small structural change, be made compatible with the stereochemistry of hydrogen abstraction from the C11 position of substrate, as well as the position of attack of molecular oxygen at the C13 of the substrate derived radical via a side channel that leads directly from solvent to the active site. In an early spectroscopic study, Nelson and co-workers found evidence for a localization of the free radical center in the pentadienyl intermediate to the C9 to C11 positions, which was counter-intuitive to expectation, since as noted immediately above the pentadienyl intermediate undergoes a recombination reaction with O2 at the C13 position of substrate. Although at first glance, it may appear that the secondary isotope effects presented herein could be used to estimate the extent of radical delocalization across the pentadienyl system, as has been done in the past to infer the degree of bond rehybridization at the transition state at reacting centers 36, this becomes much less transparent in the context of a full tunneling model. The main conclusion from the data in Figures 1 and 2 is that the inner sphere reorganization that accompanies hydrogen tunneling from C11 cannot be distributed uniformly throughout the bound linoleic acid, but is constrained from significant motions at position 13 for the secondary deuterium.
The Relationship of the Measured 2H and 13C Kinetic Isotope Effects to Equilibrium Limits
The calculation of equilibrium secondary isotope effects has been proposed to provide the upper limit for kinetic values. For example, linear free energy relationships between EIEs and secondary KIEs have been developed by Gajewski et al. and used to estimate the degree of bond formation and bond cleavage in pericyclic reactions 13,39. However, this assumption is only reasonable in reactions where force constants at positions of interest change monotonically in going from reactant to product and do not deviate strongly from semi-classical behavior. For the present study, a 2,5-heptadiene model is used to represent positions C8 through C14 of linoleic acid. Both a fully optimized model corresponding to the lowest energy conformer and one in which the geometry of the pentadienyl radical has been constrained to that for the modeled structure of linoleic acid bound to SLO-1 27, have been considered. The resulting 13C EIEs for conversion of fully optimized 2,5-heptadiene to fully optimized 2,5-heptadienyl radical are nearly equivalent at all positions (Figure 4A), while the 13C EIEs computed for the formation of the radical intermediate in the constrained configuration are larger for the carbon atoms corresponding to C11-C13 in relation to C9 and C10 (Figure 4B). In Figure 5, computed 2H EIEs are shown for the two different conformers of 2,5-heptadiene. As in Figure 4, the first set of calculations (Figure 5A) reports on the energy optimized geometry for the bound linoleic free radical while the values in Figure 5B relate to the constrained geometry. In these cases, the computed isotope effects are fairly similar, independent of the geometry of the heptadienyl radical.
Figure 4.
Computed 13C equilibrium isotope effects for the conversion of fully optimized 2,5-heptadiene to A) fully optimized 2,5-heptadienyl radical and B) 2,5-heptadienyl radical that is constrained to the dihedral angles corresponding to linoleic acid bound to SLO-1. The value for C11 denotes the EIE for conversion of 11,11-d2-linoleic acid.
Figure 5.
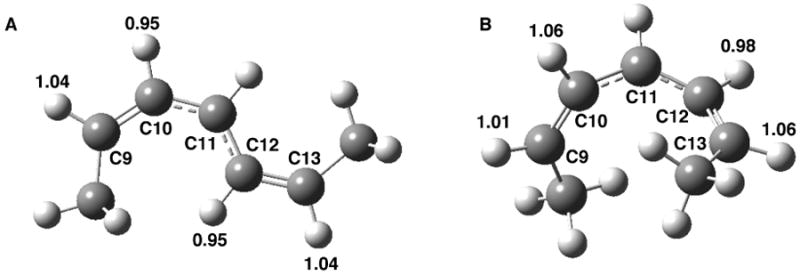
Computed 2H equilibrium isotope effects for the conversion of fully optimized 2,5-heptadiene to A) fully optimized 2,5-heptadienyl radical and B) 2,5-heptadienyl radical that is constrained to the dihedral angles corresponding to linoleic acid bound to SLO-1.
The most significant result to emerge from the comparison of the computed EIEs to the experimental effects is the consistently larger values for the latter. With regard to the 13C KIEs, the computed values are all in the range of ca. 0-1.3 %, with the exception of C11, where a bond has been broken. In any case, for all positions studied, the experimental numbers (Figure 3) exceed the computed values (Figure 4). The discrepancy between computed and experimental numbers becomes especially dramatic for the 2H KIEs (Figure 5, in relation to Figures 1B and 2) where, with the exception of C13, experimental values range from 15 to 33 %.
The first approach in attempting to rationalize the data presented herein was to incorporate a tunneling correction into a transition state model for H-transfer from substrate to the active site Fe(III)-OH, i.e., to see the extent to which such a calculation could elevate the computed 2° 2H and 13C KIEs above the equilibrium limits summarized in Figures 4 and 5. It was decided to compute the transition state starting with the active site constrained 2,6-heptadiene model used for the EIE calculations (Figures 4B and 5B), by application of a full Bell correction (transition state frequency of 1778.2i cm-1). The final values of the computed 13C and 2H KIEs show KIEs that are within 1 % of those calculated from an equilibrium model with the following exceptions: For the 13C KIEs, the value at C11 was elevated 4 % to 1.059, and in the case of the computed 2H KIEs, the KIE at C10 was elevated 3 % while the value at position C13 was elevated 5.5 %. These results show that computing 13C KIEs with a tunneling correction can lead to a match or close approach to the experimental values at C9, C10, C11 and C13, while the value at C12 remains elevated above the highest estimate. In the case of the 2H KIEs, only the values at C13 can be reproduced, with values at C9, C10 and C12 remaining far above estimates using semi-classical theory alone or with a tunneling correction. The effects of changing isotopic mass at a carbon center upon tunneling have been observed in a number of systems. A recent report by Gonzalez-James, et al. explores the ring-opening of a cyclopropylcarbinyl radical to yield the corresponding 3-butene-1-yl radical 40. Experimental measurements of the intramolecular 13C KIE at temperatures spanning from -100 to 80 °C could only be accurately reproduced computationally by including a small curvature tunneling correction. Calculations that did not include tunneling corrections markedly underestimated the 13C KIEs. The reaction pathway for cyclopropylcarbinyl ring opening involves a substantial contribution from heavy atom motion. Hydrogen transfers, by contrast, proceed via reaction pathways that involve significant hydrogenic motion. However, hydrogen transfers – even in reactions that proceed via reaction pathways that deviate strongly from the minimum energy path – also involve heavy atom motion. As Saunders pointed out nearly 30 years ago, what is typically characterized as ‘hydrogen tunneling’ is more correctly identified as a tunneling event that involves the collective motion of atoms necessary to transform the reactant into the product 41,42. It follows that one can expect isotopic changes at carbon centers to significantly influence hydrogen tunneling and that the movement of the carbon backbone may have a tunneling component as well. This explanation is perhaps the most cogent explanation available for the explanation of the 13C KIEs presented in Figure 3.
Alternate Origins of Anomalous KIEs
Although electronically, the conversion of the 1,4-pentadiene moiety in linoleic acid into a pentadienyl radical leaves each secondary position (C9, C10, C12, and C13) unchanged in terms of hybridization, it has been shown in several systems that normal KIEs on the order of 1.06/D can be expected (at 25 °C) for the conversion of an sp2 methylene into an allylic position 43. However, the 2°-2H KIEs measured in this work exceed 1.06 by significant margins with the exception of the C13 position.
In a recent study, Zhang et al. have shown a large inverse secondary 2H KIE at C1 for the low temperature isomerization via tunneling of a cyclopropylcarbinyl radical to 3-butene-1-yl radical 44. The rearrangement of cyclopropylcarbinyl to the 3-butene-1-yl radical effectively converts a radical center at C1 into a double bond:
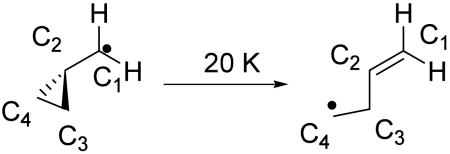 |
This system is relevant to the hydrogen abstraction for the following two reasons: First, while the cyclopropylcarbinyl radical rearrangement involves the transition of the radical-bearing sp2 carbon, C1, to an sp2 carbon participating in a double bond, the hydrogen abstraction from linoleic acid shown in Scheme 1 involves the opposite conversion. Second, the associated 2H KIEs is large (kH/kD = 0.37 at 20 K) at C1 even in the absence of significant bonding changes (the C–H bond lengths at C1 do not change by more than 0.003 Å in proceeding from reactant to product). Extrapolating this value to 298 K, the KIE becomes kH/kD = 0.93. The explanation offered by Zhang et al. for the inverse 2H KIE in the cyclopropyl ring isomerization is an increase in the torsional force constant in the product alkene, in relation to the reactant. This would lead to the expectation of a normal KIE in the lipoxygenase system of ca. 7 %, if there were a decrease in the torsional force constants in proceeding from the 1,4-pentadiene network to conformers of the 1,4-pentadienyl radical. Once again, however, this is smaller than the majority of the experimental effects (Figures 1 and 2). Another example of exalted secondary 2H KIEs arises in the isomerizations of strained alkenes 45,46:
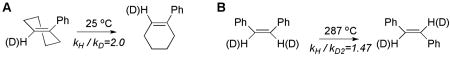 |
Although the double bond remains intact for the above examples, the same principle of release of double bond strain can be invoked, as was discussed in the context of the cyclopropyl carbinyl radical/3-butene-1-yl radical interconversion. In the instances of A and B above, the size of the measured values is closer to those seen in the SLO-1 reaction.
As an import consideration, all of the isotope effects reported herein are on kcat/Km(LA) and reflect differences in force constant at the labeled bonds between unbound substrate and the activated complex. If the origin of the large normal 2° 2H KIEs were release of strain, this would imply that the unbound substrate was considerably more strained than the bound activated complex, an unlikely scenario. An effect of solvation of the bound linoleic acid, arising from differential dispersion interactions between the protio- and deuterio-substrates could be present in the SLO reaction, but these are likely to be very small. Previously measured 2H EIEs in the reverse phase separation of perdeuterated and perprotiated isotopologs of simple organic compounds show effects of ca. 1.01 per D47.
Finally, we note the concomitant elevation of 13C KIEs in SLO-1 (Figure 3), that contrasts with the near unity 13C KIE for the cyclopropyl carbinyl radical/3-butene-1-yl radical interconversion at the carbon centers that do not undergo direct ring cleavage.
2° 2H Effects Rationalized within a Full Tunneling Reaction Coordinate for SLO-1
The extensive tunneling of the primary hydrogen from the C-11 of the substrate linoleic acid during its conversion to the substrate-derived radical intermediate, (Scheme 1) has been the focus of a very large number of studies over the last ten years. In the context of the dominant model, hydrogen transfer occurs principally from the ground state vibrational level of substrate with the barrier for reaction coming from the reorganization of the heavy atoms 5, which can be parsed into inner and outer spheres contributions, λin and λout, respectively. By definition, the inner sphere contribution to lambda comes from the changes in bond angles and distances of the substrate that are necessary to establish a reaction coordinate for effective hydrogenic wave function overlap. These inner sphere motions can be treated either classically or non-classically. In an important contribution, Buhks et al. 48 applied quantum mechanical methods to the contribution of the inner sphere reorganization during electron transfer, and it is our conclusion that such a treatment becomes a necessity in the SLO-1-catalyzed hydrogen transfer reaction. We note that earlier studies from this laboratory 49 also dictated the need for a quantum mechanical treatment in reproducing the size of the O-18 kinetic isotope effect during an outer sphere electron transfer catalyzed by glucose oxidase.
An assessment of the tunneling contribution from the 2° hydrogen atoms attached to C9, C10, C12 and C13 requires assignment of ground state stretching frequencies. While the C-H stretches for these individual positions are not pure normal modes, the C-H stretches are of sufficiently high and similar frequency in the reactant and product to assign an average C-H stretch frequency of 3100 cm-1. Likewise the C-D frequency can be mass adjusted to 2192 cm-1. Because these frequencies lie far above the thermal energy at RT (ca. 200 cm-1) it is quite reasonable to consider the 2H KIEs in the quantum mechanical limit. Using the approach of Buhks et al., the quantum mechanical 2° 2H isotope effects result from differences in inner sphere reorganization that follow from distortion of the reacting bond from its equilibrium geometry. Using the expression derived for electron transfer, it is possible to estimate the quantum mechanical probability for the heavy atom nuclear positions at the instant of the primary hydrogen wave function overlap:
| (7) |
| (8) |
In these equations, ΔG is the reaction driving force, T is temperature, ωH is the vibrational frequency of the motion that gives rise to internal reorganization and yH is the parameter that arises from changes in the bond length at the position under consideration. The parameter, yH, is obtained by solving the saddle point relation 50 for FH (eq 9), which yields eq. 10. Eq 10 can then be solved numerically for yH (See Supporting Information). The same procedure can be iterated for deuterium to yield estimates of FD.
| (9) |
| (10) |
An illustrative calculation has been carried out under the condition of ΔG = -6 kcal/mol and λout = 19 kcal/mol 5 using a range of reasonable λin values. The result is summarized in Figure 6. It can be seen that the size of the KIE is correlated with the size of λin and, further, relatively small values for λin can reproduce the 2° 2H KIE values measured for SLO-1. Given the much greater coupling among the vibrations of the carbon centers C9 to C13, and the resulting difficulty is assessing frequencies for normal mode vibrations, no effort was made to perform a similar estimate for the 13C effects reported herein. In fact, the numbers in Figure 6 are intended as a proof of principle, as the applied formalism derives from theory developed for electron transfer rather than hydrogen transfer reactions. Additionally the calculation has focused on only a single stretching vibration for C-H bonds within the reactant. There is, however, significant precedent for treating phenomena related to hydrogen transfer with theories developed for electron transfer. Perhaps the most compelling example is the reformulation of the Brønsted relation in terms of Marcus parameters 51,52. There is the Kuznetsov-Ulstrup approach to hydrogen tunneling reactions that contains many of the same features as the Marcus theory for electron transfer 53,54.
Figure 6.

Dependence of a 2° 2H KIE upon inner sphere reorganization energy (λin) using a full tunneling model for inner sphere motions.
Despite the above limitations, this treatment points very strongly toward a coherent interpretation of the unusual experimental findings presented herein. We conclude first, that the range of KIEs at each position, Figures 1 to 3, are a reflection of different requirements at positions 9 to 13 of substrate to achieve the requisite inter-nuclear distances and energetics that allow the primary hydrogen to pass as a wave from donor to acceptor atoms, and second, that these secondary and heavy atom motions also contain a tunneling component. We expect that the 2° 2H KIEs will be a more pure representation of changes in bond length at each position while the 13C KIEs will also contain a primary component; the latter may be expected to reflect, in part, transient changes in position between the donor and acceptor atoms that bring the reactants into the appropriate inter-nuclear distance for tunneling. The future attention of theoreticians is called for here, in establishing paradigms for quantitative modeling of secondary hydrogen and carbon isotope effects in the context of extreme non-classical contributions to an inner sphere reorganization process that accompanies the extensive tunneling of a primary hydrogen between a donor and acceptor center.
Conclusions
SLO-1 has served as a paradigmatic system with regard to hydrogen tunneling in enzyme reactions. The behavior reported previously for SLO-1 includes a greatly elevated primary KIE that is only weakly temperature-dependent, leading to the introduction of full tunneling models for enzymatic hydrogen atom transfer reactions. The interrogation of KIEs in SLO-1 has now been extended to the 2° 2H and 13C KIEs within the region of substrate extending from C9 to C11. The use of the NMR technique pioneered by Singleton 22 allows access to these KIEs using either natural abundance 13C or slightly enriched deuterium labeling. The pattern that emerges for the experimental KIES is elevated 2° 2H values for reaction of both 11,11-h2-LA and 11,11-d2-LA, together with inflated 13C KIEs in the case of 11,11-d2-LA, that cannot be rationalized by semi-classical approaches that focus on changes in local force constants, electronic structure or torsional strain. Additionally, the combination of semi-classical modeling with a tunneling correction to the H-transfer reaction coordinate is also unable to reproduce many of the experimental values. We propose that extensive tunneling in the SLO-1 reaction extends beyond the transferred hydrogen to the heavy atom backbone of substrate, as has been proposed previously by Buhks et al. 48 in the context of electron transfer reactions.
Supplementary Material
Acknowledgments
This research was supported by grants to J. P. K. from the NSF (MCB0446395) and the NIH (GM025765), and by an NIH postdoctoral fellowship to M. P. M. (GM064218). We thank Profs. W. H. Miller and S. Hammes-Schiffer for stimulating discussions, and Dr. Sudhir Sharma for the construction of the graph in Figure 7. M. P. M. thanks H. van Halbeek for invaluable help and advice in reliably obtaining quantitative 2H and 13C spectra and TOCSY and HMQC spectra.
Footnotes
The gyromagnetic ratio for 2H is approximately 60 % of that of 13C.
Supporting Information Available: Spectra used for the assignment of 2H and 13C NMR peaks for MHOD. A list of the individual integrations of NMR peaks used for the determination of KIEs. Reactant and transition state structures for the computation of KIEs. Procedure for the syntheses of partially and fully deuterated substrates. Full authorship of ref 30. This material is available free of charge via the Internet at http://pubs.acs.org.
References
- 1.Nakano H, Inoue T, Kawasaki N, Miyataka H, Matsumoto H, Taguchi T, Inagaki N, Nagai H, Satoh T. Bioorg Med Chem. 2000;8:373. doi: 10.1016/s0968-0896(99)00291-6. [DOI] [PubMed] [Google Scholar]
- 2.Cornicelli JA, Trivedi BK. Curr Pharm Des. 1999;5:11. [PubMed] [Google Scholar]
- 3.Kamitani H, Geller M, Eling T. J Biol Chem. 1998;273:21569. doi: 10.1074/jbc.273.34.21569. [DOI] [PubMed] [Google Scholar]
- 4.Tang DG, Honn KV. Ann N Y Acad Sci. 1994;744:199. doi: 10.1111/j.1749-6632.1994.tb52738.x. [DOI] [PubMed] [Google Scholar]
- 5.Knapp MJ, Rickert K, Klinman JP. J Am Chem Soc. 2002;124:3865. doi: 10.1021/ja012205t. [DOI] [PubMed] [Google Scholar]
- 6.Rickert KW, Klinman JP. Biochemistry. 1999;38:12218. doi: 10.1021/bi990834y. [DOI] [PubMed] [Google Scholar]
- 7.Jonsson T, Glickman MH, Sun S, Klinman JP. J Am Chem Soc. 1996;118:10319. [Google Scholar]
- 8.Neshelm JC, Lipscomb JD. Biochemistry. 1996;35:10240. doi: 10.1021/bi960596w. [DOI] [PubMed] [Google Scholar]
- 9.Brazeau BJ, Wallar BJ, Lipscomb JD. J Am Chem Soc. 2001;123:10421. doi: 10.1021/ja016632i. [DOI] [PubMed] [Google Scholar]
- 10.McCusker KP, Klinman JP. Proc Natl Acad Sci USA. 2009;106:19791. doi: 10.1073/pnas.0910660106. [DOI] [PMC free article] [PubMed] [Google Scholar]
- 11.Chowdhury S, Banerjee R. J Am Chem Soc. 2000;122:5417. [Google Scholar]
- 12.Banerjee R, Dybala-Defratyka A, Paneth P. Philos Trans R Soc Lond B Biol Sci. 2006;361:1333. doi: 10.1098/rstb.2006.1866. [DOI] [PMC free article] [PubMed] [Google Scholar]
- 13.Pavon JA, Fitzpatrick PF. J Am Chem Soc. 2005;127:16414. doi: 10.1021/ja0562651. [DOI] [PMC free article] [PubMed] [Google Scholar]
- 14.Abad JL, Camps F, Fabrias G. Angew Chem Int Edit. 2000;39:3279. doi: 10.1002/1521-3773(20000915)39:18<3279::aid-anie3279>3.0.co;2-g. [DOI] [PubMed] [Google Scholar]
- 15.Gupta A, Mukherjee A, Matsui K, Roth JP. J Am Chem Soc. 2008;130:11274. doi: 10.1021/ja8042273. [DOI] [PubMed] [Google Scholar]
- 16.Cha Y, Murray CJ, Klinman JP. Science. 1989;243:1325. doi: 10.1126/science.2646716. [DOI] [PubMed] [Google Scholar]
- 17.Kohen A, Cannio R, Bartolucci S, Klinman JP. Nature. 1999;399:496. doi: 10.1038/20981. [DOI] [PubMed] [Google Scholar]
- 18.Bahnson B, Colby T, Chin J, Goldstein B, Klinman J. P Natl Acad Sci USA. 1997;94:12792. doi: 10.1073/pnas.94.24.12797. [DOI] [PMC free article] [PubMed] [Google Scholar]
- 19.Bahnson B, Park DH, Kim K, Plapp B, Klinman J. Biochemistry. 1993;32:5503. doi: 10.1021/bi00072a003. [DOI] [PubMed] [Google Scholar]
- 20.Klinman JP. Phil Trans R Soc B. 2006;361:1323. doi: 10.1098/rstb.2006.1870. [DOI] [PMC free article] [PubMed] [Google Scholar]
- 21.Nagel ZD, Klinman JP. Chem Rev. 2006;106:3095. doi: 10.1021/cr050301x. [DOI] [PubMed] [Google Scholar]
- 22.Singleton DA, Thomas AA. J Am Chem Soc. 1995;117:9357. [Google Scholar]
- 23.Meyer MP, Klinman JP. Tetrahedron Lett. 2008;49:3600. doi: 10.1016/j.tetlet.2008.04.023. [DOI] [PMC free article] [PubMed] [Google Scholar]
- 24.Thomas AF. Deuterium Labeling in Organic Chemistry. Meredith Corporation; New York: 1971. [Google Scholar]
- 25.Brown HC, Chandrasekharan J. J Org Chem. 1983;48:5080. [Google Scholar]
- 26.Brown HC, Gupta SK. J Am Chem Soc. 1972;94:4370. [Google Scholar]
- 27.Hatcher E, Soudackov AV, Hammes-Schiffer S. J Am Chem Soc. 2004;126:5763. doi: 10.1021/ja039606o. [DOI] [PubMed] [Google Scholar]
- 28.Morris GM, Goodsell DS, Halliday RS, Huey R, Hart WE, Belew RK, Olson AJ. J Comput Chem. 1998:1639. [Google Scholar]
- 29.Tomchick DR, Phan P, Cymborowski M, Minor W, Holman TR. Biochemistry. 2001;40:7509. doi: 10.1021/bi002893d. [DOI] [PubMed] [Google Scholar]
- 30.Frisch MJ, et al. Gaussian 03, Revision C.02. Gaussian, Inc.; Wallingford, CT: 2004. [Google Scholar]
- 31.Becke AD. J Chem Phys. 1993;98:5648. [Google Scholar]
- 32.Stephens PJ, Devlin FJ, Chabalowski CF, Frisch MJ. J Phys Chem. 1994;98:11623. [Google Scholar]
- 33.Francl MM, Pietro WJ, Hehre WJ, Binkley JS, Gordon MS, DeFrees DJ, Pople JA. J Chem Phys. 1982;77:3654. [Google Scholar]
- 34.www.cpan.org.
- 35.Northrop DB. J Am Chem Soc. 1999;121:3521. [Google Scholar]
- 36.Melander L, Saunders WH. Reaction Rates of Isotopic Molecules. Wiley-Interscience; New York: 1980. [Google Scholar]
- 37.Northrop DB. Annu Rev Biochem. 1981;50:103. doi: 10.1146/annurev.bi.50.070181.000535. [DOI] [PubMed] [Google Scholar]
- 38.Wilde TC, Blotny G, Pollack RM. J Am Chem Soc. 2008;130:6577. doi: 10.1021/ja0732330. [DOI] [PubMed] [Google Scholar]
- 39.Gajewski JJ, Conrad ND. J Am Chem Soc. 1979;101:2747. [Google Scholar]
- 40.Gonzalez-James OM, Zhang X, Datta A, Hrovat DA, Borden WT, Singleton DA. J Am Chem Soc. 2010;132:12548. doi: 10.1021/ja1055593. [DOI] [PMC free article] [PubMed] [Google Scholar]
- 41.Wilson JC, Kaellsson I, Saunders WHJ. J Am Chem Soc. 1980;102 [Google Scholar]
- 42.Miller DJ, Subramanian R, Saunders WHJ. J Am Chem Soc. 1981;103 [Google Scholar]
- 43.Olson LP, Niwayama S, Yoo HY, Houk KN, Harris NJ, Gajewski JJ. J Am Chem Soc. 1996;118:886. [Google Scholar]
- 44.Zhang X, Datta A, Hrovat DA, Borden WT. J Am Chem Soc. 2009;131:16002. doi: 10.1021/ja907406q. [DOI] [PubMed] [Google Scholar]
- 45.Tresadern G, McNamara JP, Mohr M, Wang H, Burton NA, Hillier IH. Chem Phys Lett. 2002;358:489. [Google Scholar]
- 46.Caldwell RA, Misawa H, Healy EF, Dewar MJS. J Am Chem Soc. 1987;109:6869. [Google Scholar]
- 47.Turowski M, Yamakawa N, Meller J, Kimata K, Ikegami T, Hosoya K, Tanaka N, Thornton ER. J Am Chem Soc. 2003;125:13836. doi: 10.1021/ja036006g. [DOI] [PubMed] [Google Scholar]
- 48.Buhks E, Bixon M, Jortner J. J Phys Chem. 1981;85:3763. [Google Scholar]
- 49.Roth JP, Klinman JP. P Natl Acad Sci USA. 2003;100:62. doi: 10.1073/pnas.252644599. [DOI] [PMC free article] [PubMed] [Google Scholar]
- 50.Freed KF, Jortner J. J Chem Phys. 1970;52:6272. [Google Scholar]
- 51.Marcus RA. J Chem Phys. 1956:966. [Google Scholar]
- 52.Marcus RA. J Phys Chem-US. 1968;72:891. [Google Scholar]
- 53.Kuznetsov AM, Ulstrup J. Can J Chem. 1999;77:1085. [Google Scholar]
- 54.Meyer MP, Tomchick DR, Klinman JP. P Natl Acad Sci USA. 2008;105:1146. doi: 10.1073/pnas.0710643105. [DOI] [PMC free article] [PubMed] [Google Scholar]
Associated Data
This section collects any data citations, data availability statements, or supplementary materials included in this article.