

Abstract
Most of the components of the membrane and protein traffic machinery were discovered by perturbing their functions, either with bioactive compounds or by mutations. However, the mechanisms responsible for exocytic transport vesicle formation at the Golgi and endosomes are still largely unknown. Both the exocytic traffic routes and the signaling pathways that regulate these routes are highly complex and robust, so that defects can be overcome by alternate pathways or mechanisms. A classical yeast genetic screen designed to account for the robustness of the exocytic pathway identified a novel conserved gene, AVL9, that functions in late exocytic transport. We now describe a chemical-genetic version of the mutant screen, in which we performed a high-throughput phenotypic screen of a large compound library and identified novel small molecule secretory inhibitors. In order to maximize the number and diversity of our hits, the screen was performed in a pdr5Δ snq2Δ mutant background, which lacks two transporters responsible for pleiotropic drug resistance. However, we found that deletion of both transporters reduced the fitness of our screen strain, whereas the pdr5Δ mutation had relatively small effect on growth and was also the more important transporter mutation for conferring sensitivity to our hits. In this and similar chemical-genetic yeast screens, using just a single pump mutation may be sufficient for increasing hit diversity while minimizing the physiological effects of transporter mutations.
Keywords: antifungal agents, biological activity, chemical genetics, inhibitors, protein traffic
Introduction
The signaling pathways that control cell proliferation must regulate the membrane and protein traffic pathways that are required for cell growth and cell division. How these membrane traffic pathways are regulated, in particular at the late sorting steps of the exocytic pathway, is poorly understood. Both the signaling pathways and exocytic routes are highly complex, resulting in numerous alternate mechanisms by which transport to the cell surface can be regulated. The budding yeast, Saccharomyces cerevisiae, has proven to be a powerful model for understanding complex cellular processes, due both to the relative simplicity of this organism and the many tools available that take advantage of its genetic manipulability. Yeast genetic studies played a major role in elucidating the basic signaling pathways by which cells respond to nutrient and other environmental conditions to regulate cell growth and proliferation [1, 2]. Furthermore, many of the components of the membrane traffic machinery were first discovered and characterized in yeast [3, 4]. However, the mechanisms by which cargo is sorted and packaged into transport vesicles in late exocytic compartments (Golgi and endosomes) is still not known. This is in large part because we still need to identify the molecular machineries that carry out exocytic transport from the Golgi and endosomes, and we need to define the signaling mechanisms that regulate traffic from these organelles. The goal of the present study was to identify molecular probes that hold promise to serve as powerful tools for both identifying and understanding the machineries that regulate and carry out late exocytic transport.
The difficulty in identifying components of the late exocytic transport machinery is due to multiple exocytic traffic routes in both yeast and mammalian cells [5, 6], which allow cargo transport by alternate routes when a pathway is blocked [7]. Such ability of cells to overcome defects in late exocytic transport steps has made it difficult to identify the genes involved in mediating and regulating late exocytic transport, necessitating complex and laborious genetic screens [8]. An alternative and potentially more efficient strategy is a chemical genetic version of a successful classical yeast genetic screen that identified a novel component of the late exocytic transport machinery, Avl9 [8]. Here we describe such a chemical genetic screen, in which we identified small molecules that are novel secretory inhibitors. Identifying the molecular and biological targets of these inhibitors will facilitate our understanding of late exocytic transport mechanisms, and how these mechanisms are regulated.
Results and Discussion
Most of the genes involved in membrane traffic were discovered by perturbing their functions either by mutations or with drugs [3, 9, 10]. We used a triple-synthetic-lethal yeast mutant screen to identify a novel eukaryotic gene involved in exocytic transport, AVL9 [8]. This gene is essential in a mutant strain lacking a dynamin homolog, Vps1 [11, 12], and also lacking a subunit of the adaptor protein-1 (AP-1) adaptin complex, Apl2, which is required for forming certain classes of clathrin-coated vesicles at the Golgi and endosomes [8, 13-15]. The apl2Δ vps1Δ double mutant has a block in an exocytic pathway but grows well because cargo is rerouted into a remaining pathway [8]. Mutations or drugs that are lethal for the apl2Δ vps1Δ mutant but have little or no effect on wild-type cells are expected to cause a block in a remaining exocytic pathway. We performed a high-throughput phenotypic screen of a large library of drug-like compounds to identify small molecules that have such a mutant strain-specific effect. An earlier screen produced only a few hits, likely due to the ability of yeast cells, like other fungi, to efficiently pump out a very broad range of structurally and functionally unrelated compounds due to an abundance of ATP-binding cassette (ABC) transporters [16, 17]. S. cerevisiae has at least nine ABC pumps that are localized to the plasma membrane, and at least three of these, Pdr5, Snq2, and Yor1, are involved in pleiotropic drug resistance [17]. The most important of these are Pdr5 and Snq2, which have overlapping but also distinct specificities [18]. To increase the number and diversity of compounds in our phenotypic screen, we added the pdr5Δ and snq2Δ mutations to our vps1Δ apl2Δ strain.
High-throughput screens for mutant-specific growth inhibitors
Before screening the full compound library, we screened a subset of 10,000 compounds for inhibition of growth of the test strain, vps1Δ apl2Δ snq2Δ pdr5Δ (LZY35). The screen was performed in duplicate, in both 384- and 1536-well formats, to check reproducibility of the assay and to confirm the appropriate screening parameters (data not shown, see PubChem Assay ID’s 636 and 637). The Pearson’s correlation between the two runs (all 10,000 compounds) was a moderate 0.4, and the Minimum Significant Difference (MSD, denoting the variability between the two assays) was an acceptable 15.2% inhibition. We then screened 97,519 compounds from the NIH Molecular Libraries Small Molecule Repository for compounds that selectively inhibit the growth of a vps1Δ apl2Δ snq2Δ pdr5Δ strain, when compared to the growth of the snq2Δ pdr5Δ background strain (Figure 1). The screens were run in several batches on different days, with failed plates repeated. The Z’ value for the entire screen (test and background strains) was 0.7 +/− 0.06 S.D. (Figure 2). Actives in the screen were defined as compounds that at 10 μM showed ≥30% inhibition in the assay (see details in Experimental Section). Out of the compounds with an active outcome for the mutant strain, 320 that had an apparent selective activity towards the vps1Δ apl2Δ snq2Δ pdr5Δ strain over the snq2Δ pdr5Δ control strain were reordered for a confirmatory dose response screen.
Figure 1.
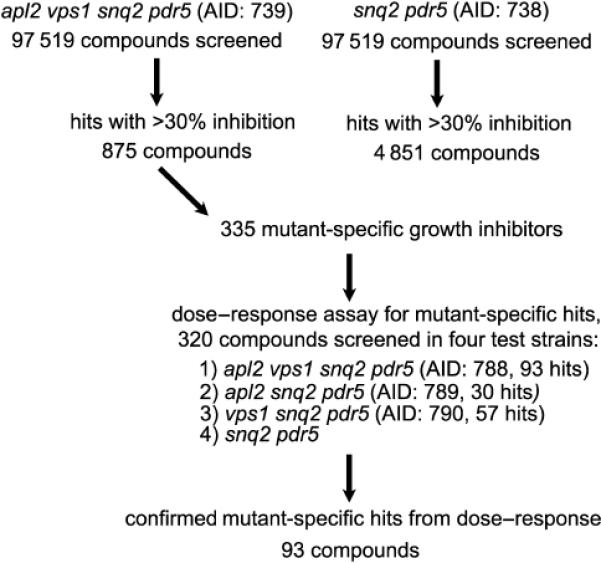
Summary of a high-throughput screen for identifying compounds that preferentially inhibit the growth of a mutant strain having apl2Δ and vps1Δ mutations. PubChem Assay ID’s (AID) are indicated for each screen step.
Figure 2.
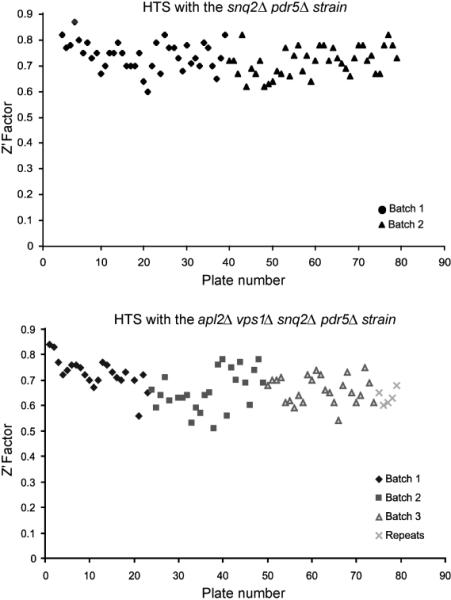
Z’ factors for the high-throughput primary screen. The screen for the background strain (JTY2953, snq2Δ pdr5Δ) was done in two batches. The screen with the mutant strain (LZY35, vps1Δ apl2Δ snq2Δ pdr5Δ) was done in three batches, and a fourth batch was a repeat of plates with ambiguous results.
Dose-response and secondary assays
A 10-point dose-response assay with compound concentration ranging between 0.05 μM and 25 μM was performed for the 320 compounds obtained from the primary screens, for each of the following strains, with the test-mutations indicated in bold: vps1Δ apl2Δ snq2Δ pdr5Δ, vps1Δ snq2Δ pdr5Δ, apl2Δ snq2Δ pdr5Δ, and the snq2Δ pdr5Δ background strain (PubChem Assay ID’s 788, 789, and 790). Of the 320 compounds tested in the dose-response assays, 93 confirmed as being selective for one of the three traffic mutant strains over the control strain. Some of these compounds grouped into structural clusters (Figure 3A). More than half of our 56 top-ranked hits from the dose-response growth assays required both the vps1Δ and apl2Δ mutations for significant growth-inhibitory activity, consistent with the rationale for the design of our chemical genetic screen (Figure 3B). However, some compounds had activity due to the vps1Δ mutation alone (with no increase in effect on the apl2Δ vps1Δ strain). Other compounds significantly affected the growth of the apl2Δ mutant and not the vps1Δ strain; however, all of these had greater activity on the apl2Δ vps1Δ strain, indicating more robustness in Apl2-mediated processes. The different mutant-specificities of our hit compounds indicate that they have unique molecular and biological targets.
Figure 3.

Summary of dose-response end-point growth assays for identifying 93 hit compounds. A) Structural clustering of compounds from the 93 hits. PubChem SID’s for our designated SR numbers are shown in Table 2. The SR number corresponds to the rank from the dose-response assay, with SR2 being the top-ranked compound. B) Data from the dose-response assays allowed grouping of compounds according to specificity for mutants (PubChem AID 788, 789, 790). The majority of our hit compounds were specific for the apl2Δ vps1Δ double mutant. Among the top 56 confirmed compounds (ranked according to dose response growth assay), 13 compounds caused inhibition due to the vps1Δ mutation and were similarly toxic for the apl2Δ vps1Δ mutant; 12 compounds inhibited primarily the apl2Δ vps1Δ mutant but also had significant effect on the apl2Δ mutant; and 31 compounds inhibited the growth of primarily the the apl2Δ vps1Δ double mutant with little or no effect on the apl2Δ or vps1Δ mutants. None of the top 56 compounds inhibited growth the apl2Δ vps1Δ mutant due only to the apl2Δ mutation.
Of our 93 hit compounds from the dose-response growth assay, 24 compounds were chosen for follow-up studies based on: 1) significant selectivity towards the vps1Δ apl2Δ strain over the background strain; 2) representatives of major structural clusters among the identified hits; 3) preference for being active for the vps1Δ apl2Δ mutant over one of the single traffic mutants, but with representatives of each class selected; and 4) chemical tractability. We named these compounds “SR#,” and they are listed, along with other compounds referenced here, in Table 2.
Table 2.
PubChem Substance ID For Compounds Referenced In This Study
| SR# | SID # | SR# | SID # |
|---|---|---|---|
| SR2 | 14730770 | SR30 | 858784 |
| SR3 | 846694 | SR31 | 7976228 |
| SR4 | 14731747 | SR34 | 4264952 |
| SR5 | 3716857 | SR37 | 7978229 |
| SR6 | 17414883 | SR38 | 14740626 |
| SR7 | 17388421 | SR39 | 7976613 |
| SR8 | 17414779 | SR40 | 17414870 |
| SR9 | 14735884 | SR41 | 17406691 |
| SR10 | 848590 | SR42 | 65201738 |
| SR11 | 17411920 | SR43 | 17415595 |
| SR12 | 14731751 | SR45 | 17402823 |
| SR13 | 4252400 | SR46 | 852608 |
| SR14 | 14731776 | SR50 | 17386484 |
| SR15 | 14739450 | SR52 | 846638 |
| SR16 | 850821 | SR53 | 863029 |
| SR17 | 14720508 | SR60 | 14732364 |
| SR20 | 14730765 | SR73 | 14729820 |
| SR21 | 7977933 | SR75 | 14731482 |
| SR22 | 7977576 | SR76 | 14729194 |
| SR23 | 7974278 | SR81 | 7975000 |
| SR25 | 3713939 | SR90 | 17402824 |
| SR26 | 17408707 | SR91 | 7973601 |
| SR27 | 14739448 | SR92 | 17402821 |
| SR28 | 17406960 | SR93 | 14729821 |
| SR29 | 7972891 |
As our first secondary assay, we retested growth in shaking exponential-phase cultures, in presence of compound compared to DMSO control. Whereas the dose-response end-point growth assays were performed in 384-well plates, non-shaking, over ~18 h of growth, the shaking cultures had greater aeration, allowing faster growth, and were assayed only during ~9 h of exponential growth phase (see Experimental Section). Some of the compounds did not show confirmed activity in the shaking-culture assay, likely because they were slow-acting, and therefore would have observable activity over 18 h, with just one end-point measurement taken, but not in the first few hours of exponential growth. Alternatively, some compounds could be more active in lower-oxygen conditions or on slower-growing cells in plates. The shaking-culture secondary screen was repeated with strains having only either the pdr5Δ or only the snq2Δ mutation, to test which drug pump mutation was more critical for compound effect (Figure 4A). Effectiveness of compounds in the presence of just one of these pump mutations was desired because we noticed a drop in growth rate of the vps1Δ apl2Δ mutant when both drug pump mutations were crossed into the strain. In contrast, effect on growth was much less when just one ABC transporter was deleted (Figure 4B), indicating that including just one of these deletion mutations would minimize growth defects or other phenotypes due to pump mutations in our subsequent assays. We found that the pdr5Δ mutation was the more critical one for sensitizing our strain to almost all of the 24 compounds we tested (Figure 4A). This mutation had no effect on the growth of an apl2Δ or a vps1Δ strain, which had a similar growth profile as the pdr5Δ background strain; however, the apl2Δ vps1Δ pdr5 triple mutant did have some growth defect (Figure 4C). We performed our remaining secondary assays using just the pdr5Δ mutation in all strains (wild-type for SNQ2).
Figure 4.

Exponential-growth-rate assays of mutant and background strains. A) Shaking-culture growth assays showed that the pdr5Δ mutation is sufficient for sensitizing yeast strains to most of the compounds (at 20µM) identified as hits in our dose-response assay. Rates were determined from the equation of an exponential curve fitted to the exponential growth curve of each strain (correlation coefficient >0.9) and shown as a percent of the rate without compound added. The sequence of SR numbers corresponds with ranking in the dose-response growth assay, with SR2 being the highest-ranked hit. SR numbers are color-coded according to mutant specificity, as determined by dose-response assays (PubChem AID 788, 789, 790). Corresponding PubChem SID’s are shown in Table 2. B) The pdr5Δ and snq2Δ mutations confer a growth defect on a vps1Δ apl2Δ strain, which is most pronounced if both pdr5Δ and snq2Δ mutations are present and least-pronounced with pdr5Δ. Rates were determined as in (A). C) Microwell-plate exponential growth curves of strains having a pdr5Δ mutation. Strains for A-C are as follows: LZY109 (snq2Δ); LZY108 (pdr5Δ); LZY96 (apl2Δ vps1Δ snq2Δ); LZY104 (apl2Δ vps1Δ pdr5Δ); NY10 (wild-type = “wt”); LZY53 (snq2Δ pdr5Δ); EHY644 (apl2Δ vps1Δ); LZY82 (apl2Δ vps1Δ snq2Δ pdr5Δ = “quad”); LZY119 (vps1Δ pdr5Δ) and LZY120 (apl2Δ pdr5Δ).
Our largest structural group from the 93 compounds identified in the dose-response assays is shown in Figure 5A. Two of these compounds fall into Cluster 1 (Figure 3A), and three-dimensional overlay of all five compounds in this group shows that they have very similar structures (Figure 5B). The dose-response growth assays for these compounds indicated that they were all highly specific for the vps1Δ apl2Δ mutant, with smaller effect on the growth of vps1Δ or apl2Δ mutants. Figure 5C and D show growth assays for SR5, the highest-ranked compound in this group. Furthermore, an assay for invertase-secretion (see Experimental Section) showed that SR5 has an inhibitory effect on secretion that was specific for the vps1Δ apl2Δ mutant and not detected in the other strains (Figure 5E). However, we also found that these compounds were relatively slow-acting, with little effect on growth until ~4h of exponential growth (Figure 5F). This suggests that these compounds may affect signaling pathways that regulate gene expression, or they may need to build up a toxic effect (although higher and lower concentrations of compound showed a similar delay in effect; not shown).
Figure 5.

The largest structural group of hit compounds had greatest specificity for the apl2Δ vps1Δ mutant for inhibiting growth and secretion. A) Compound structures with SR# and PubChem SID. B) 3-dimensional overlay of the five compounds shown in (A), with carbons in each compound colored as the SID #. C) Dose-response end-point growth assay for SR5. The yeast strains are LZY53 (background); LZY81 (vps1Δ); LZY80 (apl2Δ); and LZY82 (vps1Δ apl2Δ); all four strains have snq2Δ pdr5Δ mutations. D) Microwell plate growth curves for SR5 (compare to Figure 4C). E) Invertase secretion assay for SR5 shows a secretion defect specific for vps1Δ apl2Δ. Strains are as in Figure 4C. The means of three experiments (from three independent cultures) are shown. Error bars, SEM. F) Strain LZY104 (apl2Δ vps1Δ pdr5Δ) grown in microwell plates, in either 2.5 μM SR5 or DMSO control. There is no growth defect until ~4h after adding compound.
Another compound of interest is SR28 (Figure 6A), which did not fall into a structural group from our 93 hits. Dose-response and growth-curve analyses indicated that this compound affects primarily vps1Δ (and therefore also the vps1Δ apl2Δ mutant). This compound is of significant interest because it causes a very severe, rapid block in invertase secretion (Figure 6D). Although the greatest effect on secretion is seen in the vps1Δ strain, at higher concentrations there is also significant effect on the apl2Δ and background strains (Figure 6D). Likewise, SR28 caused a significant internal accumulation of the cell wall protein, Bgl2, which at steady-state is normally almost entirely in the cell wall (Figure 6E). Interestingly, the background strain also had slight internal accumulation of Bgl2 at the 30 min time point after adding compound, but this accumulation did not increase, and even decreased slightly, with longer time points, suggesting that the background strain was able to adapt to the transport defect, perhaps by upregulating an alternate transport route that is blocked in the mutant strain.
Figure 6.

SR28 was the most potent secretory inhibitor obtained from the screen. A) Structure of SR28. B) Dose-response end-point growth assay for SR28. C) Microwell plate growth curves for strains grown in 5 μM SR28. D) Invertase secretion assay for strains grown in 2 μM or 5 μM SR28. All strains had a secretory defect in this compound, and the defect was most severe for the vps1Δ and vps1Δ apl2Δ mutants. The means of three experiments (from three independent cultures) are shown. Error bars, SEM. E) Western blots showing the accumulation of internal Bgl2 in 5 μM SR28 at the indicated times. Bgl2 is almost entirely in the cell wall at steady state, so the internal accumulation of this protein can be detected by removing the cell wall. PGK (a cytoplasmic protein) is shown as a loading control. Strains are as in Figure 4C.
Another compound that had a significant and rapid effect on invertase and Bgl2 secretion is SR9 (Figure 7). We tested structurally similar compounds, and found one compound with very similar activity, having PubChem Compound ID 656067 (Figure 7A). The dose-response end-point growth assay for SR9 indicated that all growth effects were due to the vps1Δ mutation, and this was consistent both in our exponential growth curve assays and invertase secretion assays, which likewise showed vps1Δ-specific effects (Figure 7B-D). SR9 was of interest also because unlike the majority of the other hits that we tested, it had a significant effect on secretion even in PDR5 SNQ2 strains (wild-type for drug pumps; not shown), making it more promising in future genome-wide screens for identifying the molecular and biological targets of the compound.
Figure 7.
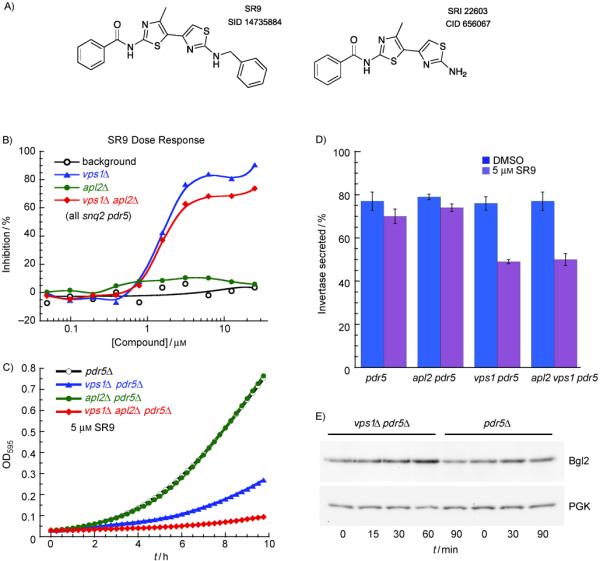
SR9 is a vps1Δ-specific growth and secretory inhibitor. A) Structure of SR9 (left) and an analog (right) with similar activity. B) Dose-response end-point growth assay for SR9 (strains as in Figure 5C). C) Microwell plate growth curves for strains grown in 5 μM SR9 (strains as in Figure 4C). D) Invertase secretion assay for strains grown in 5 μM SR9. The secretory defect is dependent entirely on the vps1Δ mutation. The means of three experiments (from three independent cultures) are shown. Error bars, SEM. E) Western blots showing accumulation of internal Bgl2 after growing strains in 5 μM SR9 for the indicated times. PGK is a loading control.
A group of compounds with similar structures that also did not require pump mutations for effects on growth is shown in Figure 8A. Some of these compounds fell into Cluster 2 (Figure 3A). Additional hit compounds that are similar to these are shown in Figure 8B. The compounds in Figure 8 were among the highest-ranking hits from our dose-response growth assays for potency and selectivity for the vps1Δ apl2Δ strain, with some activity for the apl2Δ strain, and little or no effect on either vps1Δ or the background strain (Figure 8C, D). The lack of effect on the vps1Δ strain differentiates these compounds from others that we analyzed in detail (Figures 5-7), so it is likely that they have a different molecular and biological target than those of the other hits. Interestingly, these compounds were effective primarily in rich media (YPD), with little effect in minimal (synthetic) media (such as CSM) (our unpublished observations). This effect of media is interesting because it resembles the phenotype of yeast ras mutants as well as mutants of the yeast synaptobrevin homologs, which function in targeting exocytic vesicles to the plasma membrane[19]. We also found that the compounds were slow-acting, and therefore difficult to analyze in our transport assays. Like the compounds in Figure 5, they may affect signaling pathways that respond to transport blocks by regulating gene expression.
Figure 8.
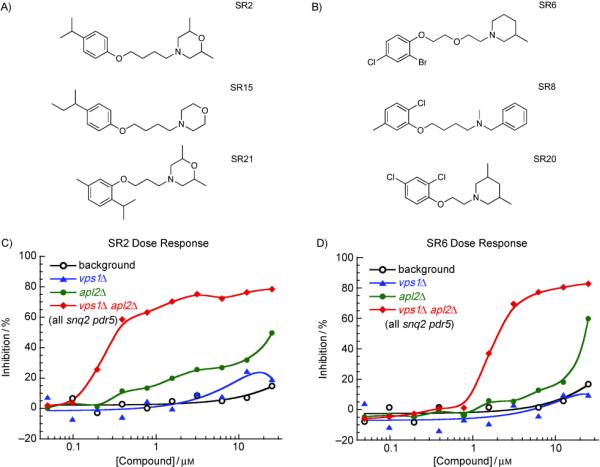
Cluster 2 and similar compounds were highly selective for the vps1Δ apl2Δ double mutant. A) Structures for two Cluster 2 and one closely related compound. B) Additional compounds that resemble Cluster 2 compounds. C) The Cluster 2 compound, SR2, ranked highest in our dose-response screen. It is highly selective for inhibiting the growth of the apl2Δ vps1Δ double mutant in microwell plates (shown) and agar plates (not shown). D) Compounds shown in (B) were also specific for the vps1Δ apl2Δ mutant. Yeast strains are as in Figure 4C.
Many of the 24 compounds selected for secondary assays did not block invertase secretion in our assays. Some of these compounds may have a delayed effect and block secretion at a later time point. Alternatively, they may have vps1Δ apl2Δ mutant-specific toxicity that is not due to blocking exocytic transport. Recent studies have suggested that traffic mutants are particularly prone to drug hypersensitivity, perhaps because they are defective in trafficking of drug transporters that function in detoxification either at the cell surface or at the vacuole [20, 21]. However, we would expect a larger number of hits if our screen merely identified toxic substances due to a general drug-sensitivity of our test strain. Analysis of screen results submitted by others to PubChem suggests that our compounds were highly specific for our screen, in particular at the dose-response or confirmatory steps, again arguing against general drug-sensitivity of our screen strain. Furthermore, because both the vps1Δ apl2Δ mutant and control background strain had a significant defect in detoxification due to the pdr5Δ snq2Δ mutations, neither test nor control strain could efficiently eliminate drugs, so most of our hits likely target a process that is relevant to membrane traffic function. Therefore, even compounds that do not rapidly block secretion are of potential future interest. For example, they could trigger signaling mechanisms that shut down growth in response to traffic defects.
Conclusions
Using a high-throughput phenotypic screen, we identified 93 compounds that specifically affect the growth of a mutant strain blocked in one branch of the exocytic pathway. Our analysis of selected compounds from these hits indicates that at least some of our mutant-specific growth inhibitors are novel secretory inhibitors that likely affect a transport pathway that remains functional in the mutant in the absence of drugs. Therefore, further analysis of our hits is expected to identify additional traffic inhibitors.
Identifying the molecular targets of our inhibitors, as well as biological effects in genome-wide fitness assays [22, 23], will contribute to a better understanding of the mechanisms that mediate late exocytic transport. Some of our compounds are expected to target Avl9 or an Avl9-related process, since they generate an AVL (apl2Δ vps1Δ lethal) phenotype, similar to that of avl9Δ [8]. Avl9 is a conserved, ancient eukaryotic protein and a member of a novel superfamily of ancient paralogs, most of which have not been studied in any organism [8]. Therefore, the hits identified in our HTS assay may serve as useful tools for discovering a potentially novel function mediated by Avl9 and its homologs. Prior to seeking the targets of our new inhibitors, we may need to optimize our compounds by testing analogs for potency as well as specificity for the traffic mutant strains. The possibility of non-specific effects is common to all small molecule screens, whether the screens involve in vitro assays or a cell-based phenotypic assay such as ours [24]. However, low-specificity compounds would be expected to be similarly toxic to the background control strain in our assays. Therefore, some of our hits should have sufficient specificity for simple screens that could help to identify potential target(s), for example a gene-dosage screen [25].
Although some of our hit compounds may have pleiotropic effects, mutations likewise can have pleiotropic effects, and specificity of effect is not necessarily a greater concern with small molecules than it is with mutants as tools to study gene function. For example, most bioactive small molecules do not primarily affect protein target levels, whereas many mutations do affect protein abundance, causing pleiotropic effects especially in cases where the protein is normally a part of a complex [24]. Furthermore, our chemical genetic strategies are likely to identify genes that would be difficult or impossible to identify by the classical genetic mutant screen that identified Avl9. For example, gene mutations that result in very severe growth phenotypes even in the presence of APL2 and VPS1, or which have only sickness rather than lethal phenotypes when their functions are blocked in the screen strain background, would not be so readily identified in the mutant screen. Therefore, our chemical genetic strategy is a valuable complement to classical genetics for understanding the mechanisms and regulation of late exocytic transport.
Experimental Section
Yeast strains and reagents
The construction or origin of yeast strains used in this study are shown in Table 1. Strains were generated by crosses using standard yeast genetic techniques [26]. In some cases, sequential crosses were needed using progeny from the indicated parents in order to obtain the desired combined mutations. The primary screen strains were JTY2953 (snq2Δ pdr5Δ) and an snq2Δ pdr5Δ vps1Δ apl2Δ strain derived from it, LZY35 (AID 738, 739). These strains are adenine auxotrophs (due to the ade2-101 allele, common in many laboratory strains). In order to improve strain growth and to back-cross mutant strains into our wild-type background, new strains having wild-type ADE2 were constructed for use in all subsequent screening steps and assays. These strains have primarily an S288c background [27]. Additional strains were constructed to cross out a suc2Δ mutation (deletion of the gene for invertase) to enable us to perform invertase secretion assays. Strains were grown in YPAD medium: Difco Bacto yeast extract (1%), Difco Bacto peptone (2%), and glucose (2%), supplemented with adenine hemisulfate (20 mg/L). Screening compounds (a ~97,000 compound library) were from the Molecular Libraries Small Molecule Repository. All compounds were provided by BioFocus DPI in dimethyl sulfoxide (DMSO, 100%) at a concentration of 10 mM.
Table 1.
S. cerevisiae Strains Used in This Study
| Strain | Genotype | Source |
|---|---|---|
| GPY1783-10A | MATα apl2Δ::TRP1 his3-Δ200 leu2-3,112 trp1-Δ901 ura3-52 suc2-Δ9 | Yeung et al. 1999 |
| JTY2953 |
MATa pdr5::TRP1 snq2::hisG ade2-101 his3-Δ200 leu2-Δ1 lys2-801am trp1-Δ63 ura3-52 |
Egner et al. 2000 |
| NY10 | MATα ura3-52 | Salminen and Novick, 1987 |
| EHY644 | MATa vps1Δ::LEU2 apl2Δ::TRP1 trp1 leu2-3,112 ura3-52 his3-Δ200 | Harsay and Schekman, 2007 |
| EHY1172 | MATα vps1Δ::LEU2 apl2Δ::KAN trp1 leu2-3,112 ura3-52 ade2-101 ade3 | Harsay and Schekman, 2007 |
| LZY35 |
MATa vps1Δ::LEU apl2Δ::KAN pdr5::TRP1 snq2::hisG ade2-101 his3-Δ200 leu2 trp1-Δ63 ura3-52 |
JTY2953 × EHY1172 |
| LZY40 |
MATαvps1Δ::KAN apl2Δ::TRP1 leu2-3,112 his3-Δ200 trp1-Δ901
ura3-52 suc2-Δ9 |
GPY1783-10A, deleted vps1 |
| LZY50 |
MATα apl2Δ::TRP1 pdr5::TRP1 snq2::hisG his3-Δ200 leu2 trp1
lys2-801am ura3-52 |
JTY2953 × GPY1783-10A |
| LZY53 | MATα pdr5::TRP1 snq2::hisG his3-Δ200 leu2 lys2-801 trp1 ura3-52 | JTY2953 × GPY1783-10A |
| LZY80 | MATα apl2Δ::KAN pdr5::TRP1 snq2::hisG his3-Δ200 leu2 trp1 ura3-52 | LZY35 × LZY53 |
| LZY81 | MATa vps1Δ::LEU2 pdr5::TRP1 snq2::hisG his3-Δ200 leu2 trp1 ura3-52 lys2-801am |
LZY35 × LZY53 |
| LZY82 | MATa vps1Δ::LEU apl2Δ::KAN pdr5::TRP1 snq2::hisG his3-Δ200 leu2 trp1 ura3-52 lys2-801am suc2-Δ9 |
LZY35 × LZY53 |
| LZY96 | MATa vps1Δ::LEU2 apl2Δ::TRP1 snq2::hisG leu2 his3-Δ200 trp1 ura3-52 | LZY40 × LZY35 |
| LZY104 |
MATαvps1Δ::LEU2 apl2Δ::TRP1 pdr5::TRP1 his3-Δ200 leu2 lys2-801am
trp1 ura3-52 |
LZY53 × EHY644 |
| LZY108 | MATa pdr5::TRP1 his3-Δ200 leu2 lys2-801am trp1 ura3-52 | LZY53 × EHY644 |
| LZY109 | MATa snq2::hisG his3-Δ200 leu2 lys2-801am trp1 ura3-52 | LZY53 × EHY644 |
| LZY113 | MATa vps1Δ::LEU2 snq2::hisG leu2 his3-Δ200 trp1 ura3-52 lys2-801am | LZY53 × EHY644 |
| LZY115 | MATa apl2Δ::TRP1 snq2::hisG leu2 his3-Δ200 trp1 ura3-52 | LZY53 × EHY644 |
| LZY119 | MATa vps1Δ::LEU2 pdr5::TRP1 leu2 his3-Δ200 trp1 ura3-52 | LZY53 × EHY644 |
| LZY120 | MATa apl2Δ::TRP1 pdr5::TRP1 leu2 his3-Δ200 trp1 ura3-52 | LZY53 × EHY644 |
High-Throughput Screens
Yeast strains were maintained as frozen glycerol stocks or on YPD agar plates (kept at 4°C for up to two weeks). Two days before screening, ~4 colonies were inoculated into YPAD (50 mL) and grown at 30°C with aeration on a rotating platform (260 rpm) for 18-24 h to mid-exponential phase (OD600 0.5-0.9, read in a Genesys 5 spectrophotometer, Thermo-Spectronic Instruments). This primary culture was inoculated into YPAD such that the secondary culture, grown at 30°C for ~20 h, was OD600 0.04 (strain JTY2953) and 0.1 (strain LZY35) at the time of plating for the screen. This was done by first determining the growth rate of each screen strain, so that the secondary culture would not need to be diluted prior to plating, thus minimizing a lag in growth at the start of the screen. The initial plating density of cells resulted in cultures nearing the end of exponential growth after ~18h growth in plates.
For the primary screens (AID 738, 739), compound (7.5 nL) was added to YPAD medium (1 μL) in 1536-well black, clear bottom plates (Corning), and secondary yeast culture (7 μL) was added to the plates for a final compound concentration of 10 μM and a final DMSO concentration of 0.1%. Each plate contained control wells, with YPAD medium containing DMSO (0.1%) serving as negative control and KU#7 (1.25 μg/mL), DMSO (0.1%) as positive control [16]. Liquid handling steps were performed with a Biomek FX liquid handler (Beckman Coulter), a Multidrop Combi dispenser (Thermo Scientific), or an Echo 550 liquid handler (Labcyte). After adding the yeast culture to all wells, the plates were incubated with lids (un-sealed), and inverted, at 30°C for 18 h in a humidified atmosphere. Incubating the plates inverted maximized cell growth due to better access to oxygen, as the cells settled at the surface of the medium. Following incubation, the plates were slowly shaken before the reading at OD615 in an EnVision multilabel plate reader (PerkinElmer).
For the dose response screens (AID 788, 789, 790), 320 compounds that selectively inhibited the growth of the vps1Δ apl2Δ mutant in the primary screen were retested in a 10-point dose response assay. Compounds were diluted in YPD medium to prepare a 10× concentrated dosing solution (250 μM) from which a 10-concentration, 2-fold dilution series was prepared in YPD medium and added to 384-well clear plates (Corning) in 5 μL. The yeast cultures (strains LZY53, LZY80, LZY81 and LZY82) were grown as for the primary screen to generate an early-exponential phase culture, and yeast culture (45 μL) was added to the plates with compounds for final compound concentrations between 0.05 μM and 25 μM, and a final DMSO concentration of 0.25%. Positive and negative controls were as for the primary screen. The plates were incubated at 30°C in a humidified atmosphere for 18 h, and OD615 was read in an EnVision multilabel plate reader.
Data analysis for primary and dose-response screens
All data from primary screens and dose-response assays were imported into ActivityBase (IDBS) data management software for analyses. For the primary screens, percent inhibition for both the control and mutant strains was calculated as: 100 × (1-(Median of test compound – Median of positive control)/Median of negative control – Median of positive control)). Active compounds were those that showed ≥30% inhibition (30% is the average compound % inhibition plus three times the standard deviation of compound % inhibition). Among the compounds chosen as having ≥30% inhibition, a hit was determined to be any compound that was significantly more toxic to the mutant test strain than to the control background strain. Compounds that showed less than 30% inhibition were defined as Inactive. Compounds that were screened more than once and had both Active and Inactive outcomes were labeled Inconclusive. For the dose-response screens, the percent inhibition of growth rate was calculated as: 100 × ([growth rate DMSO-treated cells]-[growth rate compound-treated cells])/[growth rate DMSO-treated cells].
Secondary screens
For secondary screening, 24 compounds from the 93 dose-response hits were reordered from the original suppliers and subjected growth and secretion assays in mutant and background strains. The first assay was a shaking-culture growth rate assay to determine growth rates during exponential growth were measured. Strains were grown in YPD overnight to exponential growth phase, and culture densities were adjusted to OD600 0.07 in YPD (8 mL), in 25×150 mm glass culture tubes. Compounds were added at the indicated concentrations for a final volume of 10 mL and final DMSO concentration of 0.25%, and tubes were placed on a roller drum (Bellco) rotating at 50 rpm. OD600 readings were taken every two hours, for at least 4 readings to generate a growth curve. Rates were calculated from an exponential curve fit equation. The correlation coefficient (Pearson r) was >0.9 in each case. Secondary growth assays to generate growth curves were also performed in 96-well plates. OD595 was read with a Model 680 microplate reader (Bio-Rad) controlled by Microplate Manager software (Bio-Rad).
We tested selected hit compounds in two established secretion assays. The first was an invertase secretion assay [3]. Cells were grown overnight to exponential phase, then grown in YPD with high glucose (5%) for 2-3 hours on a roller drum at 50 rpm. Compound was added at the indicated concentration (or DMSO control, 0.25% final concentration), and cultures were grown for 15 min, followed by shifting cells to YPD with low glucose (0.1%) and compound or DMSO control for 90 min prior to performing the invertase secretion assay as described previously [8]. For slow-acting compounds (Figure 5E), the cells were grown in compound for 3h rather than 15 min prior to derepressing invertase expression. Invertase expression is repressed in high-glucose media, but upon shifting to low glucose, its expression is rapidly derepressed. Therefore, all invertase expression and secretion occurs after compound addition. As a second secretory assay, we assayed for internal accumulation of an abundant cell wall protein, Bgl2, as described previously[8].
Acknowledgment
We thank Frantisek Supek (Novartis Research Foundation) for suggesting the use of the snq2 and pdr5 mutations in our screen. This work was supported by NIH grants X01 MH077628 and R21 NS061754 (to E. H.) and by the NIH Molecular Libraries Screening Center Network (U54 HG003917-01, to G. P.).
References
- [1].Zaman S, Lippman SI, Zhao X, Broach JR. Annu. Rev. Genetics. 2008;42:27–81. doi: 10.1146/annurev.genet.41.110306.130206. [DOI] [PubMed] [Google Scholar]
- [2].Chen RE, Thorner J. Biochimica et biophysica acta. 2007;1773(8):1311–1340. doi: 10.1016/j.bbamcr.2007.05.003. [DOI] [PMC free article] [PubMed] [Google Scholar]
- [3].Novick P, Field C, Schekman R. Cell. 1980;21:205–215. doi: 10.1016/0092-8674(80)90128-2. [DOI] [PubMed] [Google Scholar]
- [4].Schekman R. Nat. Cell Biol. 2004;6(6):483–486. doi: 10.1038/ncb0604-483. [DOI] [PubMed] [Google Scholar]
- [5].Harsay E, Bretscher A. J. Cell Biol. 1995;131(2):297–310. doi: 10.1083/jcb.131.2.297. [DOI] [PMC free article] [PubMed] [Google Scholar]
- [6].Rodriguez-Boulan E, Musch A, Le Bivic A. Curr. Opin. Cell Biol. 2004;16(4):436–442. doi: 10.1016/j.ceb.2004.06.013. [DOI] [PubMed] [Google Scholar]
- [7].Harsay E, Schekman R. J. Cell Biol. 2002;156(2):271–285. doi: 10.1083/jcb.200109077. [DOI] [PMC free article] [PubMed] [Google Scholar]
- [8].Harsay E, Schekman R. Mol. Biol. Cell. 2007;18(4):1203–1219. doi: 10.1091/mbc.E06-11-1035. [DOI] [PMC free article] [PubMed] [Google Scholar]
- [9].Niemann H, Blasi J, Jahn R. Trends Cell Biol. 1994;4:179–185. doi: 10.1016/0962-8924(94)90203-8. [DOI] [PubMed] [Google Scholar]
- [10].Malhotra V, Orci L, Glick BS, Block MR, Rothman JE. Cell. 1988;54(2):221–227. doi: 10.1016/0092-8674(88)90554-5. [DOI] [PubMed] [Google Scholar]
- [11].Rothman JH, Raymond CK, Gilbert T, O’Hara PJ, Stevens TH. Cell. 1990;61(6):1063–1074. doi: 10.1016/0092-8674(90)90070-u. [DOI] [PubMed] [Google Scholar]
- [12].Obar RA, Collins CA, Hammarback JA, Shpetner HS, Vallee RB. Nature. 1990;347(6290):256–261. doi: 10.1038/347256a0. [DOI] [PubMed] [Google Scholar]
- [13].Rad MR, Phan HL, Kirchrath L, Tan PK, Kirchhausen T, Hollenberg CP, Payne GS. J. Cell Sci. 1995;108(Pt 4):1605–1615. doi: 10.1242/jcs.108.4.1605. [DOI] [PubMed] [Google Scholar]
- [14].Valdivia RH, Baggott D, Chuang JS, Schekman RW. Dev. Cell. 2002;2(3):283–294. doi: 10.1016/s1534-5807(02)00127-2. [DOI] [PubMed] [Google Scholar]
- [15].Hirst J, Robinson MS. Biochimica et biophysica acta. 1998;1404(1-2):173–193. doi: 10.1016/s0167-4889(98)00056-1. [DOI] [PubMed] [Google Scholar]
- [16].Zhang L, Huang M, Harsay E. Eukaryot. Cell. 2010;9(1):116–126. doi: 10.1128/EC.00184-09. [DOI] [PMC free article] [PubMed] [Google Scholar]
- [17].Sipos G, Kuchler K. Current drug targets. 2006;7(4):471–481. doi: 10.2174/138945006776359403. [DOI] [PubMed] [Google Scholar]
- [18].Hirata D, Yano K, Miyahara K, Miyakawa T. Current genetics. 1994;26(4):285–294. doi: 10.1007/BF00310491. [DOI] [PubMed] [Google Scholar]
- [19].Protopopov V, Govindan B, Novick P, Gerst JE. Cell. 1993;74(5):855–861. doi: 10.1016/0092-8674(93)90465-3. [DOI] [PubMed] [Google Scholar]
- [20].Ericson E, Gebbia M, Heisler LE, Wildenhain J, Tyers M, Giaever G, Nislow C. PLoS genetics. 2008;4(8):e1000151. doi: 10.1371/journal.pgen.1000151. [DOI] [PMC free article] [PubMed] [Google Scholar]
- [21].Hillenmeyer ME, Fung E, Wildenhain J, Pierce SE, Hoon S, Lee W, Proctor M, St.Onge RP, Tyers M, Koller D, Altman RB, Davis RW, Nislow C, Giaever G. Science. 2008;320(5874):362–365. doi: 10.1126/science.1150021. [DOI] [PMC free article] [PubMed] [Google Scholar]
- [22].Shoemaker DD, Lashkari DA, Morris D, Mittmann M, Davis RW. Nature genetics. 1996;14(4):450–456. doi: 10.1038/ng1296-450. [DOI] [PubMed] [Google Scholar]
- [23].Giaever G, Chu AM, Ni L, Connelly C, Riles L, Veronneau S, Dow S, Lucau-Danila A, Anderson K, Andre B, Arkin AP, Astromoff A, El-Bakkoury M, Bangham R, Benito R, Brachat S, Campanaro S, Curtiss M, Davis K, Deutschbauer A, Entian KD, Flaherty P, Foury F, Garfinkel DJ, Gerstein M, Gotte D, Guldener U, Hegemann JH, Hempel S, Herman Z, Jaramillo DF, Kelly DE, Kelly SL, Kotter P, LaBonte D, Lamb DC, Lan N, Liang H, Liao H, Liu L, Luo C, Lussier M, Mao R, Menard P, Ooi SL, Revuelta JL, Roberts CJ, Rose M, Ross-Macdonald P, Scherens B, Schimmack G, Shafer B, Shoemaker DD, Sookhai-Mahadeo S, Storms RK, Strathern JN, Valle G, Voet M, Volckaert G, Wang CY, Ward TR, Wilhelmy J, Winzeler EA, Yang Y, Yen G, Youngman E, Yu K, Bussey H, Boeke JD, Snyder M, Philippsen P, Davis RW, Johnston M. Nature. 2002;418(6896):387–391. doi: 10.1038/nature00935. [DOI] [PubMed] [Google Scholar]
- [24].Ovaa H, van Leeuwen F. ChemBioChem. 2008;9(18):2913–2919. doi: 10.1002/cbic.200800454. [DOI] [PubMed] [Google Scholar]
- [25].Luesch H, Wu TY, Ren P, Gray NS, Schultz PG, Supek F. Chemistry & biology. 2005;12(1):55–63. doi: 10.1016/j.chembiol.2004.10.015. [DOI] [PubMed] [Google Scholar]
- [26].Sherman F. Methods in enzymology. 2002;350:3–41. doi: 10.1016/s0076-6879(02)50954-x. [DOI] [PubMed] [Google Scholar]
- [27].Mortimer RK, Johnston JR. Genetics. 1986;113:35–43. doi: 10.1093/genetics/113.1.35. [DOI] [PMC free article] [PubMed] [Google Scholar]