Abstract
The glucagon-like peptide 1 (GLP1) receptor is an important drug target within the B family of G protein-coupled receptors. Its natural agonist ligand, GLP1, has incretin-like actions and the receptor is a recognized target for management of type 2 diabetes mellitus. Despite recent solution of the structure of the amino terminus of the GLP1 receptor and several close family members, the molecular basis for GLP1 binding to and activation of the intact receptor remains unclear. We previously demonstrated molecular approximations between amino- and carboxyl-terminal residues of GLP1 and its receptor. In this work, we study spatial approximations with the mid-region of this peptide to gain insights into the orientation of the intact receptor and the ligand-receptor complex. We have prepared two new photolabile probes incorporating a p-benzoyl-l-phenylalanine into positions 16 and 20 of GLP1(7–36). Both probes bound to the GLP1 receptor specifically and with high affinity. These were each fully efficacious agonists, stimulating cAMP accumulation in receptor-bearing CHO cells in a concentration-dependent manner. Each probe specifically labeled a single receptor site. Protease cleavage and radiochemical sequencing identified receptor residue Leu141 above transmembrane segment one as its site of labeling for the position 16 probe, whereas the position 20 probe labeled receptor residue Trp297 within the second extracellular loop. Establishing ligand residue approximation with this loop region is unique among family members and may help to orient the receptor amino-terminal domain relative to its helical bundle region.
Keywords: Diabetes, G Protein-coupled Receptors (GPCR), Peptide Interactions, Protein Chemistry, Protein Cross-linking, Receptor Structure-function, Glucagon-like Peptide 1, Ligand Binding, Molecular Modeling, Photoaffinity Labeling
Introduction
G protein-coupled receptors (GPCRs)4 comprise a large family of plasma membrane receptors, binding molecules outside the cell that initiate intracellular signal transduction pathways and cellular responses. These molecules are targets for more than one-third of approved drugs. Family B GPCRs represent a relatively small group of receptors that nonetheless include important potential drug targets. Among these are receptors for secretin, vasoactive intestinal polypeptide, corticotropin-releasing factor (CRF), glucagon, glucagon-like peptide 1 (GLP1), calcitonin, and parathyroid hormone (PTH) (1).
The GLP1 receptor is an important drug target within family B GPCRs. Its natural ligand, GLP1, has multiple antidiabetic actions, including promotion of insulin secretion, the preservation of β-cell mass, and the ability to lower body weight. A series of drugs have been developed and introduced that target this receptor for the treatment of type 2 diabetes mellitus (2). Like other natural ligands of this family, GLP1 is a moderately large and flexible peptide with a diffuse pharmacophore extending throughout its entire length, providing challenge to our understanding of its interaction with its receptor.
Family B GPCRs all have a long and structurally characteristic extracellular amino-terminal domain stabilized by three pairs of disulfide bonds linking six conserved cysteine residues. This domain functions as the predominant pocket for binding the carboxyl-terminal regions of the natural ligands based on mutagenesis, ligand structure-activity, and photoaffinity labeling studies (3–12). Recently, NMR and crystal structures have been described for segments of the isolated ligand-bound amino-terminal domain of the receptors for CRF1 (13–15), gastric inhibitory polypeptide (16), GLP1 (17, 18), pituitary adenylate cyclase activating peptide (19), PTH1 (20), and calcitonin gene-related peptide (21, 22). In all these structures, the carboxyl-terminal regions of the ligands are docked within a binding cleft of the amino-terminal domain of the receptors with similar general modes of ligand binding. However, there are inconsistencies in the absolute poses of the peptide ligands relative to their receptor amino-terminal domains (26), suggesting some variation in binding mechanisms among family members. Additionally, these structures do not provide any information on the mode of docking of the flexible amino-terminal regions of the ligands that are critical for their biological activity. Although the ligand amino-terminal regions are thought to interact with the receptor core regions, in the absence of adequate experimental constraints, even the orientation of the receptor amino terminus with the receptor transmembrane (TM) core varies tremendously in the different proposed models.
In the absence of high-resolution structures of intact GPCRs within family B, our understanding of the natural ligand binding and activation of this group of receptors is very limited. In mutagenesis studies, multiple extracellular loop domains (ECLs) and the amino-terminal domain of the receptor have been suggested to contribute to ligand binding (23). We recently started using a more direct approach, intrinsic photoaffinity labeling, to explore the spatial approximations between GLP1 residues and its receptor, hoping to elucidate the entire ligand-binding pocket. We have demonstrated that carboxyl-terminal positions 24 and 35 (24) and amino-terminal position 12 (25) GLP1 probes all label the intact receptor within the region of the amino-terminal domain that is adjacent to TM1. Interestingly, the amino-terminal position six probe labeled a receptor residue within ECL1 (25), providing the first experimentally derived constraint for docking the amino-terminal region of GLP1 to the core of the receptor. In the current work, we have focused on the mid-region of GLP1 to explore if this might be spatially approximated with other unique and useful receptor regions for refining our understanding of the global docking of this ligand with its receptor.
In this work, we have developed two new GLP1 probes incorporating a photolabile p-benzoyl-l-phenylalanine (Bpa) into the mid-region of the peptide, in positions 16 and 20. Both probes were fully efficacious agonists that bound to and affinity labeled the GLP1 receptor specifically and saturably. Peptide mapping with protease cleavage followed by radiochemical Edman degradation sequencing identified residue Leu141 within the amino-terminal domain and Trp297 within ECL2 of the receptor as the sites of labeling for the position 16 and 20 probes, respectively, providing two important constraints for molecular modeling. These represent the first demonstration of direct residue-residue approximations between mid-region residues of GLP1 and the core of its receptor. Together with the four pairs of previously established constraints, these were built into a molecular model of the intact GLP1 receptor docked with its natural ligand. These should contribute substantially to our understanding of the molecular basis of ligand binding and activation of the clinically important GLP1 receptor, with likely relevance to other members of this family.
EXPERIMENTAL PROCEDURES
Materials
Human GLP1(7–36)-amide (GLP1) was purchased from Bachem (Torrance, CA). The solid-phase oxidant, N-chlorobenzenesulfonamide (IODO-BEADs) and m-maleimidobenzoyl-N-hydroxysulfosuccinimide ester (Sulfo-MBS) were purchased from Pierce Chemical Co. Endoproteinase Lys-C (Lys-C) was from Roche Applied Science. Endoproteinase Glu-C (Glu-C) and endoproteinase Asp-N (Asp-N) were from New England Biolabs Inc. (Ipswich, MA). 3-Isobutyl-1-methylxanthine and N-(2-aminoethyl-1)-3-aminopropyl glass beads were from Sigma. Fetal Clone II was from HyClone Laboratories (Logan, UT) and tissue culture medium was from Invitrogen. All other reagents were of analytical grade.
Peptides
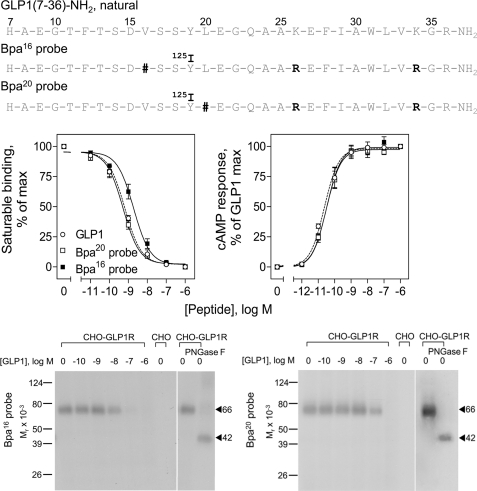
The photolabile GLP1 probes, [Arg26,34,Bpa16]GLP1(7–36) (Bpa16 probe) and [Arg26,34,Bpa20]GLP1(7–36) (Bpa20 probe), were designed to incorporate a photolabile Bpa to replace Val16 and Leu20 in the mid-region of the ligand, respectively (Fig. 1, top panel). Lysine residues in positions 26 and 34 were replaced by arginines to prevent cleavage with endoproteinase Lys-C that was critical to our localization efforts. This change has previously been shown to be well tolerated (26). Both probes contained a naturally occurring tyrosine residue in position 19 as a site for radioiodination. They were synthesized by manual solid-phase techniques and purified by reverse-phase HPLC as we described previously (27). Both probes and natural ligand GLP1 (used as radioligand) were radioiodinated oxidatively using 1 mCi of Na125I (PerkinElmer Life Sciences) and a 15-s exposure to one IODO-BEAD, a solid-phase oxidant. Products were purified using reversed-phase HPLC to yield specific radioactivities of 2,000 Ci/mmol (28).
FIGURE 1.
Characterization of photolabile probes. Top, primary structures of the Bpa16 and Bpa20 probes. Shown are the amino acid sequences of natural GLP1, as well as the photolabile Bpa16 and Bpa20 probes. Natural residues are illustrated in gray, whereas modified residues are illustrated in black. # indicates the positions of incorporation of the photolabile Bpa moiety. Middle, functional characterization of the Bpa16 and Bpa20 probes. Shown at the left are competition-binding curves of increasing concentrations of each of the indicated peptides to displace the binding of radioligand 125I-GLP1 to CHO-GLP1R cells. Values illustrated represent saturable binding as percentages of maximal binding observed in the absence of the competing peptide. They are expressed as the mean ± S.E. of duplicate values from a minimum of three independent experiments. Shown at the right are curves of intracellular cAMP responses to increasing concentrations of each of the indicated peptides in CHO-GLP1R cells. Data points represent the mean ± S.E. of three independent experiments performed in duplicate, normalized relative to the maximal response to GLP1. The absolute basal (4.0 ± 1.4 pmol/million cells) and maximal (190 ± 40 pmol/million cells) cAMP levels were similar for all three peptides. Bottom, photoaffinity labeling of the GLP1 receptor. Shown are typical autoradiographs of 10% SDS-PAGE gels used to separate the products of affinity labeling of CHO-GLP1R cell membranes by the Bpa16 (left) and Bpa20 (right) probes in the absence and presence of increasing concentrations of competing unlabeled GLP1. The receptor labeled with each probe migrated at Mr = 66,000 and shifted to Mr = 42,000 after deglycosylation with PNGase F. No bands were detected in affinity labeled non-receptor-bearing CHO cell membranes.
Receptor Resources
A CHO cell line stably expressing the human GLP1 receptor (CHO-GLP1R) established previously (29) was used as a source of wild type receptor for the current study. Cells were cultured in Ham's F-12 medium supplemented with 5% Fetal Clone II in a humidified atmosphere containing 5% CO2 at 37 °C and they were passaged approximately twice a week.
It was necessary to develop a new GLP1 receptor mutant to incorporate an additional site for Lys-C cleavage for the current work, in which Arg299 was replaced by a lysine (R299K). We also prepared alanine replacement mutants for the receptor residues labeled in this work (L141A and W297A). These receptor mutants were prepared in the pcDNA3 vector using the QuikChange Site-directed Mutagenesis kit from Stratagene (La Jolla, CA), with the products verified by direct DNA sequencing. These constructs were expressed transiently in COS-1 cells (American Type Culture Collection, Manassas, VA) grown in 5% Fetal Clone II in Dulbecco's modified Eagle's medium after transfection using a modification of the diethylaminoethyl-dextran method (23).
Cells were harvested mechanically after being grown to confluence, and plasma membranes were prepared from these cells using discontinuous sucrose gradient centrifugation (30). Membranes were then suspended in Krebs-Ringers/HEPES (KRH) medium (25 mm HEPES, pH 7.4, 104 mm NaCl, 5 mm KCl, 2 mm CaCl2, 1 mm KH2PO4, 1.2 mm MgSO4) containing 0.01% soybean trypsin inhibitor (STI) and 1 mm phenylmethylsulfonyl fluoride (PMSF), and stored at −80 °C until use.
Receptor Binding Assay
The ability of the Bpa16 and Bpa20 probes to bind to the GLP1 receptor was assessed by a radioligand competition-binding assay with intact receptor-expressing CHO-GLP1R cells using procedures described previously (24). In brief, CHO-GLP1R cells (∼200,000) were incubated for 1 h at room temperature with a constant amount of radioligand, 125I-GLP1 (5 pm, ∼20,000 cpm) in the presence of increasing concentrations (ranging from 0 to 1 μm) of GLP1 or the Bpa16 or Bpa20 probe in KRH buffer containing 0.01% STI and 0.2% bovine serum albumin. Cells were then washed twice with ice-cold KRH medium containing 0.01% STI and 0.2% bovine serum albumin to separate bound from free radioligand before being lysed with 0.5 m NaOH and quantified using a γ-spectrometer. Nonspecific binding was determined in the presence of 1 μm unlabeled GLP1 and represented less than 15% of total radioligand bound. The same assay was also utilized to characterize the binding activity of COS-1 cells transiently expressing the R299K, L141A, and W297A GLP1 receptor mutant constructs. Binding data were analyzed and plotted using the non-linear regression analysis program in the Prism software suite version 3.02 (GraphPad Software, San Diego, CA). Binding kinetics (Ki values) were analyzed with the LIGAND program of Munson and Rodbard (31). Data are reported as the mean ± S.E. of duplicate determinations from a minimum of three independent experiments.
Biological Activity Assay
The biological activity of each of the Bpa16 and Bpa20 probes was assessed to examine their abilities to stimulate cAMP responses in receptor-bearing CHO-GLP1R cells. In brief, cells (∼8,000 per well) were plated in 96-well plates and grown for 2 days before being washed with PBS and stimulated for 30 min at 37 °C with increasing concentrations of GLP1 or the Bpa16 or Bpa20 probe (ranging from 0 to 1 μm) in KRH medium containing 0.01% STI, 0.2% bovine serum albumin, 0.1% bacitracin, and 1 mm 3-isobutyl-1-methylxanthine. After removing the peptide solution, cells were lysed with 6% ice-cold perchloric acid. The cell lysates were adjusted to pH 6 with 30% KHCO3 before being introduced into an assay of cAMP levels using a LANCETM cAMP-384 kit from PerkinElmer Life Sciences. The assay was performed as per the manufacturer's instructions and repeated in at least three independent experiments. This assay was also used for characterizing the R299K, L141A, and W297A GLP1 receptor mutant transiently expressed in COS-1 cells. Data were analyzed and plotted using the non-linear regression program in Prism version 3.02. EC50 values were calculated using the same software.
Photoaffinity Labeling
Enriched CHO-GLP1R plasma membranes (∼50 μg) were incubated in the dark for 1 h at room temperature with 0.1 nm 125I-labeled Bpa16 or Bpa20 probes in KRH medium containing 0.01% STI and 1 mm PMSF in the presence of increasing amounts of competing GLP1. After incubation, the reactions were exposed to photolysis for 30 min at 4 °C using a Rayonet photochemical reactor (Southern New England Ultraviolet Co., Bradford, CT) equipped with 3500-Å wavelength lamps. Membranes were then washed with ice-cold KRH medium and solubilized in SDS sample buffer before being separated on 10% SDS-polyacrylamide gels. Bands of interest were visualized by autoradiography and band densitometric analysis was performed by NIH ImageJ software. The apparent molecular weights of the radioactive bands were determined by interpolation on a plot of the mobility of the appropriate ProSieve protein markers (Cambrex, Rockland, ME) versus the log values of their apparent masses.
Peptide Mapping
For this, photoaffinity labeling was performed in a large scale using ∼200 μg of enriched plasma membranes and 0.5 nm 125I-labeled Bpa16 or Bpa20 probe. Radiolabeled receptor was gel-purified, eluted, lyophilized, and ethanol precipitated as described previously (32). For selected experiments, receptor samples were deglycosylated by treatment with N-glycosidase F (PNGase F) following the manufacturer's protocol (Proenzyme, San Leandro, CA). Cleavage of the labeled GLP1 receptor with Lys-C, Asp-N, or Glu-C was performed following the protocols described in the manuals, with the products of cleavage analyzed on 10% Bis-Tris NuPAGE gels (Invitrogen) using a MES running buffer system under reducing conditions. The radiolabeled bands were detected by autoradiography, with their apparent molecular weights determined by interpolation on a plot of the mobility of the appropriate Seeblue plus2 pre-stained standards (Invitrogen) versus the log values of their apparent masses.
Radiochemical Sequencing
Manual Edman degradation radiochemical sequencing was performed to identify the specific receptor residues labeled with the Bpa16 and Bpa20 probes using procedures previously described (33). It should be noted that after photoaffinity labeling, but prior to protease cleavage, the labeled GLP1 receptor was acetylated by acetic anhydride treatment (25) to prevent the attached probe from being cleaved during sequencing. For the Bpa16 probe, the labeled Gln140–Glu247 receptor fragment resulting from Glu-C cleavage was covalently coupled through the Cys174 and Cys236 residues to m-maleimidobenzoyl-N-succinimide-activated N-(2-aminoethyl-1)-3-aminopropyl glass beads. For the Bpa20 probe, each of the labeled Asp293–Thr343 and Gly295–Glu364 fragments resulting from Asp-N and Glu-C cleavage, respectively, were used by coupling through the Cys329 and Cys341 residues to the glass beads. Immobilized fragments were subjected to manual Edman degradation sequencing as described previously (33). Radioactivity eluted in each cycle was quantified using a γ-spectrometer.
Molecular Modeling
All molecular modeling was conducted using a stochastic global energy optimization procedure in internal coordinate mechanics (34) using the ICM-Pro package version 3.6 (MolSoft LLC, San Diego, CA). This procedure consisted of three iterative steps: (a) random conformational change of a dihedral angle according to the biased probability Monte Carlo method (35); (b) local minimization of all free dihedral angles; and (c) acceptance or rejection of the new conformation based on the Metropolis criterion at the simulation temperature, usually at 600 K (36). The initial model of the amino-terminal domain of the GLP1 receptor was generated using the x-ray structure of the amino terminus of this receptor complexed with the GLP1 peptide (PDB code 3IOL (18)) as template. As the structure for this template terminates near the third disulfide bond at Cys126, we extended an α helical structure to the beginning of TM1. A pentasaccharide Man3GlcNAc2 was attached to GLP1 receptor residues Asn63, Asn82, and Asn115 to mimic their glycosylated state. The initial binding conformation of GLP1 peptide residues 16–36 was taken from the crystal structural template. For residues 1–15 of the peptide, the amino terminus of the NMR structure of receptor-bound PACAP(1–21)NH2 was used as template. The whole complex was globally optimized in the presence of the following photoaffinity labeling constraints between the peptide and the amino-terminal domain of the receptor (respectively): Phe12 to Tyr145, Val16 to Leu141, Ala24 to Glu133, and Gly35 to Glu125. The backbone dihedral around the last disulfide bond was relaxed to allow for better fit of the experimental constraints. Twenty-five of the lowest energy complexes were retained.
The peptide/amino-terminal receptor complexes were then docked onto 250 diverse helical bundle domain models from 25 different transmembrane bundles, each completed with 10 different loop conformations, in the presence of two additional photoaffinity labeling constraints involving the receptor core (peptide to receptor residues, respectively): Arg6 to Tyr205 and Leu20 to Trp297. All the resultant models were clustered, ranked by their internal coordinate mechanics energetics and their health as established by PROCHECK and WHAT_CHECK evaluations (37, 38). The best models were selected.
RESULTS
Functional Characterization of Photolabile Probes
Both Bpa16 and Bpa20 probes were synthesized by solid phase techniques and purified to homogeneity by reversed-phase HPLC, with their identities verified by mass spectrometry. They were characterized in radioligand binding assay for their abilities to bind to the GLP1 receptor. The middle left panel of Fig. 1 shows that both probes bound to the GLP1 receptor specifically and saturably (Ki values, nm: Bpa16 probe, 2.2 ± 0.8; Bpa20 probe, 0.5 ± 0.1), although the Bpa16 probe had affinity slightly lower than that of GLP1 (Ki value, 0.7 ± 0.1 nm). They were also characterized in biological activity studies. The middle right panel of Fig. 1 shows that both probes were fully efficacious agonists, stimulating intracellular cAMP responses in GLP1 receptor-bearing CHO-GLP1R cells in a concentration-dependent manner, with both potencies and efficacies similar to that of GLP1 (EC50 values, pm: GLP1, 19 ± 1; Bpa16 probe, 36 ± 8; Bpa20 probe, 37 ± 9).
Photoaffinity Labeling of the GLP1 Receptor
Both Bpa16 and Bpa20 probes were used in photoaffinity labeling experiments with CHO-GLP1R cell membranes in the absence and presence of competing natural GLP1 to explore their ability to covalently label the GLP1 receptor. As shown in the bottom panel of Fig. 1, both probes labeled this receptor specifically and saturably, with labeling by each probe inhibited by secretin in a concentration-dependent manner (IC50 values: Bpa16 probe, 45 ± 8 nm; Bpa20 probe, 580 ± 92 nm). The labeled receptor migrated at approximate Mr = 66,000 and shifted to approximate Mr = 42,000 after deglycosylation with PNGase F. No bands were detected in affinity-labeled non-receptor-bearing CHO cell membranes.
Identification of the Site of Labeling with the Bpa16 Probe
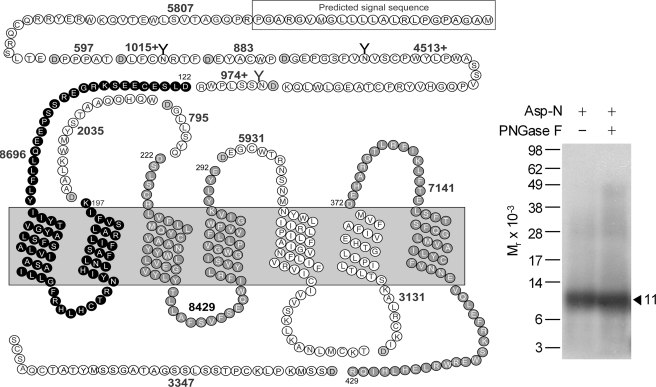
Asp-N digestion was used as the first indication of the region of labeling with the Bpa16 probe. This protease cleaves a protein at the amino-terminal side of aspartic acid residues. As shown in Fig. 2, Asp-N cleavage of the labeled GLP1 receptor yielded a band migrating at approximate Mr = 11,000 that did not further shift after degylcosylation with PNGase F treatment. It should be noted that the attached probe was also cleaved by this protease, cleaving off eight residues at the amino terminus of the probe. Given the molecular mass of the truncated probe (2,781 Da) and non-glycosylated nature of the labeled fragment, the labeled receptor fragment could be limited to three candidate fragments that are highlighted in black and gray circles in Fig. 2. These included the receptor Asp122–Lys197 fragment spanning the amino-terminal domain to TM2, the Asp222–Glu292 fragment spanning ECL1 to ECL2, and the Asp372–Arg429 fragment spanning ECL3 to the carboxyl terminus.
FIGURE 2.
Endoproteinase Asp-N cleavage of the GLP1 receptor labeled with the Bpa16 probe. Shown at the left is a diagram of the predicted sites of Asp-N cleavage of the GLP1 receptor along with the masses. Shown at the right is a representative autoradiograph of a 10% NuPAGE gel used to separate the products of Asp-N cleavage of the GLP1 receptor labeled with the Bpa16 probe. Cleavage of the labeled receptor resulted in a band migrating at approximate Mr = 11,000 that was not affected by PNGase F treatment. Three best candidates representing the domain of labeling by the Bpa16 probe were highlighted in bold and gray cycles. Data are representative of three independent experiments.
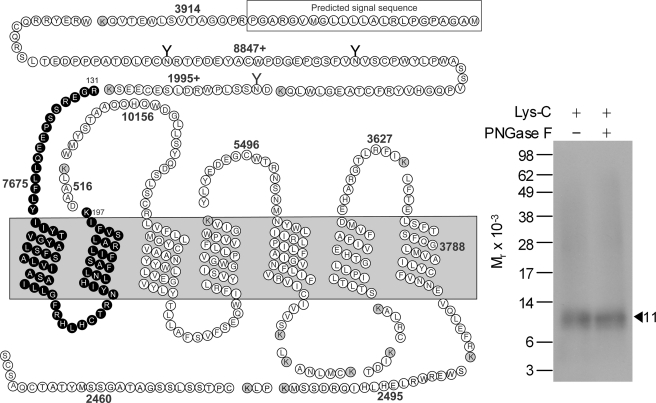
Lys-C was used to identify which of these three candidate fragments represented the region of labeling with the Bpa16 probe. This protease cleaves a protein at the carboxyl-terminal side of lysine residues. As shown in Fig. 3, Lys-C cleavage of the labeled GLP1 receptor yielded a band migrating at approximate Mr = 11,000 that did not further shift after deglycosylation. Given the molecular mass of the probe (3,630 Da) and non-glycosylated nature of the labeled fragment, the receptor fragment labeled could be limited to only one candidate. This was the receptor Arg131–Lys197 fragment spanning the amino-terminal domain to TM2 (highlighted in black circles in Fig. 3).
FIGURE 3.
Endoproteinase Lys-C cleavage of the GLP1 receptor labeled with the Bpa16 probe. Shown at the left is a diagram of the predicted sites of Lys-C cleavage of the GLP1 receptor along with the masses. Shown at the right is a representative autoradiograph of a 10% NuPAGE gel used to separate the products of Lys-C cleavage of the GLP1 receptor labeled with the Bpa16 probe. Cleavage of the labeled receptor yielded a band migrating at approximate Mr = 11,000 that was not affected by PNGase F treatment. The best candidate representing the domain of labeling by the Bpa16 probe was highlighted in bold cycles. Data are representative of three independent experiments.
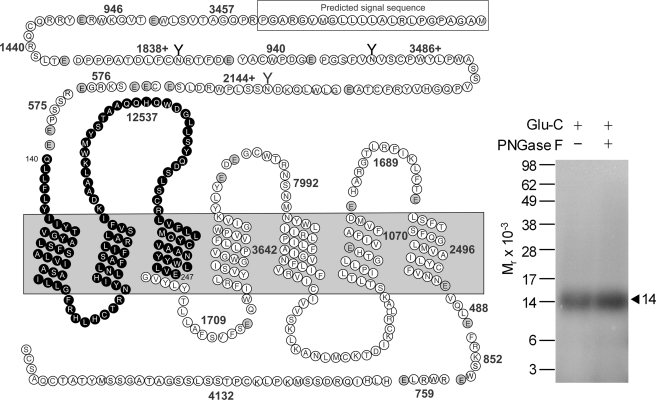
Glu-C was used to further define the region of labeling by the Bpa16 probe. This protease cleaves a protein at the carboxyl-terminal side of glutamic acid residues. As shown in Fig. 4, Glu-C cleavage of the labeled GLP1 receptor yielded a band migrating at approximate Mr = 14,000 that did not further shift after deglycosylation, representing the Gln140–Glu247 fragment spanning the amino-terminal domain to TM2 (highlighted in black circles in Fig. 4) attached with the truncated Bpa16 probe (Mr 1,563). Considering the above Lys-C cleavage data, the region of labeling with the Bpa16 probe was further focused to the receptor Gln140–Lys197 fragment, likely within several residues of the amino-terminal region of this fragment.
FIGURE 4.
Endoproteinase Glu-C cleavage of the GLP1 receptor labeled with the Bpa16 probe. Shown at the left is a diagram of the predicted sites of Glu-C cleavage of the GLP1 receptor along with the masses. Shown at the right is a representative autoradiograph of a 10% NuPAGE gel used to separate the products of Glu-C cleavage of the GLP1 receptor labeled with the Bpa16 probe. Cleavage of the labeled receptor yielded a band migrating at approximate Mr = 14,000 that was not affected by PNGase F treatment. The best candidate representing the domain of labeling by the Bpa16 probe was highlighted in bold cycles. Data are representative of three independent experiments.
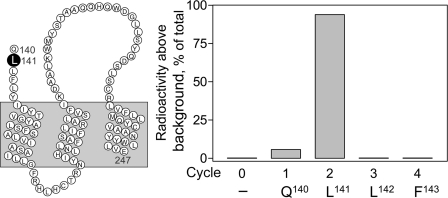
To identify the specific receptor residue labeled by the Bpa16 probe, the labeled Gln140–Glu247 receptor fragment resulting from Glu-C cleavage was prepared in large scale and purified to radioactive homogeneity. Radiochemical sequencing of this fragment identified a peak in eluted radioactivity consistently in cycle 2, corresponding to the covalent labeling with the Bpa16 probe to receptor residue Leu141 (Fig. 5).
FIGURE 5.
Identification of the receptor residue labeled with the Bpa16 probe by radiochemical sequencing. Shown at the left is a diagram illustrating the sequence of the Gln140–Glu247 fragment resulting from Glu-C cleavage of the wild type receptor labeled with the Bpa16 probe. Shown at the right is a representative radioactivity elution profile of Edman degradation sequencing of this fragment. A radioactive peak consistently eluted in cycle 2, representing covalent labeling of the receptor residue Leu141 with the Bpa16 probe.
Identification of the Site of Labeling with the Bpa20 Probe
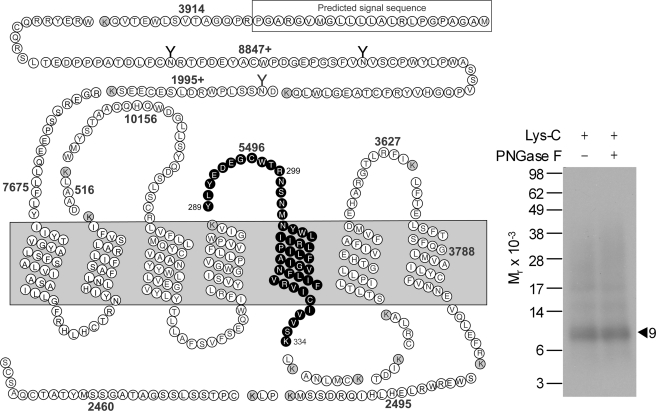
Lys-C was used for the first indication of the region of labeling of the GLP1 receptor with the Bpa20 probe. Fig. 6 shows that Lys-C cleavage of the labeled GLP1 receptor yielded a band migrating at approximate Mr = 9,000 that did not further shift after deglycosylation. Given the molecular mass of the probe (3,616 Da) and non-glycosylated nature of the labeled fragment, the labeled receptor fragment could be localized to a single candidate. This was the receptor Tyr289–Lys334 fragment spanning ECL2 to the third intracellular loop (highlighted in bold in Fig. 6).
FIGURE 6.
Endoproteinase Lys-C cleavage of the GLP1 receptor labeled with the Bpa20 probe. Shown at the left is a diagram of the predicted sites of Lys-C cleavage of the GLP1 receptor along with the masses. Shown at the right is a representative autoradiograph of a 10% NuPAGE gel used to separate the products of Lys-C cleavage of the GLP1 receptor labeled with the Bpa20 probe. Cleavage of the labeled receptor yielded a band migrating at approximate Mr = 9,000 that was not affected by PNGase F treatment. The best candidate representing the domain of labeling by the Bpa20 probe was highlighted in bold cycles. Data are representative of three independent experiments.
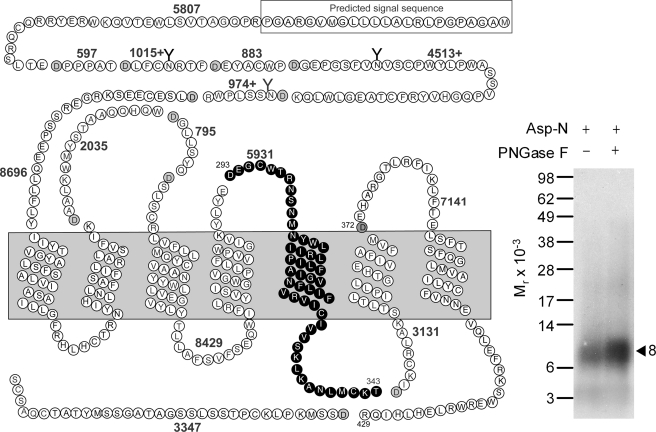
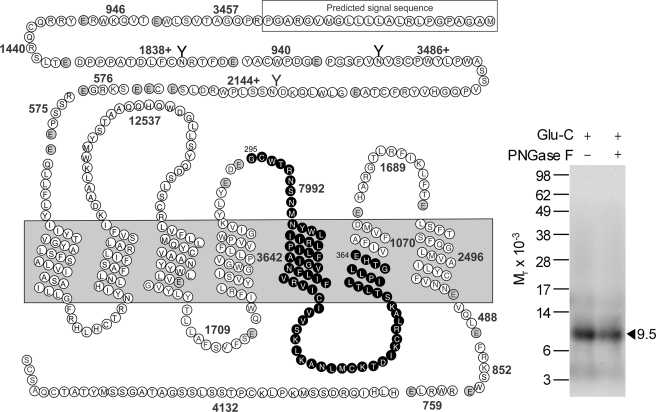
Asp-N and Glu-C were used to confirm the region of labeling of the GLP1 receptor with the Bpa20 probe. Asp-N cleavage of the labeled GLP1 receptor yielded a non-glycosylated band migrating at approximate Mr = 8,000 (Fig. 7), representing the Asp293–Thr343 fragment (highlighted in black circles in Fig. 7) attached to the truncated Bpa20 probe (Mr 2,767), whereas Glu-C cleavage resulted in a non-glycosylated band migrating at approximate Mr = 9,500 (Fig. 8), representing the Gly295–Glu364 fragment (highlighted in black circles in Fig. 8) attached to the truncated Bpa20 probe (Mr 1,549). Considering the above Lys-C data, the region of labeling by the Bpa20 probe was narrowed down to the segment between Gly295 and Lys334 of the receptor.
FIGURE 7.
Endoproteinase Asp-N cleavage of the GLP1 receptor labeled with the Bpa20 probe. Shown at the left is a diagram of the predicted sites of Asp-N cleavage of the GLP1 receptor along with the masses. Shown at the right is a representative autoradiograph of a 10% NuPAGE gel used to separate the products of Asp-N cleavage of the GLP1 receptor labeled with the Bpa20 probe. Cleavage of the labeled receptor yielded a band migrating at approximate Mr = 8,000 that was not affected by PNGase F treatment. The best candidate representing the domain of labeling by the Bpa20 probe was highlighted in bold cycles. Data are representative of three independent experiments.
FIGURE 8.
Endoproteinase Glu-C cleavage of the GLP1 receptor labeled with the Bpa20 probe. Shown at the left is a diagram of the predicted sites of Glu-C cleavage of the GLP1 receptor along with the masses. Shown at the right is a representative autoradiograph of a 10% NuPAGE gel used to separate the products of Glu-C cleavage of the GLP1 receptor labeled with the Bpa20 probe. Cleavage of the labeled receptor yielded a band migrating at approximate Mr = 9,500 that was not affected by PNGase F treatment. The best candidate representing the domain of labeling by the Bpa20 probe was highlighted in bold cycles. Data are representative of three independent experiments.
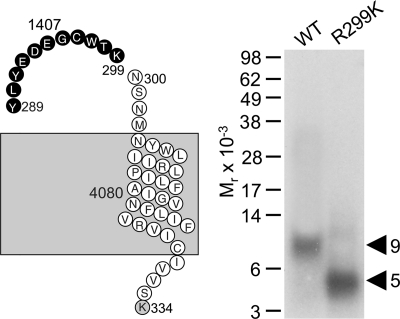
Definitive identification of the region of labeling by the Bpa20 probe was achieved by Lys-C cleavage of a newly prepared GLP1 receptor mutant, R299K transiently expressed in COS-1 cells. This mutant bound GLP1 (Ki = 2.2 ± 0.7 nm) and signaled normally (EC50 = 32 ± 5 pm), being labeled with the Bpa20 probe specifically and saturably (data not shown). As shown in Fig. 9, Lys-C cleavage of the R299K mutant yielded a band migrating at approximate Mr = 4,500, compared with the Mr = 9,000 band from cleavage of the wild type receptor. This established that the site of labeling by the Bpa20 probe was within the small segment between Tyr289 and Lys299 within ECL2 of the GLP1 receptor, a unique region that has not been labeled by any of the previously used photolabile probes.
FIGURE 9.
Endoproteinase Lys-C cleavage of the R299K mutant GLP1 receptor labeled with the Bpa20 probe. Shown at the left is a diagram illustrating the candidate fragments resulting from Lys-C cleavage of the R299K mutant GLP1 receptor (refer to Fig. 7 for the diagram illustrating all the Lys-C cleavage fragments of the wild type receptor). Shown at the right is a representative autoradiograph of a 10% NuPAGE gel used to separate the products of Lys-C cleavage of the wild type and the R299K mutant GLP1 receptor labeled with the Bpa20 probe. Lys-C cleavage of the labeled R299K receptor mutant yielded a much smaller fragment migrating at approximate Mr = 5,000, distinct from the Mr = 9,000 fragment resulting from Lys-C cleavage of the labeled wild type receptor, indicating the site of labeling with the Bpa20 probe being within the segment Tyr289–Lys299.
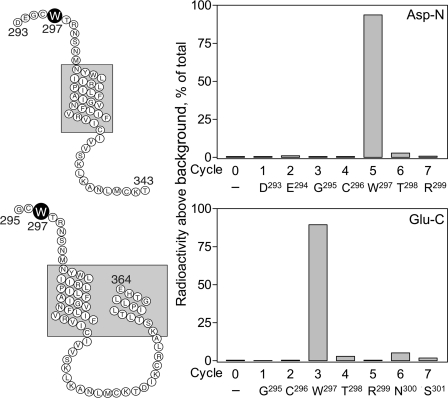
The specific receptor residue labeled with the Bpa20 probe was identified by radiochemical sequencing of the radiochemically pure Asp293–Thr343 (Fig. 7) and Gly295–Glu364 (Fig. 8) fragments resulting from Asp-N and Glu-C cleavage of the labeled GLP1 receptor, respectively. As shown in Fig. 10, a radioactive peak was eluted in cycles 5 and 3 when sequencing the labeled Asp293–Thr343 and Gly295–Glu364 fragments, respectively. This unambiguously identified the receptor residue Trp297 within ECL2 as the site of labeling by the Bpa20 probe.
FIGURE 10.
Identification of the receptor residue labeled with the Bpa20 probe by radiochemical sequencing. Shown at the left are diagrams illustrating the sequences of the Asp293–Thr343 (upper panel) and Gly295–Glu364 (lower panel) fragments resulting from Asp-N and Glu-C cleavages, respectively, of the wild type receptor labeled with the Bpa20 probe. Shown at the right are representative radioactivity elution profiles of Edman degradation sequencing of both fragments. A radioactive peak consistently eluted in cycle 5 when sequencing the Asp293–Thr343 fragment (upper panel) and in cycle 3 when sequencing the Gly295–Glu364 fragment (lower panel), respectively. These data are consistent with representing covalent labeling of the receptor residue Trp297 with the Bpa20 probe.
Functional Characterization of Receptor Site Mutants
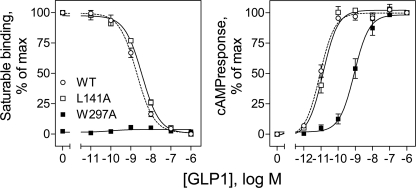
The function of GLP1 receptors incorporating an alanine replacement for each site of photoaffinity labeling was studied in COS-1 cells for impact on the binding and biological activity of GLP1. As shown in Fig. 11, mutation of the receptor Leu141 residue labeled by the Bpa16 probe to alanine had no significant effects on the binding (Ki values, nm: WT, 2.0 ± 0.3; L141A, 3.6 ± 0.1) or biological activity (EC50 values, pm: WT, 8.8 ± 1.4; L141A, 12.7 ± 2.4) of GLP1. However, alanine replacement of receptor residue Trp297 labeled by the Bpa20 probe resulted in substantial reduction in GLP1-induced biological activity (EC50 values, pm: WT, 8.8 ± 1.4; W297A, 1,030 ± 380) (Fig. 11). The binding affinity of this W297A mutant was too low to directly demonstrate saturable binding (Fig. 11).
FIGURE 11.
Functional characterization of the L141A and W297A GLP1 receptor mutants. Shown at the left are competition-binding curves of increasing concentrations of GLP1 to displace the binding of radioligand 125I-GLP1 to COS-1 cells expressing wild type (WT), L141A, and W297A GLP1 receptor constructs. Values illustrated represent saturable binding as percentages of maximal saturable binding observed in the absence of the competing peptide and are expressed as the mean ± S.E. of duplicate values from a minimum of three independent experiments. Shown at the right are intracellular cAMP responses to increasing concentrations of GLP1 in these cells. Data points represent the mean ± S.E. of three independent experiments performed in duplicate, normalized relative to the maximal response to GLP1.
Molecular Model of the Intact GLP1 Receptor
The x-ray crystal structure of the amino terminus of the GLP1 receptor amino terminus complexed with the GLP1 peptide ligand (18) provides a valuable starting point for modeling. However, because this structure terminates at Glu128, the only experimental constraint from photoaffinity labeling that could be accommodated within this portion of the model is between peptide residue Gly35 and receptor residue Glu125. This part of the model was, therefore, connected to a homology model of the helical bundle region, using an α-helical conformation between the third conserved disulfide bond and the beginning of TM1. The four experimental constraints within the amino-terminal receptor domain-GLP1 peptide complex were easily satisfied in all 25 conformations.
The recent GPCR structure prediction assessment (39) shows that, even within family A, prediction of large deformation and movement in the extracellular side of transmembrane helices continue to present a challenging task. We have, therefore, constructed a diverse set of 250 transmembrane domain conformations using the previously reported method (40). Each of the 25 conformations of amino-terminal receptor domain-GLP1 peptide complexes was docked to 250 transmembrane domain models in the presence of all experimental constraints, followed by all-atom refinement generated the final models. Three of the best models were selected as being representative. Table 1 shows the distances between cross-linked residues in these three models, each of which satisfies all experimental constraints.
TABLE 1.
Interatomic distances between cross-linked residues in 3 best models
| GLP1 peptide residuea | GLP1 receptor residue, proximal atom | Distance in model 1 | Distance in model 2 | Distance in model 3 |
|---|---|---|---|---|
| Arg6 | Tyr205, Oη | 8.1 | 11.0 | 11.9 |
| Phe12 | Tyr145, Oη | 9.9 | 8.5 | 9.2 |
| Val16 | Leu141, Cδ1 | 7.4 | 5.8 | 7.0 |
| Leu20 | Trp297, Cγ | 8.7 | 8.3 | 8.8 |
| Ala24 | Glu133, Oϵ1 | 10.2 | 11.6 | 9.8 |
| Gly35 | Glu125, Cϵ1 | 10.0 | 10.1 | 10.2 |
a Measured from the Cβ of the corresponding peptide residue, except for Gly35 measured from Cα, to the proximal atom of noted receptor residue.
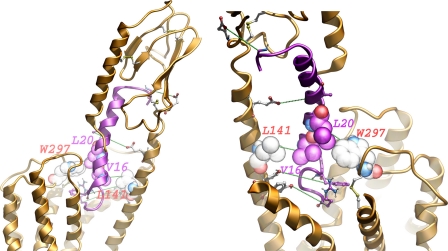
Fig. 12 shows the juxtaposition of the amino-terminal and transmembrane domains in the best model, as seen from two distinct angles; the two new experimental constraints presented in this work, Val16 in GLP1 to Leu141 at the top or above TM1 and Leu20 in GLP1 to Trp297 in ECL2 firmly place the peptide in the cavity between TM1, TM2, and TM7. The spatial approximation between Ala24 in GLP1 to receptor residue Glu133 resulted in extensive contacts between the peptide and the α helical region in the extended structure above TM1. The constraints between peptide residue Arg6 and receptor residue Tyr205 in TM2 and between peptide residue Phe12 and receptor residue Tyr145 anchor the amino terminus of the peptide down into the top fourth of the transmembrane bundle. Due to the extensive set of contacts between the peptide and different core regions of the receptor, all of the three best models were quite similar to one another in terms of position and orientation of the peptide and amino-terminal domain relative to the transmembrane domain.
FIGURE 12.
Molecular model of ligand-bound GLP1 receptor. Shown is the best model that satisfies all experimental constraints. The GLP1 receptor is colored gold, and the GLP1 peptide is colored magenta with the amino terminus pointing downwards to the helical bundle. The photoaffinity labeling pairs are displayed in green dotted lines (see Table 1 for distances). The new cross-linking pairs: Val16 and Leu20 of the GLP1 peptide, and Trp297 and Leu141 of the GLP1 receptor are shown in Corey-Pauling-Koltun and labeled. The previously identified cross-linked pairs of residues are shown in ball-and-stick. Left, viewed sideway from the face of TM6 and TM7. Right, viewed from an elevated angle from the side of TM1 and TM2; ECL1 is removed for the purpose of clarity.
DISCUSSION
Understanding the mechanisms of ligand binding and activation of family B GPCRs may facilitate the rational design of receptor-active drugs. We have focused on an important target for therapy of type 2 diabetes, the GLP1 receptor. In the absence of a high resolution structure of this intact receptor, we have been using photoaffinity labeling to understand how the natural peptide ligand interacts with it. Although we previously reported four pairs of such interactions using probes that establish covalent bonds through photolabile residues within the hormone amino-terminal and carboxyl-terminal regions, those studies did not provide adequate constraints to refine our understanding of the orientation of receptor amino-terminal and core domains or to provide insights into the ligand docking at the intact receptor. In this work, we have provided two additional pairs of interactions using peptide mid-region photolabile probes, including an interaction with a novel region of the GLP1 receptor.
It is noteworthy that the current work provides direct evidence for spatial approximation between position 16 of GLP1 and receptor residue Leu141, a residue within the amino-terminal domain just above TM1. We recently demonstrated that this is also the region covalently labeled by GLP1 probes with photolabile residues in positions 12, 24, and 35 (24, 25). The receptor residues labeled by all of these probes are adjacent to the functionally important Thr149 residue where a naturally occurring mutation was found in a type 2 diabetes patient (41).
This juxtamembranous region has also been demonstrated to be important for other family B GPCRs. This is the region of the calcitonin receptor labeled by mid-region positions 16 and 19 probes (10, 42), that of the secretin receptor labeled by the mid-region position 13 probe (43), that of the VPAC1 receptor labeled by the amino-terminal (positions 0 and 6) and carboxyl-terminal (positions 22, 24, and 28) probes (11, 44, 45), that of the PTH1 receptor labeled by the carboxyl-terminal (position 33) (46) and multiple mid-region (positions 11, 13, 15, 18, and 21) probes (47–49), and that of the growth hormone releasing hormone receptor labeled by the amino-terminal position 12 probe (50). Mutagenesis studies have also focused interest on this region (47, 51–53). Of note, the same region has also recently been shown to play a critical role in small molecule agonist action at the calcitonin receptor (54).
It is particularly important that the current report also provides direct evidence for spatial approximation between mid-region residue 20 of GLP1 and residue Trp297 within ECL2 of the GLP1 receptor. This receptor residue is adjacent to the functionally important conserved Cys296 that forms a disulfide bond with Cys226 within ECL1 (55). The importance of ECL2 in ligand binding has also been suggested in mutagenesis and chimeric receptor studies for several family B GPCRs, including receptors for GLP1 (56), CRF1 (57), CRF2 (58), secretin (23), PTH1 (59), PTH2 (60), and glucagon (61). Photoaffinity labeling has established ECL2 as the region of labeling of the CRF1 receptor for positions 0, 12, and 16 urocortin probes (62, 63).
The identification of receptor residue Trp297 within ECL2 as the site of labeling for mid-region GLP1 probe provides new insights into the orientation of the ligand-bound amino-terminal domains of family B GPCRs relative to the core helical bundle domains and adds to our current understanding of activation of this family of receptors. In general, this identification is consistent with the “two domain” mechanism for activation of family B GPCRs previously proposed (64–66). Although this is believed to be a common mechanism in which the peptide carboxyl-terminal region docks to the receptor amino-terminal domain, whereas the peptide amino-terminal region interacts with the receptor core helical bundle domain, the molecular details of ligand binding vary from one member to another. For the secretin (65, 67) and calcitonin (66) receptors, only the amino-terminal region of the peptide has been shown to be in close proximity with the TM6/ECL3 of the receptor. For the PTH receptor, the amino-terminal region has been shown to be spatially close to the TM6/ECL3 of the receptor (64), whereas mid-region position 19 (68) and a carboxyl-terminal position 27 (69) have been shown to be in close proximity to TM2 and ECL1, respectively. For the CRF1 receptor, amino-terminal positions 0 and 12 and mid-region position 16 have been shown to interact with residues in ECL2 (62, 63), whereas mid-region positions 17 and 22 have been shown to interact with ECL1 (63). Activation of the VAPC1 receptor may occur via a distinct mechanism because all the photolabile vasoactive intestinal polypeptide probes that have been tested so far, including amino-terminal positions 0 and 6, and carboxyl-terminal positions 22, 24, and 28, label the receptor juxtamembranous region of the amino-terminal domain (11, 44, 45). For the GLP1 receptor, the amino-terminal position 6 probe labels a receptor residue within ECL1 (25), whereas the mid-region position 20 probe labels a receptor residue within ECL2 (current work), a pattern distinct from the CRF1 receptor labeling data (62, 63). All these observations may suggest that the mechanisms of natural ligand binding and activation of family B GPCRs are more complicated than previously proposed and may vary from one receptor to another.
The recent crystal structures of the amino-terminal domain of the GLP1 receptor with bound GLP1 or truncated exendin-4 are unable to confirm the experimental observations in this work, because receptor residue Leu141 was within an unresolved flexible region of the structures and residue Trp297 was not even included in the structures. It should be noted that a proposed GLP1 receptor model based on limited, indirect mutagenesis data that has been built to dock both peptide and small molecule ligands (70) does not accommodate the photoaffinity labeling constraints identified in the current work. In that model, positions 16 and 20 of GLP1 were quite distant from their labeling sites, Leu141 and Trp297, 14.50 and 15.52 Å, respectively.
In this work, we have generated a model of the ligand-bound intact GLP1 receptor using our six pairs of experimentally derived constraints. The photoaffinity labeling probes span from the amino terminus to the carboxyl terminus of the peptide, with spatial approximation constraints directed to the receptor amino terminus, the helical extension above TM1, the top of TM2, and ECL2. In contrast to our previous models of the secretin receptor, in which the majority of cross-linking is in the flexible distal amino terminus of the receptor, the best GLP1 receptor models are quite consistent with one another in terms of juxtaposition of the peptide with the receptor amino terminus and transmembrane domains. Nevertheless, whereas these models provide utility in understanding the potential orientation of the GLP1 receptor amino-terminal domain to its transmembrane core, the models still lack the resolution that is likely required to make meaningful predictions on mechanistic interactions.
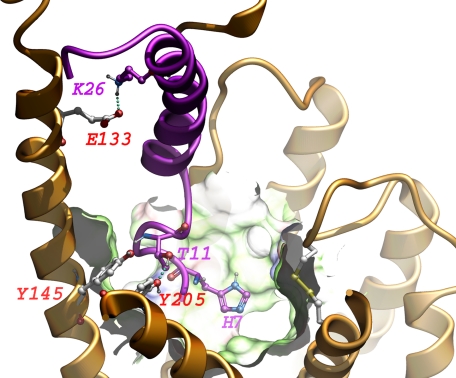
Some features were shared by the three best models (relevant distances shown in Table 1) and are illustrated in Fig. 13. His7 of the docked GLP1 peptide is deeply buried in the core of the receptor transmembrane domain in all of the models. Thr11 of the docked GLP1 peptide is in close proximity to Tyr145 above TM1 and Tyr205 of TM2, potentially forming a hydrogen bond network. Lys26 of the docked GLP1 peptide is in close proximity to Glu133 in the extended α-helical structure above TM1, potentially forming a salt bridge. Of note, receptor residues Tyr145 (25), Tyr205 (71), Glu133 (24), and Leu141 (this work) have been mutated to alanines with no significant effect on binding and GLP1-stimulated signaling. This is probably not surprising, because these residues are all solvent-exposed, and interactions with the docked peptide would likely be transient and not represent strong stable bonds. Leu20 is in direct contact with Typ297 in all of these models. In testing the replacement of receptor residue Trp297 with alanine (W297A), we observed a 120-fold reduction in potency of GLP1 to stimulate cAMP (Fig. 11), and no saturable binding (Fig. 11). This functional effect is certainly compatible with the proposed molecular models, in which a photolabile residue in position 20 of the GLP1 analog labeled this receptor residue.
FIGURE 13.
Focused view of ligand-bound GLP1 receptor. Shown are some of the consistent features found in all of the best models. The GLP1 receptor is colored gold, and the GLP1 peptide is colored magenta with the amino terminus pointing downwards to the helical bundle. Featured residues are displayed in ball-and-stick. Part of the receptor binding surface is shown: green represents hydrophobic surface, blue represents positively charged surface, and red represents negatively charged surface. ECL1 is removed for the purpose of clarity.
In summary, we have identified two additional pairs of residue-residue approximation constraints between mid-region residues of the natural agonist ligand GLP1 and its receptor. Together with four pairs of such constraints from previous studies, these new constraints were incorporated into a molecular model of the GLP1-bound GLP1 receptor. It is encouraging that in the best working model, all existing experimental data were fully accommodated, with four constraints directed toward the juxtamembranous region of the amino-terminal domain and two directed toward the core of the receptor. As we expand the number of such experimental constraints, our insights into the molecular basis of ligand binding and activation of this important receptor will become clearer.
Acknowledgments
We thank Mary L. Augustine and Alicja M. Skalecka Ball for excellent technical assistance.
This work was supported, in whole or in part, by National Institutes of Health Grant DK46577, American Diabetes Association Grant 1-08-RA-42, and Australian National Health and Medical Research Council (NHMRC) Grant APP1002180.
- GPCR
- G protein-coupled receptor
- Asp-N
- endoproteinase Asp-N
- Bpa
- p-benzoyl-l-phenylalanine
- CHO-GLP1R
- human GLP1 receptor-bearing CHO cells
- CRF
- corticotrophin-releasing factor
- Glu-C
- endoproteinase Glu-C
- GLP1
- glucagon-like peptide-1
- Lys-C
- endoproteinase Lys-C
- PNGase F
- N-glycosidase F
- PTH
- parathyroid hormone
- STI
- soybean trypsin inhibitor
- TM
- transmembrane
- Bis-Tris
- 2-[bis(2-hydroxyethyl)amino]-2-(hydroxymethyl)propane-1,3-diol.
REFERENCES
- 1. Mayo K. E., Miller L. J., Bataille D., Dalle S., Göke B., Thorens B., Drucker D. J. (2003) Pharmacol. Rev. 55, 167–194 [DOI] [PubMed] [Google Scholar]
- 2. Estall J. L., Drucker D. J. (2006) Curr. Pharm. Des. 12, 1731–1750 [DOI] [PubMed] [Google Scholar]
- 3. Cao Y. J., Gimpl G., Fahrenholz F. (1995) Biochem. Biophys. Res. Commun. 212, 673–680 [DOI] [PubMed] [Google Scholar]
- 4. Gourlet P., Vilardaga J. P., De Neef P., Waelbroeck M., Vandermeers A., Robberecht P. (1996) Peptides 17, 825–829 [DOI] [PubMed] [Google Scholar]
- 5. Graziano M. P., Hey P. J., Strader C. D. (1996) Receptors Channels 4, 9–17 [PubMed] [Google Scholar]
- 6. Holtmann M. H., Hadac E. M., Miller L. J. (1995) J. Biol. Chem. 270, 14394–14398 [DOI] [PubMed] [Google Scholar]
- 7. Jüppner H., Schipani E., Bringhurst F. R., McClure I., Keutmann H. T., Potts J. T., Jr., Kronenberg H. M., Abou-Samra A. B., Segre G. V., Gardella T. J. (1994) Endocrinology 134, 879–884 [DOI] [PubMed] [Google Scholar]
- 8. Stroop S. D., Nakamuta H., Kuestner R. E., Moore E. E., Epand R. M. (1996) Endocrinology 137, 4752–4756 [DOI] [PubMed] [Google Scholar]
- 9. Dong M., Lam P. C., Gao F., Hosohata K., Pinon D. I., Sexton P. M., Abagyan R., Miller L. J. (2007) Mol. Pharmacol. 72, 280–290 [DOI] [PubMed] [Google Scholar]
- 10. Dong M., Pinon D. I., Cox R. F., Miller L. J. (2004) J. Biol. Chem. 279, 1167–1175 [DOI] [PubMed] [Google Scholar]
- 11. Tan Y. V., Couvineau A., Murail S., Ceraudo E., Neumann J. M., Lacapère J. J., Laburthe M. (2006) J. Biol. Chem. 281, 12792–12798 [DOI] [PubMed] [Google Scholar]
- 12. Chorev M. (2002) Receptors Channels 8, 219–242 [PubMed] [Google Scholar]
- 13. Grace C. R., Perrin M. H., DiGruccio M. R., Miller C. L., Rivier J. E., Vale W. W., Riek R. (2004) Proc. Natl. Acad. Sci. U.S.A. 101, 12836–12841 [DOI] [PMC free article] [PubMed] [Google Scholar]
- 14. Grace C. R., Perrin M. H., Gulyas J., Digruccio M. R., Cantle J. P., Rivier J. E., Vale W. W., Riek R. (2007) Proc. Natl. Acad. Sci. U.S.A. 104, 4858–4863 [DOI] [PMC free article] [PubMed] [Google Scholar]
- 15. Pioszak A. A., Parker N. R., Suino-Powell K., Xu H. E. (2008) J. Biol. Chem. 283, 32900–32912 [DOI] [PMC free article] [PubMed] [Google Scholar]
- 16. Parthier C., Kleinschmidt M., Neumann P., Rudolph R., Manhart S., Schlenzig D., Fanghänel J., Rahfeld J. U., Demuth H. U., Stubbs M. T. (2007) Proc. Natl. Acad. Sci. U.S.A. 104, 13942–13947 [DOI] [PMC free article] [PubMed] [Google Scholar]
- 17. Runge S., Thøgersen H., Madsen K., Lau J., Rudolph R. (2008) J. Biol. Chem. 283, 11340–11347 [DOI] [PubMed] [Google Scholar]
- 18. Underwood C. R., Garibay P., Knudsen L. B., Hastrup S., Peters G. H., Rudolph R., Reedtz-Runge S. (2010) J. Biol. Chem. 285, 723–730 [DOI] [PMC free article] [PubMed] [Google Scholar]
- 19. Sun C., Song D., Davis-Taber R. A., Barrett L. W., Scott V. E., Richardson P. L., Pereda-Lopez A., Uchic M. E., Solomon L. R., Lake M. R., Walter K. A., Hajduk P. J., Olejniczak E. T. (2007) Proc. Natl. Acad. Sci. U.S.A. 104, 7875–7880 [DOI] [PMC free article] [PubMed] [Google Scholar]
- 20. Pioszak A. A., Xu H. E. (2008) Proc. Natl. Acad. Sci. U.S.A. 105, 5034–5039 [DOI] [PMC free article] [PubMed] [Google Scholar]
- 21. ter Haar E., Koth C. M., Abdul-Manan N., Swenson L., Coll J. T., Lippke J. A., Lepre C. A., Garcia-Guzman M., Moore J. M. (2010) Structure 18, 1083–1093 [DOI] [PubMed] [Google Scholar]
- 22. Koth C. M., Abdul-Manan N., Lepre C. A., Connolly P. J., Yoo S., Mohanty A. K., Lippke J. A., Zwahlen J., Coll J. T., Doran J. D., Garcia-Guzman M., Moore J. M. (2010) Biochemistry 49, 1862–1872 [DOI] [PubMed] [Google Scholar]
- 23. Holtmann M. H., Ganguli S., Hadac E. M., Dolu V., Miller L. J. (1996) J. Biol. Chem. 271, 14944–14949 [DOI] [PubMed] [Google Scholar]
- 24. Chen Q., Pinon D. I., Miller L. J., Dong M. (2009) J. Biol. Chem. 284, 34135–34144 [DOI] [PMC free article] [PubMed] [Google Scholar]
- 25. Chen Q., Pinon D. I., Miller L. J., Dong M. (2010) J. Biol. Chem. 285, 24508–24518 [DOI] [PMC free article] [PubMed] [Google Scholar]
- 26. Adelhorst K., Hedegaard B. B., Knudsen L. B., Kirk O. (1994) J. Biol. Chem. 269, 6275–6278 [PubMed] [Google Scholar]
- 27. Powers S. P., Pinon D. I., Miller L. J. (1988) Int. J. Pept. Protein Res. 31, 429–434 [DOI] [PubMed] [Google Scholar]
- 28. Ulrich C. D., 2nd, Pinon D. I., Hadac E. M., Holicky E. L., Chang-Miller A., Gates L. K., Miller L. J. (1993) Gastroenterology 105, 1534–1543 [DOI] [PubMed] [Google Scholar]
- 29. Dong M., Gao F., Pinon D. I., Miller L. J. (2008) Mol. Endocrinol. 22, 1489–1499 [DOI] [PMC free article] [PubMed] [Google Scholar]
- 30. Hadac E. M., Ghanekar D. V., Holicky E. L., Pinon D. I., Dougherty R. W., Miller L. J. (1996) Pancreas 13, 130–139 [DOI] [PubMed] [Google Scholar]
- 31. Munson P. J., Rodbard D. (1980) Anal. Biochem. 107, 220–239 [DOI] [PubMed] [Google Scholar]
- 32. Dong M., Wang Y., Pinon D. I., Hadac E. M., Miller L. J. (1999) J. Biol. Chem. 274, 903–909 [DOI] [PubMed] [Google Scholar]
- 33. Ji Z., Hadac E. M., Henne R. M., Patel S. A., Lybrand T. P., Miller L. J. (1997) J. Biol. Chem. 272, 24393–24401 [DOI] [PubMed] [Google Scholar]
- 34. Abagyan R., Totrov M., Kuznetsov D. (1994) J. Comput. Chem. 15, 488–506 [Google Scholar]
- 35. Abagyan R., Totrov M. (1994) J. Mol. Biol. 235, 983–1002 [DOI] [PubMed] [Google Scholar]
- 36. Metropolis N., Rosenbluth A. W., Rosenbluth M. N., Teller A. H., Teller E. (1953) J. Chem. Phys. 21, 1087–1092 [Google Scholar]
- 37. Hooft R. W., Vriend G., Sander C., Abola E. E. (1996) Nature 381, 272–272 [DOI] [PubMed] [Google Scholar]
- 38. Laskowski R. A., MacArthur M. W., Moss D. S., Thornton J. M. (1993) J. Appl. Crystallogr. 26, 283–291 [Google Scholar]
- 39. Michino M., Abola E., Brooks C. L., 3rd, Dixon J. S., Moult J., Stevens R. C. (2009) Nat. Rev. Drug Discov. 8, 455–463 [DOI] [PMC free article] [PubMed] [Google Scholar]
- 40. Dong M., Lam P. C., Pinon D. I., Orry A., Sexton P. M., Abagyan R., Miller L. J. (2010) J. Biol. Chem. 285, 9919–9931 [DOI] [PMC free article] [PubMed] [Google Scholar]
- 41. Tokuyama Y., Matsui K., Egashira T., Nozaki O., Ishizuka T., Kanatsuka A. (2004) Diabetes Res. Clin. Pract. 66, 63–69 [DOI] [PubMed] [Google Scholar]
- 42. Pham V., Wade J. D., Purdue B. W., Sexton P. M. (2004) J. Biol. Chem. 279, 6720–6729 [DOI] [PubMed] [Google Scholar]
- 43. Zang M., Dong M., Pinon D. I., Ding X. Q., Hadac E. M., Li Z., Lybrand T. P., Miller L. J. (2003) Mol. Pharmacol. 63, 993–1001 [DOI] [PubMed] [Google Scholar]
- 44. Ceraudo E., Murail S., Tan Y. V., Lacapère J. J., Neumann J. M., Couvineau A., Laburthe M. (2008) Mol. Endocrinol. 22, 147–155 [DOI] [PMC free article] [PubMed] [Google Scholar]
- 45. Ceraudo E., Tan Y. V., Nicole P., Couvineau A., Laburthe M. (2008) J. Mol. Neurosci. 36, 245–248 [DOI] [PubMed] [Google Scholar]
- 46. Gensure R. C., Gardella T. J., Jüppner H. (2001) J. Biol. Chem. 276, 28650–28658 [DOI] [PubMed] [Google Scholar]
- 47. Adams A. E., Bisello A., Chorev M., Rosenblatt M., Suva L. J. (1998) Mol. Endocrinol. 12, 1673–1683 [DOI] [PubMed] [Google Scholar]
- 48. Wittelsberger A., Corich M., Thomas B. E., Lee B. K., Barazza A., Czodrowski P., Mierke D. F., Chorev M., Rosenblatt M. (2006) Biochemistry 45, 2027–2034 [DOI] [PubMed] [Google Scholar]
- 49. Zhou A. T., Bessalle R., Bisello A., Nakamoto C., Rosenblatt M., Suva L. J., Chorev M. (1997) Proc. Natl. Acad. Sci. U.S.A. 94, 3644–3649 [DOI] [PMC free article] [PubMed] [Google Scholar]
- 50. Gaylinn B. D. (2002) Receptors Channels 8, 155–162 [PubMed] [Google Scholar]
- 51. Carter P. H., Shimizu M., Luck M. D., Gardella T. J. (1999) J. Biol. Chem. 274, 31955–31960 [DOI] [PubMed] [Google Scholar]
- 52. Couvineau A., Gaudin P., Maoret J. J., Rouyer-Fessard C., Nicole P., Laburthe M. (1995) Biochem. Biophys. Res. Commun. 206, 246–252 [DOI] [PubMed] [Google Scholar]
- 53. Olde B., Sabirsh A., Owman C. (1998) J. Mol. Neurosci. 11, 127–134 [DOI] [PubMed] [Google Scholar]
- 54. Dong M., Cox R. F., Miller L. J. (2009) J. Biol. Chem. 284, 21839–21847 [DOI] [PMC free article] [PubMed] [Google Scholar]
- 55. Mann R. J., Al-Sabah S., de Maturana R. L., Sinfield J. K., Donnelly D. (2010) Peptides 31, 2289–2293 [DOI] [PubMed] [Google Scholar]
- 56. Al-Sabah S., Donnelly D. (2003) FEBS Lett. 553, 342–346 [DOI] [PubMed] [Google Scholar]
- 57. Liaw C. W., Grigoriadis D. E., Lovenberg T. W., De Souza E. B., Maki R. A. (1997) Mol. Endocrinol. 11, 980–985 [DOI] [PubMed] [Google Scholar]
- 58. Dautzenberg F. M., Higelin J., Brauns O., Butscha B., Hauger R. L. (2002) Mol. Pharmacol. 61, 1132–1139 [DOI] [PubMed] [Google Scholar]
- 59. Lee C., Luck M. D., Jüppner H., Potts J. T., Jr., Kronenberg H. M., Gardella T. J. (1995) Mol. Endocrinol. 9, 1269–1278 [DOI] [PubMed] [Google Scholar]
- 60. Bergwitz C., Jusseaume S. A., Luck M. D., Jüppner H., Gardella T. J. (1997) J. Biol. Chem. 272, 28861–28868 [DOI] [PubMed] [Google Scholar]
- 61. Runge S., Gram C., Brauner-Osborne H., Madsen K., Knudsen L. B., Wulff B. S. (2003) J. Biol. Chem. 278, 28005–28010 [DOI] [PubMed] [Google Scholar]
- 62. Assil-Kishawi I., Abou-Samra A. B. (2002) J. Biol. Chem. 277, 32558–32561 [DOI] [PubMed] [Google Scholar]
- 63. Kraetke O., Holeran B., Berger H., Escher E., Bienert M., Beyermann M. (2005) Biochemistry 44, 15569–15577 [DOI] [PubMed] [Google Scholar]
- 64. Bisello A., Adams A. E., Mierke D. F., Pellegrini M., Rosenblatt M., Suva L. J., Chorev M. (1998) J. Biol. Chem. 273, 22498–22505 [DOI] [PubMed] [Google Scholar]
- 65. Dong M., Li Z., Pinon D. I., Lybrand T. P., Miller L. J. (2004) J. Biol. Chem. 279, 2894–2903 [DOI] [PubMed] [Google Scholar]
- 66. Dong M., Pinon D. I., Cox R. F., Miller L. J. (2004) J. Biol. Chem. 279, 31177–31182 [DOI] [PubMed] [Google Scholar]
- 67. Dong M., Lam P. C., Pinon D. I., Sexton P. M., Abagyan R., Miller L. J. (2008) Mol. Pharmacol. 74, 413–422 [DOI] [PMC free article] [PubMed] [Google Scholar]
- 68. Gensure R. C., Shimizu N., Tsang J., Gardella T. J. (2003) Mol. Endocrinol. 17, 2647–2658 [DOI] [PubMed] [Google Scholar]
- 69. Greenberg Z., Bisello A., Mierke D. F., Rosenblatt M., Chorev M. (2000) Biochemistry 39, 8142–8152 [DOI] [PubMed] [Google Scholar]
- 70. Lin F., Wang R. (2009) J. Mol. Model. 15, 53–65 [DOI] [PubMed] [Google Scholar]
- 71. López de Maturana R., Treece-Birch J., Abidi F., Findlay J. B., Donnelly D. (2004) Protein Pept. Lett. 11, 15–22 [DOI] [PubMed] [Google Scholar]


