Abstract
The sphingolipid ceramide has been widely implicated in the regulation of programmed cell death or apoptosis. The accumulation of ceramide has been demonstrated in a wide variety of experimental models of apoptosis and in response to a myriad of stimuli and cellular stresses. However, the detailed mechanisms of its generation and regulatory role during apoptosis are poorly understood. We sought to determine the regulation and roles of ceramide production in a model of ultraviolet light-C (UV-C)-induced programmed cell death. We found that UV-C irradiation induces the accumulation of multiple sphingolipid species including ceramide, dihydroceramide, sphingomyelin, and hexosylceramide. Late ceramide generation was also found to be regulated by Bcl-xL, Bak, and caspases. Surprisingly, inhibition of de novo synthesis using myriocin or fumonisin B1 resulted in decreased overall cellular ceramide levels basally and in response to UV-C, but only fumonisin B1 inhibited cell death, suggesting the presence of a ceramide synthase (CerS)-dependent, sphingosine-derived pool of ceramide in regulating programmed cell death. We found that this pool did not regulate the mitochondrial pathway, but it did partially regulate activation of caspase-7 and, more importantly, was necessary for late plasma membrane permeabilization. Attempting to identify the CerS responsible for this effect, we found that combined knockdown of CerS5 and CerS6 was able to decrease long-chain ceramide accumulation and plasma membrane permeabilization. These data identify a novel role for CerS and the sphingosine salvage pathway in regulating membrane permeability in the execution phase of programmed cell death.
Keywords: Apoptosis, Cell Death, Membrane Lipids, Necrosis (Necrotic Death), Sphingolipid, CerS5, CerS6, Ceramide, Ceramide Synthase, Programmed Cell Death
Introduction
Programmed cell death is a complex process whereby cells respond to external or internal stimuli by undergoing genetically programmed self-destruction. Although many variations of programmed cell death have been described, key pathways controlling most forms include mitochondrial outer membrane permeabilization (MOMP),2 release of mitochondrial intermembrane space proteins (e.g. cytochrome c), and protease activation (1). Well established mediators of programmed cell death include members of the Bcl-2 family of proteins (e.g. Bcl-2, Bcl-xL, Bax, Bak, BH3-only proteins, etc.), which control MOMP, and caspases, which are proteases that control initiation (e.g. caspase-2, -8, -9, etc.) or execution (e.g. caspase-3, -6, and -7) of cell death (2). The upstream pathways leading to MOMP and caspase activation depend largely on the nature of the death stimulus. For example, genotoxic stress can induce accumulation of p53, stimulation of p53-mediated transcription of the BH3-only proteins p53 up-regulated modulator of apoptosis (PUMA) and Noxa, and activation of Bax and Bak (3–5). Bax and Bak activation are considered a key event in programmed cell death; cells deficient in Bax and Bak fail to undergo apoptosis in response to a wide variety of stimuli (6, 7).
Sphingolipid metabolism has also been broadly implicated in the control of programmed cell death (8, 9). Three general phenomena have been described. First, the induction of programmed cell death is associated with an increase in cellular ceramide (Cer) levels (10–13). Second, inhibition of Cer generation using pharmacological agents or deficiency in Cer-producing enzymes can reduce or delay the progression of cell death (10, 14–17). Third, treatment of cells with exogenous Cer, Cer analogs, or agents that promote Cer accumulation can induce or promote cell death (18–20).
The accumulation of Cer during the progression of programmed cell death has been demonstrated in numerous systems and in response to a myriad of stimuli. The involvement of several sphingolipid enzymes and metabolic pathways has been demonstrated including de novo Cer synthesis (10, 16, 21), sphingomyelin (SM) hydrolysis (12, 22–25), loss of sphingosine kinase (26), and Cer generation through the sphingosine salvage pathway (27, 28). Cer derived from sphingomyelinase (SMase) activation typically accumulates within the 1st h following a death stimulus, whereas de novo derived Cer accumulates later (>2 h) (14, 29–31).
Despite being widely implicated in programmed cell death, the mechanisms of Cer generation and its functions in regulating cell death pathways remain ill defined. Several studies have suggested that Cer regulates the mitochondrial pathway of apoptosis through regulating Bcl-2 family members and MOMP (27, 32–34). Furthermore, synthesis of Cer via Cer synthase (CerS) has been widely implicated in the regulation of cell death (10, 16, 21). We hypothesized that, in a model of ultraviolet light-C (UV-C)-induced programmed cell death, Cer generation would be necessary for the activation of the mitochondrial pathway and apoptosis. We found that UV-C induced the accumulation of multiple sphingolipid species including dihydroceramide (dHCer) and Cer. Inhibition of de novo synthesis greatly reduced the levels of Cer in cells both basally and following UV-C irradiation, but only inhibition of CerS was able to protect from cell death. Moreover, this protection occurred downstream or independently of mitochondrial permeabilization. Inhibition of CerS greatly inhibited plasma membrane permeabilization. These data identify a novel pool of CerS-derived Cer that regulates plasma membrane permeabilization in the execution phase of apoptosis.
EXPERIMENTAL PROCEDURES
Materials
Myriocin was from Sigma-Aldrich. Fumonisin B1 was from Alexis Biochemicals (Lausanne, Switzerland), Cayman Chemicals (Ann Arbor, MI), or Acros Organics (Geel, Belgium). Z-VAD-fmk was from R&D Systems (Minneapolis, MN). Conformation-specific anti-Bax mouse monoclonal (clone 6A7) antibody and anti-cytochrome c mouse monoclonal (clone 6H2.B4) were from BD Pharmingen. Anti-Bak mouse monoclonal (clone Ab-1) was from Calbiochem/EMD Chemicals. Anti-Bax mouse monoclonal antibody (clone 2D2) and anti-Bak rabbit polyclonal antibodies were from Sigma. Anti-heat shock protein 60 (HSP60) rabbit polyclonal antibody and anti-poly(ADP-ribose) polymerase rabbit polyclonal antibody were from Santa Cruz Biotechnology (Santa Cruz, CA). FITC-conjugated goat anti-mouse and TRITC-conjugated goat anti-rabbit secondary antibodies were from Jackson ImmunoResearch Laboratories (West Grove, PA). DRAQ5 nuclear stain was from Axxora, LLC (San Diego, CA). 17-Carbon sphingosine (17C-Sph), 17-carbon dihydrosphingosine, and palmitoyl-CoA were purchased from Avanti Polar Lipids (Alabaster, AL). Human tumor necrosis factor-α was purchased from PeproTech (Rocky Hill, NJ).
Cell Culture
MCF-7 human breast adenocarcinoma cells (from ATCC) were maintained in RPMI 1640 medium (Invitrogen) supplemented with l-glutamine and 10% (v/v) fetal bovine serum (FBS). Cells were kept in a humidified incubator at 37 °C with 5% CO2. MCF-7 cells stably expressing Bcl-xL or vector control were maintained in RPMI 1640 medium containing 10% (v/v) FBS and 150 μg/ml hygromycin (Calbiochem). Hygromycin was omitted from the medium during experiments. HeLa cervical carcinoma cells were maintained in Dulbecco's modified Eagle's medium (DMEM) containing high glucose and supplemented with l-glutamine and 10% (v/v) FBS.
UV-C Treatment of Cells
UV-C irradiation was performed using a Bio-Rad GS Gene Linker cabinet that emits UV-C (λ = 253.7 nm). Unless otherwise indicated, the cells were provided fresh media (with or without pharmacological agents) 30 min prior to irradiation. The tops of cell-containing dishes were removed, and the dishes were placed within the cabinet. Cells were then treated with 10 mJ/cm2 UV light, dish tops were replaced, and cell dishes were placed in a humidified incubator for the indicated durations. When used, pharmacological agents remained in the media during and after irradiation until harvest.
Trypan Blue Dye Exclusion Assay for Non-viable Cells
Following treatment, non-adherent cells were harvested by centrifugation, and adherent cells were harvested by trypsinization with 0.05% trypsin, EDTA (Invitrogen). Cells were resuspended in phosphate-buffered saline and then diluted 1:1 with 0.4% trypan blue dye (Sigma). The number of stained and non-stained cells was determined using a hemacytometer.
Confocal Microscopy
Cells were plated into 35-mm dishes containing glass coverslip bottoms (MatTek, Ashland, MA) and treated as indicated. Cells were then fixed with 3.7% paraformaldehyde, permeabilized with 0.1% Triton X-100, and blocked in 2% human serum. Bax and Bak activation was determined using conformation-specific antibodies anti-Bax 6A7 (1:50 dilution) and anti-Bak Ab-1 (1:50 dilution), respectively (35, 36). Cytochrome c was detected by a mouse monoclonal antibody (1:100 dilution). HSP60 was detected using a rabbit polyclonal antibody (1:100 dilution). FITC-conjugated goat anti-mouse and TRITC-conjugated goat anti-rabbit were used at a dilution of 1:100. Cells were incubated overnight with primary antibodies followed by washing three times with PBS. Secondary antibodies were incubated for 1 h at room temperature. Cells were then stained with DRAQ5 nuclear stain (5 μm) followed by washing three times with PBS. Cells were then imaged by confocal microscopy.
Sphingolipid Analysis by Quantitative High Performance Liquid Chromatography/Mass Spectrometry (HPLC/MS)
MCF-7 cells were harvested by scraping into ice-cold PBS and pelleted. Cell pellets were stored at −80 °C until extraction and analysis by the Lipidomics Core Facility at the Medical University of South Carolina using HPLC/MS determination of sphingolipid mass levels as described previously (37). Sphingoid bases, sphingoid base phosphates, dHCer, Cer, SM, hexosylceramides (HexCer; consisting of glucosyl- and galactosylceramides), and lactosylceramides (LacCer) were detected and quantified. Sphingolipid levels were normalized to total lipid phosphate, and lipid phosphate content was determined as described previously (38).
17-Carbon Sphingosine Labeling of Cer
Cells were treated with UV-C as indicated, and 30 min prior to harvest, 17C-Sph was added to the media (1 μm final concentration from ethanol stock). Cells were harvested by scraping into ice-cold PBS, pelleted, and resuspended in cell extraction solution (ethyl acetate/isopropanol/water, 60:30:10, v/v/v). Samples were stored at −80 °C until extraction and analysis as described above.
In Vitro Ceramide Synthase Activity
In vitro CerS activity was performed essentially as described previously (39). Cells were treated as indicated and then harvested by scraping into ice-cold PBS. Either whole cell lysates or microsomes were prepared for use in the assay. Microsomes were prepared as described previously (40). Briefly, cells were resuspended in 20 mm HEPES (pH 7.4), 250 mm sucrose, 2 mm KCL, and 2 mm MgCl2 and lysed by six passages through a 28-gauge syringe. Lysates were centrifuged at 1,000 × g at 4 °C for 10 min to pellet nuclei and unbroken cells. The resulting supernatant was centrifuged at 8,000 × g for 10 min to pellet the heavy membrane fraction, and this supernatant was spun at 100,000 × g for 1 h to obtain microsomes. Microsomes were resuspended in HEPES lysis buffer and sonicated 2 × 10 s, and the protein content was determined by the Bradford assay (Bio-Rad). For whole cell lysates, cell pellets were resuspended in HEPES lysis buffer and sonicated, and protein content was determined by the Bradford assay.
CerS activity of whole cell lysates or microsomes was determined as described previously (40). A reaction mixture (100-μl final volume) containing 15 μm 17C-Sph and 50 μm palmitoyl-CoA in 25 mm potassium phosphate buffer (pH 7.4) was prewarmed at 37 °C for 5 min followed by addition of 25 μg of microsomes to start the reaction. The reaction time was 15 min after which the reaction mixture was transferred to a glass tube containing 2 ml of extraction solvent (ethyl acetate/2-propanol/water, 60:30:10, v/v/v), which stops the reaction. Lipids were extracted as described previously, and 17C16:0-Cer content was determined by HPLC/MS (37, 40).
In Vitro SMase Activity Assays
The acid SMase (aSMase) activity assay was performed essentially as described previously (41). Cells were harvested by centrifugation following a wash with cold PBS. Cell pellets were resuspended in aSMase lysis buffer (0.2% Triton X-100, 50 mm Tris-HCl (pH 7.4), 1:200 phosphatase inhibitor mixtures 1 and 2 (Sigma), 1:200 protease inhibitor mixture (Sigma), and 1.0 mm EDTA). Lysates were then sonicated briefly (one to two pulses; 10 s), and cellular debris and unbroken cells were pelleted by centrifugation at 1,000 × g for 5 min at 4 °C. Clarified lysates were normalized to protein concentration using the BCA protein assay (Thermo Scientific, Rockford, IL), and the indicated amount of lysate in a total volume of 100 μl was added to borosilicate tubes (13 × 100 mm) containing 100 μl of the reaction mixture containing 100 μm porcine brain SM (Avanti Polar Lipids) and 1 × 10⁵ cpm [choline-methyl-14C]SM (kindly supplied by Dr. Alicja Bielawska, Medical University of South Carolina Lipidomics Core Facility) presented in micelles containing 0.2% Triton X-100 in 250 mm sodium acetate buffer (pH 5.0) supplemented with 1.0 mm EDTA. The reaction was run for 30 min at 37 °C. The reaction was terminated by adding 1.5 ml of chloroform/methanol (2:1, v/v) followed by addition of 0.4 ml of distilled H2O (modified Folch extraction) (34). Samples were then vortexed briefly and subjected to centrifugation at 2,000 × g (3,000 rpm) for 5 min at room temperature to separate phases. Aliquots (800 μl) of the upper (aqueous) phase were used for liquid scintillation counting.
Neutral SMase (nSMase) activity was measured in vitro using a mixed micelle assay with radiolabeled substrate as described previously (42). Lysates were prepared in a similar manner as for the aSMase activity determination described above. Assays were started by the addition of 100 μl of the reaction mixture containing 200 μm porcine brain SM (Avanti Polar Lipids), 100 μm phosphatidylserine (Avanti), and 1 × 10⁵ cpm [choline-methyl-14C]SM presented in micelles containing 0.2% Triton X-100 in 200 mm Tris assay buffer (pH 7.4) supplemented with 10 mm MgCl2 and 5 mm DTT. All subsequent steps were the same as those described for the aSMase assay above.
Real Time Quantitative PCR Analysis
RNA was extracted using a Qiagen RNeasy® kit according to the manufacturer's protocol. The RNA concentration was determined by the Quant-iTTM RiboGreen® RNA Assay kit (Invitrogen). One microgram of RNA was used to produce cDNA using the SuperScript First-Strand Synthesis System (Invitrogen). The resultant cDNA was used for real time quantitative PCR using the QuantiTect SYBR Green PCR kit (Invitrogen) on an ABI 7300 quantitative PCR system (Applied Biosystems, Foster City, CA) as described by the manufacturer.
Primers used for real time quantitative PCR analysis were targeted to human CERS family members and were as follows: CERS1: forward, 5′-ACG CTA CGC TAT ACA TGG ACA C-3′; reverse, 5′-AGG AGG AGA CGA TGA GGA TGA G-3′; CERS2: forward, 5′-CCG ATT ACC TGC TGG AGT CAG-3′; reverse, 5′-GGC GAA GAC GAT GAA GAT GTT G-3′; CERS3: forward, 5′-ACA TTC CAC AAG GCA ACC ATT G-3′; reverse, 5′-CTC TTG ATT CCG CCG ACT CC-3′; CERS4: forward, 5′-CTT CGT GGC GGT CAT CCT G-3′; reverse, 5′-TGT AAC AGC AGC ACC AGA GAG-3′; CERS5: forward, 5′-TGT AAC AGC AGC ACC AGA GAG-3′; reverse, 5′-GCC AGC ACT GTC GGA TGT C-3′; and CERS6: forward, 5′-GGG ATC TTA GCC TGG TTC TGG-3′; reverse, 5′-GCC TCC TCC GTG TTC TTC AG-3′. Primers used for β-actin expression were as follows: forward, 5′-ATT GGC AAT GAG CGG TTC C-3′; and reverse, 5′-GGT AGT TTC GTG GAT GCC ACA-3′.
siRNA Transfection
Cells were plated at 1.5 × 10⁵ cells/dish (60-cm dish) and incubated for 24 h. At 24 h, cells were transfected with double-stranded RNA oligomers using Oligofectamine (Invitrogen) according to the manufacturer's protocol. Forty-eight hours post-transfection, media were changed, and cells were treated as indicated. siRNA sequences used in this study are as follows: siBax (Qiagen, Hs_BAX_5_HP, catalogue number SI00299390; sequence not provided at date of purchase), siBak (Qiagen, Hs_BAK1_5_HP, catalogue number SI00299376; sequence not provided at date of purchase), siCerS1 (sense, r(GGU CCU GUA UGC CAC CAG U)dTdT; antisense, r(ACU GGU GGC AUA CAG GAC C)dTdT), siCerS5 (sense, r(GGU UCU UUC AGU AAU GUU A)dTdT; antisense, r(UAA CAU UAC UGA AAG AAC C)dTdG), siCerS6 (sense, r(GGU CUU ACU GUA UUA UGA A)dTdT; antisense, r(UUC ACA AUC AAG UAA GAC C)dAdG), and AllStars Negative Control (siControl) (Qiagen).
Caspase-3/7 Activity Determination
Caspase-3/7 activity was determined using a fluorometric assay provided by BioVision Research Products (Mountain View, CA) using the manufacturer's protocol with a few modifications. Briefly, cells were treated as described, scraped into ice-cold PBS, and pelleted. Lysates were prepared by resuspending cell pellets in a lysis buffer provided in the kit and freezing at −20 °C. On the day of the assay, the frozen lysates were thawed on ice and centrifuged briefly, and the protein content was determined by the Bradford assay. To begin the reaction, 50 μg of lysate in 50 μl of lysis buffer was added to 2× reaction buffer containing 10 mm DTT and the DEVD-AFC (where AFC is 7-amino-4-trifluoromethylcoumarin) substrate. Reactions were incubated for 2 h after which fluorescence (400-nm excitation and 500-nm emission) was determined. Background fluorescence was determined using reactions lacking lysate, and this value was subtracted from the fluorescence observed in the treatment samples.
Lactate Dehydrogenase Release
Lactate dehydrogenase (LDH) release was determined using the LDH-Cytotoxicity Assay kit II from BioVision Research Products according to the manufacturer's instructions. Briefly, cells were treated as indicated, and 100 μl of cell-conditioned medium was transferred to a microcentrifuge tube and centrifuged at 600 × g for 10 min. Ten microliters of the resulting supernatant was transferred in triplicate to wells in a 96-well plate. One hundred microliters of reaction mixture containing WST (1-methoxy-5-methylphenazinium methyl sulphate) substrate was added, and the plates were incubated for 30 min at room temperature. Cells treated for 10 min with 0.1% Triton X-100 were used as a 100% control, and non-cell-conditioned medium was used to determine background activity.
Statistical Analysis
Statistical significance was determined using a Student's two-tailed unpaired t test for single comparisons. For multiple comparisons, we used one- or two-way ANOVA with Bonferroni post tests. α = 0.05 was our criterion for significance.
RESULTS
Characterization of UV-C-induced Programmed Cell Death in MCF-7 Cells
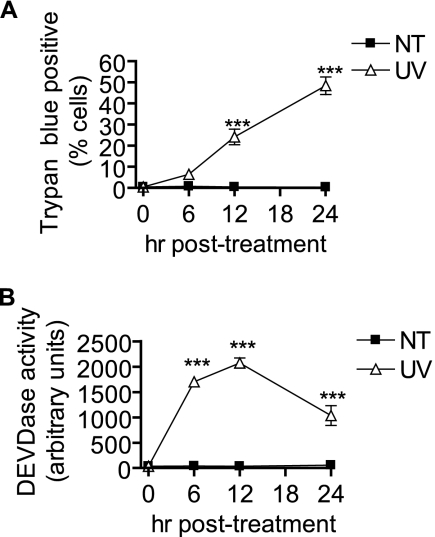
We first sought to characterize UV-C-induced cell death in MCF-7 cells in regard to common programmed cell death mediators. As indicated in Fig. 1, UV-C indeed induced cell death (Fig. 1A) and DEVDase activity (Fig. 1B) 6–12 h postirradiation. Because MCF-7 cells do not possess functional caspase-3, this latter activity is likely due solely to the activation of caspase-7 (43). Interestingly, the caspase-7 activity was highest in the first 12 h following irradiation and declined at the latest time point when cell death was highest.
FIGURE 1.
UV-C irradiation induces caspase activation and programmed cell death in MCF-7 cells. MCF-7 cells were treated (UV) or not treated (NT) with 10 mJ/cm2 UV-C followed by incubation for the indicated time points. UV-C-induced cell death was measured by trypan blue exclusion assay (A) as described under “Experimental Procedures.” Data are mean and error bars represent S.E. of three independent experiments. B, time course of caspase-3/7-like DEVDase activity in UV-C-treated MCF-7 cells. Data represent mean and error bars represent S.E. of three independent experiments. ***, p < 0.001 versus untreated control cells.
Regulation of Sphingolipid Metabolism by UV-C
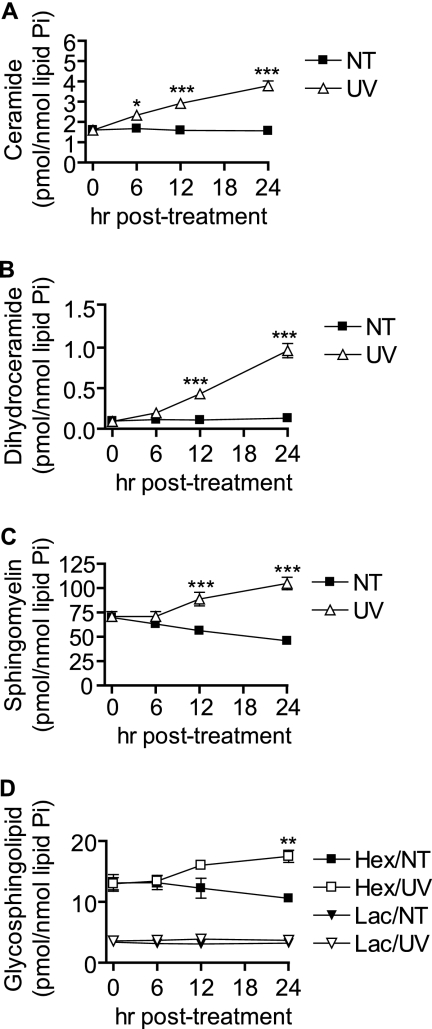
UV-C irradiation has been shown previously to induce Cer generation via activation of acid SMase within 30 min following treatment (44, 45), but little is known about subsequent effects of UV-C on sphingolipid metabolism and whether Cer accumulates at other time points. We used HPLC/MS to assess UV-C-induced changes in sphingolipid levels within 24 h following UV-C irradiation. In MCF-7 cells, we found that UV-C induced accumulation of total Cer by 6 h and dHCer by 12 h, both of which continued increasing to 24 h (Fig. 2, A and B). Concomitant with the late increases in Cer and dHCer, there was an increase in total SM (Fig. 2C) as well as a late increase in total HexCer (Fig. 2D). No significant changes in total LacCer were observed.
FIGURE 2.
UV-C induces accumulation of multiple sphingolipid species. MCF-7 cells were treated (UV) or not treated (NT) with 10 mJ/cm2 UV-C followed by incubation for the indicated durations, and cells were harvested for analysis by HPLC/MS. Total Cer (A), dHCer (B), SM (C), and HexCer (Hex) and lactosylceramide (Lac) (D) are shown. Data represent mean and error bars represent standard error of three independent experiments, and sphingolipid levels were normalized to total lipid phosphate. *, p < 0.05; **, p < 0.01; ***, p < 0.001 versus untreated control cells.
We also examined the individual sphingolipid species with regard to acyl chain length (supplemental Fig. S1, A and B). dHCer species, which showed a relatively diverse acyl chain profile, increased across the board. Cer species that were the least abundant (e.g. C18-Cer, C18:1-Cer, C20-Cer, C22:1-Cer, etc.) exhibited the greatest -fold increases. More abundant Cer species (e.g. C16-Cer, C24-Cer, and C24:1-Cer) showed more modest -fold changes, although they accounted for much more of the overall increase in Cer (supplemental Fig. S1B). SM species showed several changes following UV-C irradiation. In untreated cells, C14:0- and C16:0-SM species decreased slightly over 24 h, whereas other species stayed relatively constant. In UV-C-treated cells, nearly all species of SM increased. C16:0-SM, the most abundant SM, increased by more than 50 pmol/nmol of lipid phosphate, which was the largest mole change in a lipid we observed following UV-C irradiation. HexCer increased in a manner similar to Cer with the least abundant species (e.g. medium long-chain species) showing larger -fold changes. Although total LacCer did not show a statistically significant increase, minor species such as C18:0-LacCer and C20:0-LacCer showed slight decreases in untreated cells and increases in UV-C-treated cells, resulting in an overall significant increase in treated versus control cells. Also, no statistically significant changes in sphingosine (Sph) or dihydrosphingosine (dHSph) were seen, although there was a trend toward a decrease in Sph at 24 h compared with untreated controls (supplemental Fig. S1, C and D).
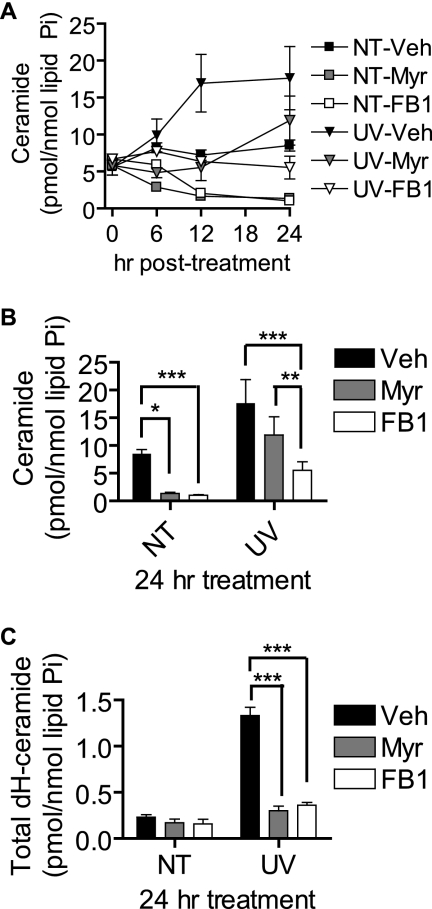
Because we observed UV-C-induced Cer accumulation in the absence of a decrease in SM, we hypothesized that Cer was accumulating due to increased de novo Cer synthesis or increased synthesis via the salvage pathway. To investigate the role of de novo synthesis, we used myriocin and fumonisin B1 (FB1), inhibitors of serine palmitoyltransferase and CerS, respectively. In the absence of UV-C treatment, both myriocin and FB1 decreased steady-state Cer levels (Fig. 3A) with myriocin depleting Cer to <25% of control levels by 12 h and fumonisin B1 being equally effective although with delayed kinetics. In UV-C-irradiated cells, these inhibitors were largely effective at reducing Cer accumulation compared with vehicle-treated cells (Fig. 3, A and B). However, neither myriocin nor FB1 prevented the UV-C-induced up-regulation of Cer above inhibitor-only treated levels. Interestingly, at the 24-h time point (Fig. 3B), FB1 was more effective than myriocin at inhibiting the Cer increase and maintained Cer levels below those of untreated cells. This effect was specific for Cer and not dHCer as both myriocin and FB1 inhibited the accumulation of the latter lipid (Fig. 3C).
FIGURE 3.
UV-C-induced late Cer generation is differentially inhibited by myriocin and fumonisin B1. MCF-7 cells were preincubated with myriocin (Myr; 100 nm), FB1 (50 μm), or vehicle (Veh; 0.1% methanol) for 30 min and then treated (UV) or not treated (NT) with 10 mJ/cm2 UV-C. The cells were then incubated for the indicated durations and harvested for analysis of Cer levels by HPLC/MS. A, effects of myriocin and FB1 on total Cer generation following UV-C irradiation. B and C, effect of myriocin and FB1 on C16:0-Cer (B) and C16:0-dHCer (C) accumulation at 24 h postirradiation. Data represent mean and error bars represent S.E. of three independent experiments, and sphingolipid levels were normalized to total lipid phosphate. *, p < 0.05; **, p < 0.01; ***, p < 0.001.
Examining individual Cer species, myriocin and FB1 were effective at reducing nearly all Cer species basally and preventing these species from accumulating in UV-C-induced death (supplemental Fig. S2A). However, FB1 was much more effective at preventing increases in Cer at the 24-h time point. FB1 also caused the accumulation of dHSph (>200-fold at 24 h), dihydrosphingosine 1-phosphate (>14-fold at 24 h), and Sph (∼2-fold at 6 h). Sphingosine 1-phosphate remained below detectable levels. In the presence of FB1, UV-C treatment caused dHSph levels to be less than those in non-UV-C-treated cells at 6 and 12 h (supplemental Fig. S2C), and FB1-induced dihydrosphingosine 1-phosphate was less at 6 h in UV-C-treated versus non-UV-C-treated cells (supplemental Fig. S2D).
Effect of UV-C on Cer-producing Enzymes
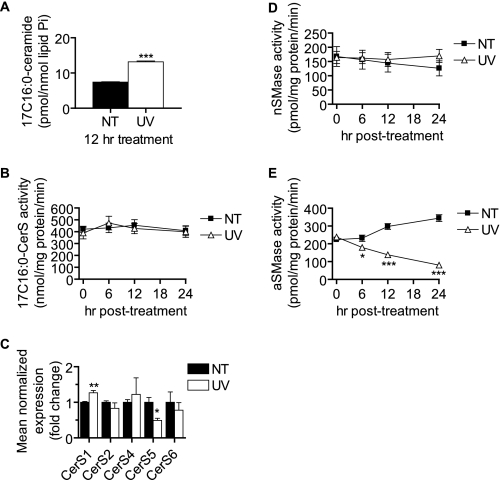
The ability of myriocin and FB1 to inhibit a large amount of the dHCer and Cer accumulation suggested that this accumulation might be due to up-regulated de novo synthesis and/or activation of CerS to produce more Cer through both de novo and sphingosine salvage pathways. Because UV-C failed to induce an accumulation of dHSph above that caused by FB1, we concluded that increased de novo synthesis at the level of serine palmitoyltransferase was not likely the mechanism of increased dHCer and Cer synthesis. We therefore asked whether CerS activity was being induced following UV-C treatment. Using a 17C-Sph labeling approach, we found that UV-C caused increased incorporation of 17C-Sph into C16:0-Cer (Fig. 4A). However, analysis of in vitro C16:0-CerS activity showed no changes compared with untreated cells at any of the time points measured (Fig. 4B). This was also true when microsomes were used as an enzyme source (data not shown). We also examined the expression of CerS1–6 in MCF-7 cells treated with UV-C (Fig. 4C) and found that CerS1 was slightly elevated (1.27-fold) and that CerS5 was decreased (∼50%). CerS3 was near or below the detectable limit in our analysis. These results suggest activation of CerS either indirectly or via allosteric mechanisms that are not captured using in vitro assays.
FIGURE 4.
UV-C irradiation increases CerS-derived Cer without up-regulating in vitro CerS activity or CerS expression or activating SMases. A, MCF-7 cells were treated (UV) or not treated (NT) with 10 mJ/cm2 UV-C followed by incubation for the indicated durations. Thirty minutes prior to harvest, 17C-Sph was added (1 μm). Following harvest, lipids were extracted, and 17C-Sph-containing ceramides were determined by HPLC/MS. Data represent mean and error bars represent S.E. of three independent experiments, and 17C-Cer levels were normalized to total lipid phosphate. Statistical significance was determined by Student's t test. B, cells were treated with UV-C as indicated, and whole cell lysates were prepared for the determination of in vitro CerS activity as described under “Experimental Procedures.” Data represent mean and error bars represent S.E. of four independent experiments assayed in duplicate. Statistical significance was determined by two-way ANOVA and Bonferroni post hoc tests. C, RT-quantitative PCR determination of CerS1–6 mRNA levels 12 h following UV-C irradiation. CerS3 was near or below detectable levels in all analyses. Data represent mean and S.E. of the -fold change above untreated cells. CerS mRNA levels were normalized to those of β-actin. Data represent three independent experiments, and statistical significance was determined by Student's t test. D and E, MCF-7 cells were treated with 10 mJ/cm2 UV-C followed by incubation for the indicated durations. Cells were then harvested, and nSMase (D) and aSMase (E) activities were determined as described under “Experimental Procedures.” Data are mean and error bars represent S.E. for three to five independent experiments. *, p < 0.05; **, p < 0.01; ***, p < 0.001 versus untreated control cells.
Because sphingomyelinases such as nSMase and aSMase have been widely implicated in cell death (23, 24), we examined whether these activities were being regulated by UV-C. We found that UV-C did not alter nSMase activity and caused a dramatic decrease in aSMase activity within 6 h and continuing up to 24 h (Fig. 4E), strongly suggesting that UV-C-induced sustained Cer was not due to SMase activation. Although the mechanism of the decrease in aSMase activity is unknown, it may be related to alterations in lysosomal homeostasis (e.g. lysosomal membrane permeabilization).3
Effects of Inhibition of Mitochondrial Pathway on Cer Accumulation and Cell Death
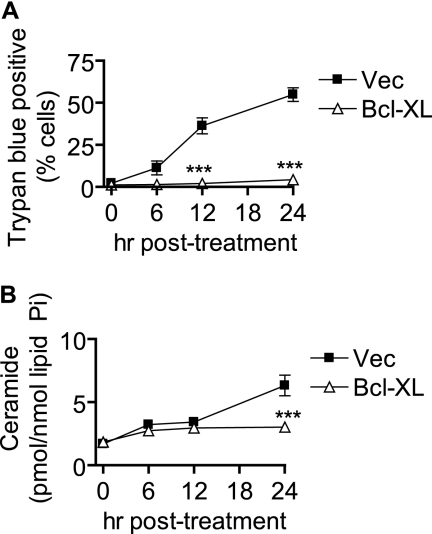
Although several factors have been shown previously to be activated or induced in MCF-7 cells following UV-C irradiation, little is known about which of these are required for programmed cell death. Because of the nearly universal role of Bcl-2-like family members such as Bax and Bak in controlling cell death, we chose to investigate how modulation of these proteins would affect Cer generation and cell death. We used MCF-7 cells stably expressing the antiapoptotic member Bcl-xL (MCF-7/Bcl-xL) or vector control (MCF-7/Vec) and examined cell death following UV-C irradiation. As indicated in Fig. 5A, Bcl-xL overexpression resulted in marked resistance to UV-C-induced death.
FIGURE 5.
Bcl-xL overexpression inhibits late UV-C-induced cell death and late Cer generation. MCF-7 cells stably expressing Bcl-xL or control vector (Vec) were treated with 10 mJ/cm2 UV-C followed by incubation for the indicated durations. Cells were then harvested for further analysis. A, cell death was determined by trypan blue exclusion. B, effect of Bcl-xL overexpression on UV-C-induced changes in total Cer. Data represent mean and error bars represent S.E. of three independent experiments, and Cer levels were normalized to total lipid phosphate. Statistical significance was determined by two-way ANOVA and Bonferroni post hoc tests. ***, p < 0.001 versus time-matched MCF-7/Vec cells.
We then analyzed UV-C-induced Cer levels in MCF-7/Vec and MCF-7/Bcl-xL cells (Fig. 5B). Bcl-xL-expressing cells exhibited reduced Cer generation at 24 h compared with vector controls. Examining the subspecies of Cer, we found that Bcl-xL expression affected generation of several species including those with long-chain, medium long-chain, and very long-chain acyl groups (supplemental Fig. S3A). These results suggest that two phases of Cer production can be distinguished by their susceptibility to Bcl-xL: the 6–12-h phase, which appears to occur independently of Bcl-xL action, and the 24-h phase, which is inhibited by Bcl-xL.
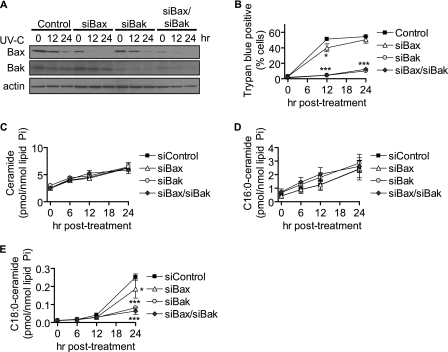
We next asked whether knockdown of Bax or Bak could affect cell death and Cer generation. Using siRNA, we knocked down Bax, Bak, or Bax and Bak together and assessed the degree of knockdown of Bax and Bak by Western blot (Fig. 6A). Both Bax and Bak were decreased by their corresponding siRNAs, and to our surprise, we found that Bax, but not Bak, showed a dramatic decrease in protein levels following UV-C irradiation even in siControl-transfected cells. We next assessed cell death and Cer generation in response to UV-C irradiation. We discovered that knockdown of Bak was quite effective at inhibiting cell death (Fig. 6B). Bax knockdown, on the other hand, was much less effective at inhibiting death. Combined knockdown of Bax and Bak had an effect that was similar to that of Bak alone.
FIGURE 6.
Bak knockdown attenuates late generation of medium long-chain Cer species and cell death. MCF-7 cells were transfected with 5 nm siRNA targeted against Bax, Bak, or Bax and Bak (2.5 nm each) or 5 nm non-targeted control for 48 h and then treated for the indicated durations. A, Western blot analysis of Bax and Bak knockdown and effects of UV-C irradiation. β-Actin was used as a gel loading control. The experiment was performed twice with similar results. B, cell death was determined by trypan blue assay. Data represent mean and S.E. for three independent experiments. C–E, effect of siBax and siBak on UV-C-induced total Cer (C), C16:0-Cer (D), and C18:0-Cer (E) levels by HPLC/MS. Data represent mean and error bars represent S.E. of three independent experiments, and Cer levels were normalized to total lipid phosphate. Statistical significance was determined by two-way ANOVA and Bonferroni post hoc tests. *, p < 0.05; ***, p < 0.001 versus time-matched siControl-transfected cells.
The effects of Bax or Bak knockdown on UV-C-induced Cer generation were then determined. To our surprise, cells treated with siBax or siBak still increased total Cer levels similarly to siControl-transfected cells (Fig. 6C). However, when we examined the effects on specific Cer species, we found that siBak knockdown failed to inhibit C16:0-Cer generation (Fig. 6D and Table 1), but it significantly inhibited the late (24-h) generation of C18:0-Cer (Fig. 6E and Table 1), C18:1-Cer, C20:0-Cer, and C20:1-Cer (supplemental Fig. S3B). Bax knockdown also showed a partial inhibitory effect on these same ceramides. These data suggest that Bak and Bax regulate a specific pool of Cer that accumulates late and is characterized by medium long-chain ceramides.
TABLE 1.
Effects of Bax and Bak knockdown on C16:0-ceramide and C18:0-ceramide generation
MCF-7 cells were transfected with 5 nm siRNA targeted against Bax, Bak, or Bax and Bak (2.5 nm each) or 5 nm non-targeted control for 48 h and then treated for the indicated durations. The effects of siBax and siBak on UV-C-induced total C16:0- and C18:0-Cer levels were determined by HPLC/MS. Data represent mean and S.E. of three independent experiments, and Cer levels were normalized to total lipid phosphate. Statistical significance was determined by two-way ANOVA and Bonferroni post hoc tests.
| h post-UV-C | siControl | siBax | siBak | siBax/siBak |
|---|---|---|---|---|
| pmol/nmol lipid Pi | ||||
| C16:0-ceramide | ||||
| 0 | 0.431 ± 0.180 | 0.432 ± 0.146 | 0.683 ± 0.108 | 0.731 ± 0.219 |
| 6 | 0.889 ± 0.282 | 0.899 ± 0.198 | 1.262 ± 0.256 | 1.448 ± 0.365 |
| 12 | 1.242 ± 0.396 | 1.256 ± 0.322 | 1.813 ± 0.330 | 2.029 ± 0.485 |
| 24 | 2.403 ± 0.629 | 2.431 ± 0.820 | 2.859 ± 0.652 | 2.614 ± 0.455 |
| C18:0-ceramide | ||||
| 0 | 0.0106 ± 0.0015 | 0.0112 ± 0.0008 | 0.0117 ± 0.0009 | 0.0120 ± 0.0017 |
| 6 | 0.0164 ± 0.0026 | 0.0154 ± 0.0014 | 0.0177 ± 0.0027 | 0.0168 ± 0.0031 |
| 12 | 0.0416 ± 0.0089 | 0.0291 ± 0.0035 | 0.0276 ± 0.0052 | 0.0296 ± 0.0049 |
| 24 | 0.2519 ± 0.0172 | 0.1856 ± 0.0502a | 0.0816 ± 0.0024b | 0.0636 ± 0.0177b |
a p < 0.05 versus time-matched siControl-transfected cells.
b p < 0.001 versus time-matched siControl-transfected cells.
Effects of Inhibition of Caspases on Cer Accumulation and Cell Death
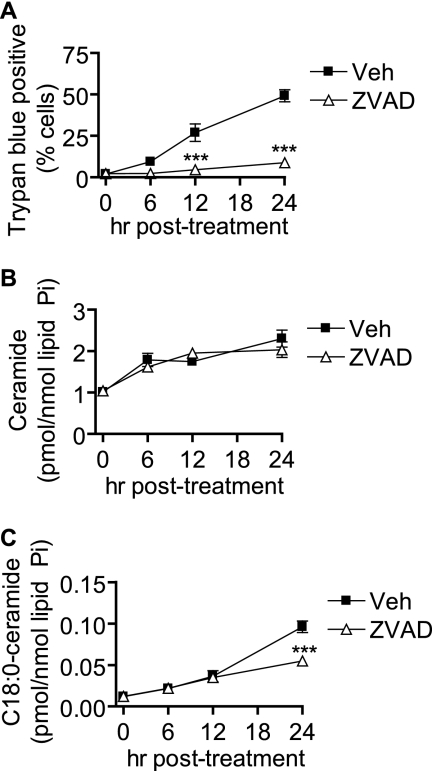
Because we observed the ability of inhibition of the mitochondrial pathway to inhibit Cer generation and cell death, we asked whether caspase activation would be necessary for these events as well. We treated cells with the broad spectrum caspase inhibitor Z-VAD-fmk or vehicle and assessed UV-C-induced cell death (Fig. 7A). As demonstrated in Fig. 7A, inhibition of caspases resulted in a significant reduction in cell death. Analysis of Cer levels revealed that total Cer generation was not significantly different in Z-VAD-treated cells when compared with vehicle-treated cells. However, when we analyzed the subspecies of Cer, we found that medium long-chain Cer species such as C18:0-Cer (Fig. 7C), C18:1-Cer, C20:0-Cer, and C20:1-Cer (supplemental Fig. S3C) were reduced at the 24-h time point in Z-VAD-treated cells compared with controls. These results suggest that medium long-chain Cer species may be involved in the regulation of the late events of cell death.
FIGURE 7.
Inhibition of caspases partially diminishes late UV-C-induced Cer generation and inhibits cell death. MCF-7 cells were pretreated for 30 min with either vehicle (Veh; 0.1% DMSO) or the broad spectrum caspase inhibitor Z-VAD-fmk (10 μm) and then treated (UV) or not treated (NT) with 10 mJ/cm2 UV-C. Cells were incubated for the indicated durations and then harvested for further analysis. A, cell death was determined by trypan blue assay. Data represent mean and S.E. for three independent experiments. B and C, effect of Z-VAD-fmk on UV-C-induced accumulation of total Cer (B) and C18:0-Cer (C). Data represent mean and S.E. of three independent experiments, and Cer levels were normalized to total lipid phosphate. Statistical significance was determined by two-way ANOVA and Bonferroni post hoc tests. ***, p < 0.001 versus time-matched vehicle treated cells.
Effects of Inhibition of Cer Accumulation on Pathways of Programmed Cell Death
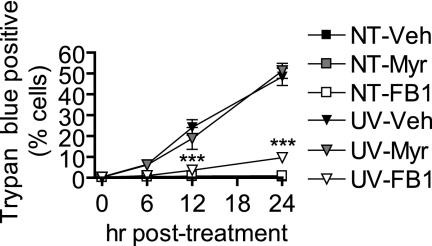
Because myriocin and FB1 were effective at inhibiting the increase in total cellular Cer induced by UV-C, we investigated whether these inhibitors could affect the progression of UV-C-induced programmed cell death as determined by trypan blue exclusion. We were surprised to find that myriocin had no effect on cell death (Fig. 8). On the other hand, FB1 treatment was quite effective at inhibiting cell death in response to UV-C irradiation.
FIGURE 8.
Inhibition of Cer synthases but not de novo synthesis inhibits programmed cell death as determined by trypan blue exclusion. MCF-7 cells were preincubated with myriocin (Myr; 100 nm), fumonisin B1 (50 μm), or vehicle (Veh; 0.1% methanol) for 30 min and then treated (UV) or not treated (NT) with 10 mJ/cm2 UV-C. The cells were then incubated for the indicated durations. Cell death was determined by trypan blue exclusion. Data represent mean and S.E. of three independent experiments. ***, p < 0.001 versus time-matched UV-C/vehicle-treated cells.
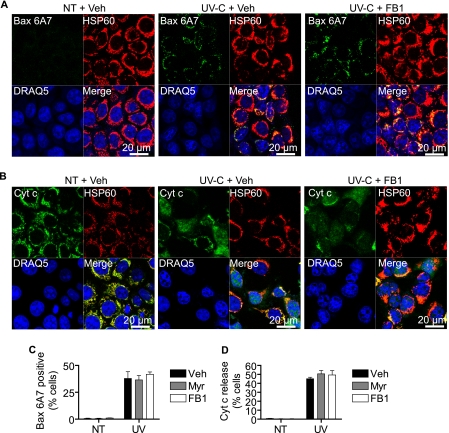
We next asked at what level in the cell death program was FB1 mediating its protective effects. Knowing that UV-C-mediated programmed cell death in MCF-7 cells involves the mitochondrial pathway (Figs. 5 and 6 and data not shown), we asked whether FB1 could prevent Bax activation or cytochrome c release. As indicated in Fig. 9, A and C, neither myriocin nor FB1 was able to prevent the activation of Bax. We also examined cytochrome c release and found that this too was not sensitive to FB1 (Fig. 9, B and D). In addition to exhibiting Bax activation and cytochrome c release, UV-C/FB1-treated cells showed nuclear condensation and chromatin marginalization similar to UV-C/vehicle-treated cells (Fig. 9, A and B, and data not shown).
FIGURE 9.
Inhibition of Cer synthases does not affect mitochondrial pathway. MCF-7 cells were preincubated with myriocin (Myr; 100 nm), fumonisin B1 (50 μm), or vehicle (Veh; 0.1% methanol) for 30 min and then treated (UV) or not treated (NT) with 10 mJ/cm2 UV-C. A, 6 h following UV-C irradiation, cells were fixed, and Bax activation was assessed by confocal immunofluorescence microscopy using a conformation-specific antibody recognizing activated Bax. B, 12 h following UV-C irradiation, cells were fixed, and cytochrome c release was assessed by confocal immunofluorescence microscopy. C, the number of cells exhibiting activated Bax was counted and expressed as a percentage of total cells. Data are mean and S.E. for three independent experiments. D, cells exhibiting cytosolic and nuclear staining of cytochrome c were counted and expressed as a percentage of total cells. Data are mean and S.E. for three independent experiments. HSP60 was used as a mitochondrial marker, and DRAQ5 was used to stain nuclei. Images are representative of at least three experiments.
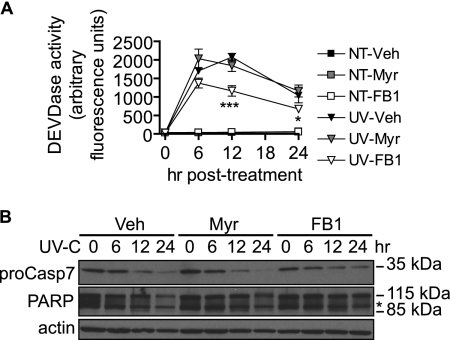
We then hypothesized that FB1-mediated inhibition of cell death occurred at the level of caspase activation. FB1 treatment, but not myriocin treatment, caused a partial inhibition of UV-C-induced DEVDase activity (Fig. 10A) and reduced cleavage of procaspase-7 and its substrate, poly(ADP-ribose) polymerase at 12 and 24 h postirradiation (Fig. 10B).
FIGURE 10.
Inhibition of CerS but not de novo synthesis partially inhibits caspase-7 activation. A, MCF-7 were cells preincubated with myriocin (Myr; 100 nm), fumonisin B1 (50 μm), or vehicle (Veh; 0.1% methanol) for 30 min and then treated (UV) or not treated (NT) with 10 mJ/cm2 UV-C. The cells were then incubated for the indicated durations. Cellular lysates were prepared, and caspase-3/7-like activity (DEVDase) was analyzed using an in vitro fluorometric assay as described under “Experimental Procedures.” Data are mean and S.E. for three independent experiments. Statistical significance was determined by two-way ANOVA and Bonferroni post hoc tests comparing UV-C/inhibitor-treated with UV-C/vehicle-treated samples. *, p < 0.05; ***, p < 0.001. B, cells were treated as in A, and cellular lysates were prepared for Western blot and determination of procaspase-7 (proCasp7) and poly(ADP-ribose) polymerase (PARP) cleavage. The experiment was performed twice with similar results. Asterisk represents a nonspecific band.
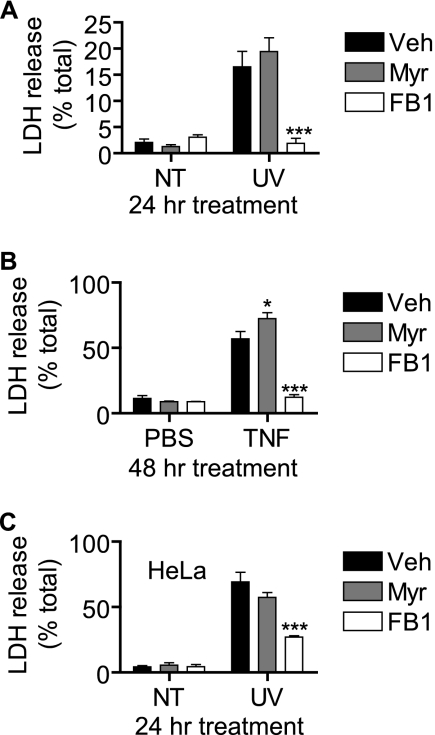
The most substantial effect of FB1 was on UV-C-induced trypan blue positivity. Because the trypan blue exclusion assay is a measure of membrane permeability, we assessed the ability of FB1 to prevent membrane permeabilization by another measure, namely the release of LDH into the medium. Indeed, FB1 but not myriocin was able to largely prevent UV-C-induced release of LDH (Fig. 11A). We next asked whether the inhibitory effect of FB1 was specific for UV-C-induced death and evaluated its ability to inhibit cell death induced by tumor necrosis factor-α (TNF-α). MCF-7 cells were treated with 3 nm TNF-α for 48 h, and LDH release was assessed. As shown in Fig. 11B, FB1 was quite effective at inhibiting TNF-α-induced LDH release, whereas myriocin slightly enhanced release. We also asked whether the protective effects were limited to the MCF-7 cell line by examining UV-C-induced cell death in HeLa cervical carcinoma cells. HeLa cells were treated with UV-C followed by 24 h of incubation in the presence of myriocin, FB1, or vehicle. Similar to results in MCF-7 cells, FB1 was able to protect HeLa cells from UV-C-induced LDH release (Fig. 11C). Taken together, these data suggest that an FB1-sensitive pool of generated Cer is critical for membrane permeabilization in the execution phase of programmed cell death.
FIGURE 11.
Inhibition of CerS but not de novo synthesis inhibits plasma membrane rupture that is not specific to UV-C irradiation or MCF-7 cells. A, MCF-7 cells were preincubated with myriocin (Myr; 100 nm), fumonisin B1 (50 μm), or vehicle (Veh; 0.1% methanol) for 30 min and then treated (UV) or not treated (NT) with 10 mJ/cm2 UV-C. The cells were then incubated for 24 h, and LDH release was assessed. Data represent mean and error bars represent S.E. of three independent experiments. B, MCF-7 cells were preincubated with myriocin (100 nm), fumonisin B1 (50 μm), or vehicle (0.1% methanol) for 30 min and then treated with 3 nm TNF-α or PBS for 48 h after which LDH release was assessed. Data represent mean and error bars represent S.E. of three independent experiments. C, HeLa cells were preincubated with myriocin (100 nm), fumonisin B1 (50 μm), or vehicle (0.1% methanol) for 30 min and then treated (UV) or not treated (NT) with 10 mJ/cm2 UV-C. The cells were then incubated for 24 h, and LDH release was assessed. Data are mean and error bars represent S.E. for three independent experiments. A–C, statistical significance was determined by two-way ANOVA and Bonferroni post hoc tests comparing UV-C/inhibitor-treated with UV-C/vehicle-treated samples. *, p < 0.05; ***, p < 0.001.
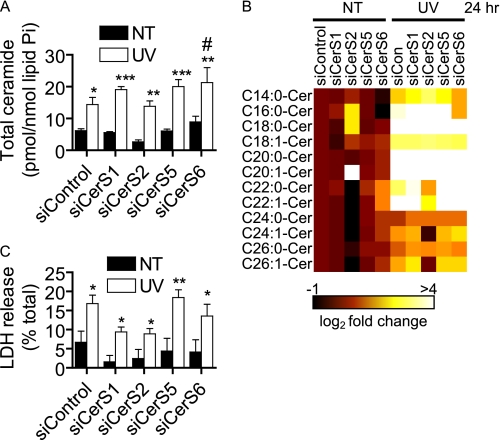
We next determined whether knockdown of individual CerS isoforms using siRNA could affect long-chain Cer generation and subsequently inhibit cell permeabilization in a manner similar to that of FB1. We have previously demonstrated the effects of CerS knockdown on sphingolipid levels in MCF-7 cells (46). We first verified knockdown of the major CerS isoforms in MCF-7 cells, CerS1, CerS2, CerS5, and CerS6 (supplemental Fig. S4, A–D), as well the ability to simultaneously knock down CerS5 and CerS6. We then evaluated the ability of CerS knockdown to inhibit UV-C-induced total Cer (Fig. 12A) and Cer subspecies accumulation (Fig. 12B and supplemental Table S1). We found that individual CerS knockdown did not significantly inhibit total Cer accumulation (Fig. 12A); on the contrary, knockdown of CerS6 actually increased total Cer levels. As expected from our previous work, CerS1 knockdown had minimal effects in untreated cells and failed to prevent the accumulation of any Cer species following irradiation. Knockdown of CerS2 in untreated cells reduced very long-chain Cer and increased long-chain Cer both in untreated and UV-C-treated cells (Fig. 12B and supplemental Table S1). CerS5 knockdown had no appreciable effects on Cer levels, but CerS6 knockdown clearly decreased C14:0- and C16:0-Cer basally and reduced their accumulation following UV-C irradiation. These data are consistent with our previous work showing that CerS2 and CerS6 are the major very long-chain and long-chain CerS isoforms in MCF-7 cells, respectively (46).
FIGURE 12.
Individual knockdown of particular CerS isoforms inhibits UV-C-induced ceramide accumulation but fails to significantly inhibit UV-C-induced plasma membrane permeabilization. A, cells were transfected with siCerS1, siCerS5, siCerS6, or siControl for 48 h, the media were changed, and cells were treated (UV) or not treated (NT) with 10 mJ/cm2 UV-C. The cells were then incubated for 24 h, and ceramide levels were measured by HPLC/MS. Total ceramide levels are reported (A), and a heat map displays the log2 -fold change of ceramide compared with untreated siControl (B). Statistical significance was determined by two-way ANOVA and Bonferroni post hoc tests. Data are mean and error bars represent S.E. of four independent experiments. C, cells were treated as in A, and LDH release was assessed and reported as a percentage of total LDH released from siRNA-transfected cells lysed with Triton X-100. Statistical significance was determined by two-way ANOVA and Bonferroni post hoc tests. Data are mean and error bars represent S.E. for five independent experiments.*, p < 0.05; **, p < 0.01; ***, p < 0.001 versus siRNA-matched untreated cells. #, p < 0.05 versus treatment-matched siControl-transfected cells.
We next examined the ability of CerS knockdowns to inhibit plasma membrane disruption. As shown in Fig. 12C, individual knockdown of CerS1, CerS2, CerS5, or CerS6 failed to significantly inhibit LDH release compared with siControl with all siRNA-treated cells showing a significant increase in LDH release following UV-C irradiation. There was a trend toward inhibition in both CerS1 and CerS2 knockdown cells, but these data failed to meet our criteria for statistical significance.
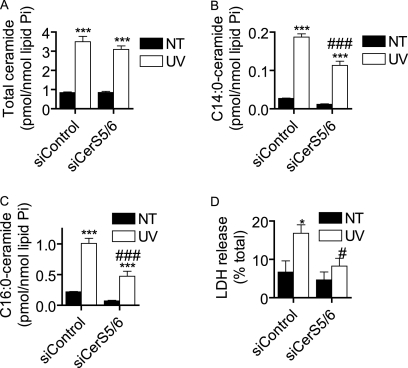
Because CerS5 and CerS6 are both C14:0/C16:0-CerS and CerS6 knockdown has been shown to up-regulate CerS5 (46), we asked whether combined knockdown of these enzymes would affect Cer generation and plasma membrane permeabilization. We first verified knockdown (supplemental Fig. S4, C and D) and then examined the effects of this treatment on UV-C-induced Cer accumulation (Fig. 13, A–C). Although total Cer accumulation was not affected (Fig. 13A), we found a significant inhibition of C14:0- and C16:0-Cer accumulation (Fig. 13, B and C, respectively). We then assessed UV-C-induced plasma membrane permeabilization following CerS5/6 knockdown and found that there was a significant inhibition in LDH release (Fig. 13D). These data suggest that CerS5- and CerS6-mediated long-chain Cer generation is necessary for the plasma membrane disruption that occurs in programmed cell death.
FIGURE 13.
Combined knockdown of CerS5 and CerS6 inhibits UV-C-induced long-chain ceramide accumulation and plasma membrane permeabilization. A–C, MCF-7 cells were transfected with siRNA targeted against CerS5 and CerS6 (siCerS5/6; 10 nm each) or non-targeted control (siControl; 20 nm) for 48 h. The media were then changed, and cells were treated (UV) or not treated (NT) with 10 mJ/cm2 UV-C. The cells were then incubated for 24 h, and ceramide levels were measured by HPLC/MS. Total ceramide levels are reported in A, and the effects on C14:0-ceramide and C16:0-ceramide are shown in B and C, respectively. Data on all subspecies can be found in supplemental Table S2. Ceramide data are mean and S.E. of four independent experiments, and statistical significance was determined by two-way ANOVA and Bonferroni post hoc tests. D, cells were treated as in A, and LDH release was assessed and reported as a percentage of total LDH released from siRNA-transfected cells lysed with Triton X-100. Statistical significance was determined by two-way ANOVA and Bonferroni post hoc tests. Data are mean and error bars represent S.E. for five independent experiments.*, p < 0.05; ***, p < 0.001 versus siRNA-matched untreated cells. #, p < 0.05; ###, p < 0.001 versus treatment-matched siControl-transfected cells.
DISCUSSION
In this study, we have demonstrated a novel role for CerS, specifically CerS5 and CerS6, in regulating a postmitochondrial event in programmed cell death, namely permeabilization of the plasma membrane. Furthermore, the Cer involved is likely derived from sphingosine salvage and not de novo synthesis as myriocin failed to prevent both late Cer generation or programmed cell death.
CerS has been shown to regulate programmed cell death in a plethora of model systems. In mammals, six CerS enzymes have been identified. Each of these enzymes has been shown to regulate the synthesis of Cer with particular chain lengths. For example, CerS1 regulates C18:0-Cer synthesis, CerS5 and CerS6 regulate C16:0-Cer synthesis, and CerS2 regulates very long-chain Cer synthesis. It has also been proposed that specific Cer species (e.g. C16:0-Cer and C18:0-Cer) may have opposing roles in the regulation of apoptosis (47–49). In other studies, C16:0-Cer has been implicated as a proapoptotic signaling molecule (27, 28, 50). In UV-C-induced cell death of MCF-7 cells, we observed the accumulation of multiple Cer species of different chain lengths as well as other sphingolipid species (Fig. 2 and supplemental Fig. S1). In general, species that were of lower abundance at base line showed the most dramatic increases in terms of -fold change. For example, C16:0- and C18:0-Cer levels in untreated cells were 0.545 ± 0.078 and 0.029 ± 0.004 pmol/nmol of lipid phosphate, respectively, and increased by ∼2.3- and 9.7-fold, respectively. dHCer also increased in a myriocin-sensitive manner (Fig. 3C and supplemental Fig. S2A), suggesting an up-regulation of de novo synthesis or an inhibition of the metabolism of these lipids. An increase in de novo synthesis could account for the increases in dHCer, Cer, SM, and HexCer. However, UV-C did not induce a further increase in dHSph in FB1-treated cells, suggesting that serine palmitoyltransferase-mediated production of this lipid is not being up-regulated (supplemental Fig. S2C). On the contrary, there was a trend toward a decrease in dHSph, which would support a role for increased CerS activity. However, CerS in vitro activity was not increased by UV-C irradiation (Fig. 4B). Furthermore, Cer accumulation occurred with a broad chain length distribution that does not suggest activation of any individual CerS isoform (supplemental Fig. S1B). From these data, it is likely that Cer accumulates in a CerS-dependent manner, but the direct mechanism of accumulation remains elusive. Possibilities include in vivo post-translational changes in multiple CerS activities that are lost in the in vitro assay or a decrease in CerS-derived Cer metabolism into other sphingolipids. In the latter case, it would not likely be SM or HexCer as our data show the increase of these lipids.
Another interesting finding was that UV-C induced the loss of aSMase activity (Fig. 4E) but not nSMase activity (Fig. 4D). Although the mechanism of this decrease is unclear, our preliminary data suggest that UV-C induces lysosomal permeabilization and/or alterations in the maintenance of certain lysosomal proteins such as cathepsin D and hexosaminidase A.3 Of note, UV-C irradiation has recently been demonstrated to induce lysosomal permeabilization in fibroblasts and monocytes (51). It is possible that disruption of sphingolipid metabolism in the lysosomes could partially contribute to the sphingolipid changes observed in UV-C-induced cell death. However, inhibition of aSMase pharmacologically using desipramine or via siRNA-mediated knockdown fails to reproduce the UV-C-induced effects on sphingolipids that we observed.3
In the process of evaluating the role of de novo sphingolipid synthesis in UV-C-induced programmed cell death, we found that Cer accumulated in a multiphasic manner that was defined by sensitivity to both inhibitors of de novo sphingolipid synthesis and inhibitors of MOMP and caspases. Although inhibition of de novo synthesis with myriocin reduced much of the Cer and nearly all of the dHCer generation (Fig. 3, supplemental Fig. S2A, and data not shown), it did not inhibit any aspect of cell death we measured (Figs. 8–11). FB1, on the other hand, inhibited Cer and dHCer generation and greatly protected cells from plasma membrane permeabilization. In regard to sphingolipids, the differences between myriocin and FB1 we observed were on the late generation of Cer and the accumulation of sphingoid bases (Fig. 3 and supplemental Fig. S2, B–D). The latter is unlikely to account for the protective effects as simultaneous treatment with myriocin and FB1, which prevents the elevation in dHSph (52), failed to reverse the effects of FB1 (data not shown). Like Cer, SM and HexCer also increased at a late time point, raising the possibility that these lipids could be controlling membrane permeabilization. It is unlikely that HexCer is contributing to this effect as the glucosylceramide synthase inhibitor 1-phenyl-2-palmitoylamino-3-morpholino-1-propanol does not inhibit UV-C-induced LDH release (data not shown). On the other hand, a role for SM cannot be fully excluded as late SM is also myriocin-insensitive and FB1-sensitive (supplemental Fig. S2E). Overall, there appears to be a late pool of FB1-sensitive, myriocin-insensitive Cer or Cer-derived lipid that is distinct from the larger pool of myriocin-sensitive dHCer/Cer. Although the specific identity of the signaling sphingolipid remains to be determined, it is clear that it is regulating plasma membrane permeabilization and the full activation of caspase-7 (Figs. 8, 10, and 11).
MOMP and caspase activation also regulate late Cer generation. We observed that Bcl-xL overexpression, Bak knockdown, or caspase inhibition resulted in an inhibition of late Cer generation and cell death. However, the effects of these interventions on Cer generation were different both qualitatively and quantitatively. Bcl-xL caused the most inhibition of total Cer generation and had this effect on multiple Cer species (Fig. 5B and supplemental Fig. S3A). Bak siRNA, although exhibiting a strong effect on cell death, had no significant effect on total Cer generation (Fig. 6C); however, it did reduce the late accumulation of medium long-chain Cer species such as C18:0-, C18:1-, C20:0-, and C20:1-ceramide (Fig. 6E, supplemental Fig. S3B, and Table 1). These species were present at relatively low levels in MCF-7 cells (supplemental Fig. S1A) but exhibited some of the highest -fold changes when cells underwent cell death (supplemental Fig. S1B). Inhibition of caspases with the broad spectrum inhibitor Z-VAD-fmk also failed to reduce late total Cer generation significantly (Fig. 7B), but it did have significant effects on medium long-chain Cer (Fig. 7C and supplemental Fig. S3C) although to a lesser extent than Bak knockdown. Whether these effects represent a chain length-specific phenomenon or an abundance-related phenomenon is unclear. For example, the difference between siBak and siControl of C18:0-Cer at 24 h post-UV-C is ∼0.2 pmol/nmol of lipid Pi. Such a mole difference may be occurring with more abundant Cer species (e.g. C16:0-Cer), but it would be well within the standard error measurements of this lipid (∼0.6 pmol/nmol of lipid Pi). The implication of C18:0-Cer in cell death in this model is of note as this specific lipid has been previously linked to proapoptotic pathways in head and neck cancer (47, 49, 53).
Both MOMP-dependent and MOMP-independent Cer generation has been described (54–58). In some situations such as TNF-α- or camptothecin-induced death of MCF-7 cells, partial or complete inhibition of Cer generation by Bcl-2 or Bcl-xL overexpression was observed (55). In other situations, Bcl-xL or Bcl-2 overexpression could not prevent late Cer generation (54, 59). More recently, our laboratory has demonstrated that Bak-deficient cells fail to induce the production of long-chain Cer species (e.g. C16:0 and C18:0 species) in response to several different apoptotic stimuli and have altered CerS activity, suggesting a specific role for Bak in regulating Cer-mediated cell death (60). However, in this study, Bcl-xL overexpression inhibited cell death but failed to inhibit early Cer generation, suggesting that the effect was due to Bak deficiency and not just inhibition of MOMP. It is still unknown whether Bcl-xL overexpression would inhibit Cer generation at later time points in this model of programmed cell death.
According to our data, early Cer generation is neither necessary nor sufficient for cell death. In Bcl-xL-overexpressing, siBak-treated, or Z-VAD-treated cells, Cer accumulated ∼1.6-, 2.1-, and 2.0-fold, respectively, yet these cells failed to exhibit membrane permeabilization. Also, inhibition of this early phase had little effect on membrane permeabilization. These data indicate that Cer accumulation in the first phase is not sufficient to promote membrane permeabilization and that the mitochondrial pathway and caspase activation are necessary. However, the fact that these treatments reduced the late accumulation of Cer indicates MOMP-dependent regulation. Although the effects of Bcl-xL, siBak, and Z-VAD were uniform with regard to cell death, the degree of the effects on Cer generation depended on how far down the apoptotic pathway the intervention was made. This would suggest that Cer accumulation is regulated at multiple levels in the cell death program and may have several mechanisms for each apoptotic stage to contribute an additional stimulus for Cer generation. Indeed, both de novo and salvage pathways contribute to dHCer and Cer accumulation, respectively, and only a portion of these pathways are impacted by inhibition of MOMP. However, our data suggest that only a subpopulation of the Cer that is sensitive to FB1 (and perhaps downstream of MOMP) is actually involved in regulating programmed cell death.
The identification of a postmitochondrial role for CerS-derived Cer suggests a novel role for these enzymes and Cer in regulating the execution phase of apoptosis. The best described events in this phase are the activation of executioner caspases (caspase-3, -6, and -7) and the induction of nuclear condensation and fragmentation (61). Caspase substrates that lead to the morphological changes observed in dying cells include actin-associated proteins (e.g. myosin, gelsolin, filamin, etc.), tubulins, vimentin, and nuclear lamins. Components of the extracellular matrix adhesion machinery are also substrates for cleavage and likely contribute to the detachment and rounding of cells. However, the events leading to plasma membrane permeability in apoptosis are not well defined and are thought to largely involve the loss of oxidative phosphorylation, ATP generation, and osmotic homeostasis (62, 63).
The ability of FB1 to greatly delay onset of cell permeabilization suggests a role for CerS-derived Cer in this process. Cer has been shown to regulate mitochondrial respiration, inner membrane potential, and the ability of cytochrome c to be released from the intermembrane space (64–67). Evidence supports both positive and negative roles for Cer in regulating this latter effect, but the details (including the specific targets of Cer) remain unknown (33, 68). Cer has been shown to form channels in planar membranes and isolated mitochondria large enough to allow passage of solutes and proteins up to 60 kDa (33). Cer channels forming in the plasma membrane of apoptotic cells might directly or indirectly promote permeability to vital dyes and LDH. However, no channels were observed when Cer was added to the plasma membranes of erythrocytes, suggesting that the channel-forming ability of Cer is location-specific (69, 70). Whether Cer channels actually form in mitochondria in vivo or whether they can form in the plasma membrane or other organelles during programmed cell death remains to be demonstrated.
Although mitochondrial membrane permeabilization is widely considered the “point of no return” in programmed cell death, there may be opportunities for therapeutic intervention downstream of this event (71). Our data support the hypothesis that CerS-derived Cer is a key regulator in the postmitochondrial phase of apoptosis. Of note, FB1 has recently been shown to be protective in several in vivo models of organ damage including radiation-induced intestinal damage, splanchnic ischemia-reperfusion injury, spinal cord injury, and multiple organ failure (72–75). Prevention of secondary necrosis in response to injury could potentially allow apoptotic cells to be cleared before cell lysis occurs (71). This could in turn lead to reduced inflammation and secondary tissue injury and be of significant therapeutic benefit in many diseases.
The detailed mechanism of Cer accumulation is still incompletely understood. One of our interesting findings was that UV-C induced the incorporation of 17C-Sph into C16:0-Cer, but in vitro C16:0-CerS activity remained unchanged (Fig. 4, A and B). There are many possible explanations for this discrepancy. First, in vivo metabolism of exogenous Sph may not necessarily occur directly through CerS in the same way that 17C-Sph and palmitoyl-CoA are metabolized in vitro. UV-C could also regulate the uptake or delivery of 17C-Sph to CerS in cells; however, we found 17C-Sph levels in cells to be no different between treated and untreated groups (data not shown). Second, there may be a cofactor or regulator of CerS activity that is lost in the preparation of whole cell lysates or microsomes, and this factor is necessary for UV-C to increase CerS activity in vivo. Third, one or more enzymes that metabolize CerS-derived Cer could be inhibited by UV-C. These could include SM synthases, HexCer synthases, Cer kinases, and ceramidases. Down-regulation of one or more of these enzymes might lead to the accumulation of both dHCer and Cer, but it is unclear which enzyme losses would cause the additional accumulation of SM and HexCer species (Fig. 2, C and D) and whether these changes affect cell death.
Another question we addressed was that of the identity(ies) of the FB1-sensitive CerS involved in postmitochondrial regulation of membrane permeabilization. Using siRNA-mediated knockdown of CerS, it appears that no individual CerS can account for the full regulation of plasma membrane permeabilization; however, combined knockdown of CerS5 and CerS6 reduced permeabilization significantly, supporting a role for these enzymes and their products (i.e. C14:0- and C16:0-Cer in regulating late programmed cell death (Fig. 13)). However, we cannot fully exclude a role for CerS1 or CerS2 in regulating membrane permeabilization as individual knockdown of these proteins showed a trend toward inhibition of LDH release at base line and following UV treatment (Fig. 12C).
It is important to emphasize that the Cer changes seen with CerS knockdowns reflect effects on both de novo and salvage pathways, but our data suggest that only the salvage pathway is regulating plasma membrane permeabilization. Although it appears that CerS5 and CerS6 are controlling permeabilization through maintaining cellular C14:0- and C16:0-Cer levels, it is likely that only long-chain Cer produced via CerS5/6-mediated salvage is contributing to this process. The roles of CerS in regulating cell death may be found to be somewhat independent of its regulation of total Cer levels. For example, CerS2 knockdown increases C16:0-Cer levels basally and in response to irradiation (Fig. 12B and supplemental Table S1). However, this increase clearly does not lead to enhanced plasma membrane permeabilization (Fig. 12C). Hence, there is not a clear one-to-one relationship of the total cellular level of these lipids to the biological outcome. Rather, it is likely a subset of Cer in a particular subcellular location that will account for these effects. Characterization of this subpopulation of Cer will certainly be the goal of future study.
In summary, we have identified a CerS-dependent pool of Cer that is specifically regulating postmitochondrial events in programmed cell death that lead to plasma membrane permeabilization. These data support the hypothesis that the sphingolipid signaling is highly defined by the enzymatic source of lipid (e.g. Cer) and the subcellular localization of its accumulation (76). Also, this study provides a new framework in which to study CerS- and Cer-mediated programmed cell death. Understanding these pathways could lead to identification of novel Cer targets and potentially expand the opportunities for sphingolipid-based therapeutic intervention.
Supplementary Material
This work was supported, in whole or in part, by National Institutes of Health Grant 5T32ES012878 from the NIEHS (through the Medical University of South Carolina (MUSC) Department of Pharmaceutical Sciences training program in environmental stress signaling) and Ruth L. Kirschstein National Research Service Award 1 F30 ES016975-01 from the NIEHS (to T. D. M.), Grant R01 AG016583 (to L. M. O.), Grant P01 CA097132 from the NCI (to Y. A. H.), Medical Scientist Training Program Grant GM08716 (to R. W. J.), and Grant C06 RR018823 from the Extramural Research Facilities Program of the National Center for Research Resources (for the HPLC/MS analysis at the MUSC Lipidomics Core Facility). This work was also supported by American Heart Association Predoctoral Fellowship 081509E (to R. W. J.) and in part by a Method to Extend Research in Time award (to L. M. O.) from the Office of Research and Development, Department of Veterans Affairs, Ralph H. Johnson Veterans Affairs Medical Center, Charleston, SC.

The on-line version of this article (available at http://www.jbc.org) contains supplemental Tables S1 and S2 and Figs. S1–S4.
T. D. Mullen and L. M. Obeid, unpublished observations.
- MOMP
- mitochondrial outer membrane permeabilization
- Cer
- ceramide
- dHCer
- dihydroceramide
- dHSph
- dihydrosphingosine
- FB1
- fumonisin B1
- HexCer
- hexosylceramide
- LDH
- lactate dehydrogenase
- LacCer
- lactosylceramide
- SM
- sphingomyelin
- SMase
- sphingomyelinase
- Sph
- sphingosine
- UV-C
- ultraviolet light-C
- fmk
- fluoromethyl ketone
- TRITC
- tetramethylrhodamine isothiocyanate
- 17C-Sph
- 17-carbon sphingosine
- aSMase
- acid SMase
- nSMase
- neutral SMase
- ANOVA
- analysis of variance
- Z
- benzyloxycarbonyl.
REFERENCES
- 1. Kroemer G., Galluzzi L., Vandenabeele P., Abrams J., Alnemri E. S., Baehrecke E. H., Blagosklonny M. V., El-Deiry W. S., Golstein P., Green D. R., Hengartner M., Knight R. A., Kumar S., Lipton S. A., Malorni W., Nuñez G., Peter M. E., Tschopp J., Yuan J., Piacentini M., Zhivotovsky B., Melino G. (2009) Cell Death Differ. 16, 3–11 [DOI] [PMC free article] [PubMed] [Google Scholar]
- 2. Adams J. M., Cory S. (2007) Oncogene 26, 1324–1337 [DOI] [PMC free article] [PubMed] [Google Scholar]
- 3. Schuler M., Green D. R. (2001) Biochem. Soc. Trans. 29, 684–688 [DOI] [PubMed] [Google Scholar]
- 4. Cartron P. F., Gallenne T., Bougras G., Gautier F., Manero F., Vusio P., Meflah K., Vallette F. M., Juin P. (2004) Mol. Cell 16, 807–818 [DOI] [PubMed] [Google Scholar]
- 5. Oda E., Ohki R., Murasawa H., Nemoto J., Shibue T., Yamashita T., Tokino T., Taniguchi T., Tanaka N. (2000) Science 288, 1053–1058 [DOI] [PubMed] [Google Scholar]
- 6. Wei M. C., Zong W. X., Cheng E. H., Lindsten T., Panoutsakopoulou V., Ross A. J., Roth K. A., MacGregor G. R., Thompson C. B., Korsmeyer S. J. (2001) Science 292, 727–730 [DOI] [PMC free article] [PubMed] [Google Scholar]
- 7. Lindsten T., Ross A. J., King A., Zong W. X., Rathmell J. C., Shiels H. A., Ulrich E., Waymire K. G., Mahar P., Frauwirth K., Chen Y., Wei M., Eng V. M., Adelman D. M., Simon M. C., Ma A., Golden J. A., Evan G., Korsmeyer S. J., MacGregor G. R., Thompson C. B. (2000) Mol. Cell 6, 1389–1399 [DOI] [PMC free article] [PubMed] [Google Scholar]
- 8. Pettus B. J., Chalfant C. E., Hannun Y. A. (2002) Biochim. Biophys. Acta 1585, 114–125 [DOI] [PubMed] [Google Scholar]
- 9. Taha T. A., Mullen T. D., Obeid L. M. (2006) Biochim. Biophys. Acta 1758, 2027–2036 [DOI] [PMC free article] [PubMed] [Google Scholar]
- 10. Bose R., Verheij M., Haimovitz-Friedman A., Scotto K., Fuks Z., Kolesnick R. (1995) Cell 82, 405–414 [DOI] [PubMed] [Google Scholar]
- 11. Dbaibo G. S., Pushkareva M. Y., Rachid R. A., Alter N., Smyth M. J., Obeid L. M., Hannun Y. A. (1998) J. Clin. Investig. 102, 329–339 [DOI] [PMC free article] [PubMed] [Google Scholar]
- 12. Haimovitz-Friedman A., Kan C. C., Ehleiter D., Persaud R. S., McLoughlin M., Fuks Z., Kolesnick R. N. (1994) J. Exp. Med. 180, 525–535 [DOI] [PMC free article] [PubMed] [Google Scholar]
- 13. Gamard C. J., Dbaibo G. S., Liu B., Obeid L. M., Hannun Y. A. (1997) J. Biol. Chem. 272, 16474–16481 [DOI] [PubMed] [Google Scholar]
- 14. Dbaibo G. S., El-Assaad W., Krikorian A., Liu B., Diab K., Idriss N. Z., El-Sabban M., Driscoll T. A., Perry D. K., Hannun Y. A. (2001) FEBS Lett. 503, 7–12 [DOI] [PubMed] [Google Scholar]
- 15. Santana P., Peña L. A., Haimovitz-Friedman A., Martin S., Green D., McLoughlin M., Cordon-Cardo C., Schuchman E. H., Fuks Z., Kolesnick R. (1996) Cell 86, 189–199 [DOI] [PubMed] [Google Scholar]
- 16. Deng X., Yin X., Allan R., Lu D. D., Maurer C. W., Haimovitz-Friedman A., Fuks Z., Shaham S., Kolesnick R. (2008) Science 322, 110–115 [DOI] [PMC free article] [PubMed] [Google Scholar]
- 17. Menuz V., Howell K. S., Gentina S., Epstein S., Riezman I., Fornallaz-Mulhauser M., Hengartner M. O., Gomez M., Riezman H., Martinou J. C. (2009) Science 324, 381–384 [DOI] [PubMed] [Google Scholar]
- 18. Obeid L. M., Linardic C. M., Karolak L. A., Hannun Y. A. (1993) Science 259, 1769–1771 [DOI] [PubMed] [Google Scholar]
- 19. Novgorodov S. A., Szulc Z. M., Luberto C., Jones J. A., Bielawski J., Bielawska A., Hannun Y. A., Obeid L. M. (2005) J. Biol. Chem. 280, 16096–16105 [DOI] [PubMed] [Google Scholar]
- 20. Gouaze-Andersson V., Cabot M. C. (2006) Biochim. Biophys. Acta 1758, 2096–2103 [DOI] [PubMed] [Google Scholar]
- 21. Uchida Y., Nardo A. D., Collins V., Elias P. M., Holleran W. M. (2003) J. Invest. Dermatol. 120, 662–669 [DOI] [PubMed] [Google Scholar]
- 22. Cifone M. G., De Maria R., Roncaioli P., Rippo M. R., Azuma M., Lanier L. L., Santoni A., Testi R. (1994) J. Exp. Med. 180, 1547–1552 [DOI] [PMC free article] [PubMed] [Google Scholar]
- 23. Smith E. L., Schuchman E. H. (2008) FASEB J. 22, 3419–3431 [DOI] [PMC free article] [PubMed] [Google Scholar]
- 24. Clarke C. J., Hannun Y. A. (2006) Biochim. Biophys. Acta 1758, 1893–1901 [DOI] [PubMed] [Google Scholar]
- 25. Andrieu-Abadie N., Levade T. (2002) Biochim. Biophys. Acta 1585, 126–134 [DOI] [PubMed] [Google Scholar]
- 26. Taha T. A., Osta W., Kozhaya L., Bielawski J., Johnson K. R., Gillanders W. E., Dbaibo G. S., Hannun Y. A., Obeid L. M. (2004) J. Biol. Chem. 279, 20546–20554 [DOI] [PubMed] [Google Scholar]
- 27. Jin J., Hou Q., Mullen T. D., Zeidan Y. H., Bielawski J., Kraveka J. M., Bielawska A., Obeid L. M., Hannun Y. A., Hsu Y. T. (2008) J. Biol. Chem. 283, 26509–26517 [DOI] [PMC free article] [PubMed] [Google Scholar]
- 28. Jin J., Mullen T. D., Hou Q., Bielawski J., Bielawska A., Zhang X., Obeid L. M., Hannun Y. A., Hsu Y. T. (2009) J. Lipid Res. 50, 2389–2397 [DOI] [PMC free article] [PubMed] [Google Scholar]
- 29. Gamen S., Anel A., Piñeiro A., Naval J. (1998) Cell Death Differ. 5, 241–249 [DOI] [PubMed] [Google Scholar]
- 30. Kroesen B. J., Pettus B., Luberto C., Busman M., Sietsma H., de Leij L., Hannun Y. A. (2001) J. Biol. Chem. 276, 13606–13614 [DOI] [PubMed] [Google Scholar]
- 31. Perry D. K., Carton J., Shah A. K., Meredith F., Uhlinger D. J., Hannun Y. A. (2000) J. Biol. Chem. 275, 9078–9084 [DOI] [PubMed] [Google Scholar]
- 32. Birbes H., Luberto C., Hsu Y. T., El Bawab S., Hannun Y. A., Obeid L. M. (2005) Biochem. J. 386, 445–451 [DOI] [PMC free article] [PubMed] [Google Scholar]
- 33. Siskind L. J., Kolesnick R. N., Colombini M. (2002) J. Biol. Chem. 277, 26796–26803 [DOI] [PMC free article] [PubMed] [Google Scholar]
- 34. Kashkar H., Wiegmann K., Yazdanpanah B., Haubert D., Krönke M. (2005) J. Biol. Chem. 280, 20804–20813 [DOI] [PubMed] [Google Scholar]
- 35. Hsu Y. T., Youle R. J. (1997) J. Biol. Chem. 272, 13829–13834 [DOI] [PubMed] [Google Scholar]
- 36. Griffiths G. J., Dubrez L., Morgan C. P., Jones N. A., Whitehouse J., Corfe B. M., Dive C., Hickman J. A. (1999) J. Cell Biol. 144, 903–914 [DOI] [PMC free article] [PubMed] [Google Scholar]
- 37. Bielawski J., Szulc Z. M., Hannun Y. A., Bielawska A. (2006) Methods 39, 82–91 [DOI] [PubMed] [Google Scholar]
- 38. Van Veldhoven P. P., Bell R. M. (1988) Biochim. Biophys. Acta 959, 185–196 [DOI] [PubMed] [Google Scholar]
- 39. Spassieva S., Bielawski J., Anelli V., Obeid L. M. (2007) Methods Enzymol. 434, 233–241 [DOI] [PubMed] [Google Scholar]
- 40. Spassieva S., Seo J. G., Jiang J. C., Bielawski J., Alvarez-Vasquez F., Jazwinski S. M., Hannun Y. A., Obeid L. M. (2006) J. Biol. Chem. 281, 33931–33938 [DOI] [PubMed] [Google Scholar]
- 41. Jenkins R. W., Canals D., Idkowiak-Baldys J., Simbari F., Roddy P., Perry D. M., Kitatani K., Luberto C., Hannun Y. A. (2010) J. Biol. Chem. 285, 35706–35718 [DOI] [PMC free article] [PubMed] [Google Scholar]
- 42. Marchesini N., Luberto C., Hannun Y. A. (2003) J. Biol. Chem. 278, 13775–13783 [DOI] [PubMed] [Google Scholar]
- 43. Jänicke R. U., Sprengart M. L., Wati M. R., Porter A. G. (1998) J. Biol. Chem. 273, 9357–9360 [DOI] [PubMed] [Google Scholar]
- 44. Charruyer A., Grazide S., Bezombes C., Müller S., Laurent G., Jaffrézou J. P. (2005) J. Biol. Chem. 280, 19196–19204 [DOI] [PubMed] [Google Scholar]
- 45. Zeidan Y. H., Wu B. X., Jenkins R. W., Obeid L. M., Hannun Y. A. (2008) FASEB J. 22, 183–193 [DOI] [PubMed] [Google Scholar]
- 46. Mullen T. D., Spassieva S., Jenkins R. W., Kitatani K., Bielawski J., Hannun Y. A., Obeid L. M. (2011) J. Lipid Res. 52, 68–77 [DOI] [PMC free article] [PubMed] [Google Scholar]
- 47. Senkal C. E., Ponnusamy S., Rossi M. J., Bialewski J., Sinha D., Jiang J. C., Jazwinski S. M., Hannun Y. A., Ogretmen B. (2007) Mol. Cancer Ther. 6, 712–722 [DOI] [PubMed] [Google Scholar]
- 48. Senkal C. E., Ponnusamy S., Bielawski J., Hannun Y. A., Ogretmen B. (2010) FASEB J. 24, 296–308 [DOI] [PMC free article] [PubMed] [Google Scholar]
- 49. Baran Y., Salas A., Senkal C. E., Gunduz U., Bielawski J., Obeid L. M., Ogretmen B. (2007) J. Biol. Chem. 282, 10922–10934 [DOI] [PubMed] [Google Scholar]
- 50. White-Gilbertson S., Mullen T., Senkal C., Lu P., Ogretmen B., Obeid L., Voelkel-Johnson C. (2009) Oncogene 28, 1132–1141 [DOI] [PMC free article] [PubMed] [Google Scholar]
- 51. Oberle C., Huai J., Reinheckel T., Tacke M., Rassner M., Ekert P. G., Buellesbach J., Borner C. (2010) Cell Death Differ. 17, 1167–1178 [DOI] [PubMed] [Google Scholar]
- 52. Enongene E. N., Sharma R. P., Bhandari N., Miller J. D., Meredith F. I., Voss K. A., Riley R. T. (2002) Toxicol. Sci. 67, 173–181 [DOI] [PubMed] [Google Scholar]
- 53. Koybasi S., Senkal C. E., Sundararaj K., Spassieva S., Bielawski J., Osta W., Day T. A., Jiang J. C., Jazwinski S. M., Hannun Y. A., Obeid L. M., Ogretmen B. (2004) J. Biol. Chem. 279, 44311–44319 [DOI] [PubMed] [Google Scholar]
- 54. Zhang J., Alter N., Reed J. C., Borner C., Obeid L. M., Hannun Y. A. (1996) Proc. Natl. Acad. Sci. U.S.A. 93, 5325–5328 [DOI] [PMC free article] [PubMed] [Google Scholar]
- 55. El-Assaad W., El-Sabban M., Awaraji C., Abboushi N., Dbaibo G. S. (1998) Biochem. J. 336, 735–741 [DOI] [PMC free article] [PubMed] [Google Scholar]
- 56. Okamoto Y., Obeid L. M., Hannun Y. A. (2002) FEBS Lett. 530, 104–108 [DOI] [PubMed] [Google Scholar]
- 57. Tepper A. D., de Vries E., van Blitterswijk W. J., Borst J. (1999) J. Clin. Investig. 103, 971–978 [DOI] [PMC free article] [PubMed] [Google Scholar]
- 58. Sawada M., Nakashima S., Banno Y., Yamakawa H., Hayashi K., Takenaka K., Nishimura Y., Sakai N., Nozawa Y. (2000) Cell Death Differ. 7, 761–772 [DOI] [PubMed] [Google Scholar]
- 59. Wiesner D. A., Kilkus J. P., Gottschalk A. R., Quintáns J., Dawson G. (1997) J. Biol. Chem. 272, 9868–9876 [DOI] [PubMed] [Google Scholar]
- 60. Siskind L. J., Mullen T. D., Romero Rosales K., Clarke C. J., Hernandez-Corbacho M. J., Edinger A. L., Obeid L. M. (2010) J. Biol. Chem. 285, 11818–11826 [DOI] [PMC free article] [PubMed] [Google Scholar]
- 61. Taylor R. C., Cullen S. P., Martin S. J. (2008) Nat. Rev. Mol. Cell Biol. 9, 231–241 [DOI] [PubMed] [Google Scholar]
- 62. Ricci J. E., Muñoz-Pinedo C., Fitzgerald P., Bailly-Maitre B., Perkins G. A., Yadava N., Scheffler I. E., Ellisman M. H., Green D. R. (2004) Cell 117, 773–786 [DOI] [PubMed] [Google Scholar]
- 63. Lemasters J. J. (2005) Gastroenterology 129, 351–360 [DOI] [PubMed] [Google Scholar]
- 64. Zamzami N., Marchetti P., Castedo M., Decaudin D., Macho A., Hirsch T., Susin S. A., Petit P. X., Mignotte B., Kroemer G. (1995) J. Exp. Med. 182, 367–377 [DOI] [PMC free article] [PubMed] [Google Scholar]
- 65. Di Paola M., Cocco T., Lorusso M. (2000) Biochemistry 39, 6660–6668 [DOI] [PubMed] [Google Scholar]
- 66. Siskind L. J. (2005) J. Bioenerg. Biomembr. 37, 143–153 [DOI] [PMC free article] [PubMed] [Google Scholar]
- 67. Gudz T. I., Tserng K. Y., Hoppel C. L. (1997) J. Biol. Chem. 272, 24154–24158 [DOI] [PubMed] [Google Scholar]
- 68. Novgorodov S. A., Gudz T. I., Obeid L. M. (2008) J. Biol. Chem. 283, 24707–24717 [DOI] [PMC free article] [PubMed] [Google Scholar]
- 69. Siskind L. J., Colombini M. (2000) J. Biol. Chem. 275, 38640–38644 [DOI] [PMC free article] [PubMed] [Google Scholar]
- 70. Siskind L. J., Kolesnick R. N., Colombini M. (2006) Mitochondrion 6, 118–125 [DOI] [PMC free article] [PubMed] [Google Scholar]
- 71. Galluzzi L., Morselli E., Kepp O., Kroemer G. (2009) Biochim. Biophys. Acta 1787, 402–413 [DOI] [PubMed] [Google Scholar]
- 72. Ch'ang H. J., Maj J. G., Paris F., Xing H. R., Zhang J., Truman J. P., Cardon-Cardo C., Haimovitz-Friedman A., Kolesnick R., Fuks Z. (2005) Nat. Med. 11, 484–490 [DOI] [PubMed] [Google Scholar]
- 73. Cuzzocrea S., Di Paola R., Genovese T., Mazzon E., Esposito E., Crisafulli C., Bramanti P., Salvemini D. (2008) J. Pharmacol. Exp. Ther. 327, 45–57 [DOI] [PubMed] [Google Scholar]
- 74. Cuzzocrea S., Deigner H. P., Genovese T., Mazzon E., Esposito E., Crisafulli C., Di Paola R., Bramanti P., Matuschak G., Salvemini D. (2009) Shock 31, 634–644 [DOI] [PubMed] [Google Scholar]
- 75. Cuzzocrea S., Genovese T., Mazzon E., Esposito E., Crisafulli C., Di Paola R., Bramanti P., Salvemini D. (2009) Shock 31, 170–177 [DOI] [PubMed] [Google Scholar]
- 76. Hannun Y. A., Obeid L. M. (2008) Nat. Rev. Mol. Cell Biol. 9, 139–150 [DOI] [PubMed] [Google Scholar]
Associated Data
This section collects any data citations, data availability statements, or supplementary materials included in this article.


