

Abstract
The release of hormones from thyroxine-binding globulin (TBG) and corticosteroid-binding globulin (CBG) is regulated by movement of the reactive center loop in and out of the β-sheet A of the molecule. To investigate how these changes are transmitted to the hormone-binding site, we developed a sensitive assay using a synthesized thyroxine fluorophore and solved the crystal structures of reactive loop cleaved TBG together with its complexes with thyroxine, the thyroxine fluorophores, furosemide, and mefenamic acid. Cleavage of the reactive loop results in its complete insertion into the β-sheet A and a substantial but incomplete decrease in binding affinity in both TBG and CBG. We show here that the direct interaction between residue Thr342 of the reactive loop and Tyr241 of the hormone binding site contributes to thyroxine binding and release following reactive loop insertion. However, a much larger effect occurs allosterically due to stretching of the connecting loop to the top of the D helix (hD), as confirmed in TBG with shortening of the loop by three residues, making it insensitive to the S-to-R transition. The transmission of the changes in the hD loop to the binding pocket is seen to involve coherent movements in the s2/3B loop linked to the hD loop by Lys243, which is, in turn, linked to the s4/5B loop, flanking the thyroxine-binding site, by Arg378. Overall, the coordinated movements of the reactive loop, hD, and the hormone binding site allow the allosteric regulation of hormone release, as with the modulation demonstrated here in response to changes in temperature.
Keywords: Crystal Structure, Fluorescence, Hormones, Protein Drug Interactions, Serpin, Steroid Hormone, Cortisol, Fluorescein, Thyroxine
Introduction
Thyroxine (tetraiodothyronine; T4)2 controls the rate of metabolism and the corticosteroid hormones regulate the inflammatory response in humans. They are carried predominantly in the blood and released in the tissues by thyroxine-binding globulin (TBG) and corticosteroid-binding globulin (CBG), respectively. Both proteins are noninhibitory members of the serpin family of serine protease inhibitors (1, 2), and both have adapted the characteristic conformational mechanism of the serpins to allow the release of the carried hormones (3–5). Recent crystallographic studies (see Fig. 1) have shown how the hormones bind similarly to an equivalent pocket on the surface of each of the two binding globulins (6, 7). The crystal structure of a TBG-thyroxine complex indicated how this reversible binding and release could result from a flip-flop change in conformation due to the partial movement of the intact reactive center peptide loop of TBG into and out of the A β-sheet of the molecule (6). An indication as to how this limited movement of the loop could influence the conformation of the hormone binding pocket was provided by the subsequent structures of the native rat CBG-corticosteroid complex (7) and reactive loop-cleaved human CBG (8). In the native CBG structure, the reactive loop is fully exposed, and the peptide loop connecting strand 2 of the β-sheet A to the top of helix D (hD) is in a helical conformation (see Fig. 1A). However, when the reactive center loop is cleaved, CBG undergoes the typical serpin S-to-R transition (8–11), with the insertion of the cleaved reactive loop into the β-sheet A as a middle strand and the unwinding of the connecting loop on top of hD due to the β-sheet A expansion (see Fig. 1C). It was proposed (6–8) that hormone binding and release is controlled through an allosteric mechanism similar to that of the heparin activation of antithrombin, a serpin controlling blood coagulation (12, 13). As illustrated in Fig. 1D (8), the binding globulins can undergo equilibrated shifts between high and low affinity conformations, with the lowest affinity form resulting from the irreversible S-to-R transition, as occurs with gross proteolytic exposure at sites of inflammation (9–11, 14, 15).
FIGURE 1.

The allosteric mechanism of hormone binding and release. Native CBG (A) has a fully exposed reactive center loop (RCL) with a connecting loop on top of helix D (green, arrow) in a helical conformation. This loop is unwound following partial insertion of the reactive loop as seen in the native TBG structure (B) or full insertion into the central β-sheet A in the reactive loop-cleaved CBG structure (C). D, the changes in flexibility of hD resulting from the dynamic flip-flop movement of the reactive loop are transmitted to the hormone binding pocket. I, native CBG, with a reactive loop four residues shorter than that of TBG, crystallizes in the fully exposed loop conformation with a high binding affinity. II, native TBG crystallizes in the partly inserted loop conformation with an intermediate affinity for thyroxine but equilibrates toward frame I with higher affinity when the reactive loop is shortened or toward III with lower affinity when the loop is extended (29). Both native TBG and CBG can equilibrate among these loop-sheet configurations, and the changes in the binding affinity result from the changes of the relative populations of each conformer of different loop-sheet configurations. IV, protease cleavage of the reactive loop results in its incorporation into the central β-sheet A to form, typically irreversibly, a stable relaxed conformation with the lowest binding affinity.
The aims here are to investigate the preceding reversible stages (I–III in Fig. 1D), involving the initial insertion of the reactive loop together with the concerted changes at the top of helix D that result from the expansion of the β-sheet A and to show how these changes are transmitted to the hormone-binding site. To assess the contributions of individual elements of this mechanism to changes in TBG binding affinity, we have developed a sensitive assay using synthesized thyroxine fluorophores. This assay has enabled us to demonstrate the regulatory potential of the allosteric mechanism in TBG as well as CBG, as shown here with the temperature-dependent modulation of hormone release.
EXPERIMENTAL PROCEDURES
Protein Expression and Purification
Recombinant wild-type human TBG (UniProKb accession no. P05543) was prepared as described previously (6). The reactive center loop cleaved TBG was prepared by incubating native TBG with HNE at 200:1 ratio at room temperature for 2 h and purified by a Hitrap-HQ column (Amersham Biosciences Bioscience). A TBG-D3 mutant was engineered with its connecting loop from helix D to strand 2 of the β-sheet A (hDs2A) shortened by three residues by replacement of the four residues 103–106 with a single Ala. Two other mutants were similarly prepared, replacing Lys243, which closely packs with the hDs2A connecting loop, by either Gly (TBG-K243G) or Ala (TBG-K243A). Both the native and cleaved forms of the mutants were assessed for their binding affinities.
To more readily enable the preparation of the relaxed conformer, a segment of the reactive loop of TBG (P10-P1) was substituted with that of antitrypsin Pittsburgh (GAMFLEAIPRSIP) (16), which can be specifically cleaved at Arg by thrombin. This variant, termed TBG-Atl, was used for subsequent crystallization and binding affinity studies with thyroxine and its analogues. A further mutant based on TBG-Atl was also prepared, where Arg378, which interacts with both the thyroxine and the s2/3B loop, was replaced by Gly. All other binding affinities (as in Table 2) and modifications utilized wild-type TBG. Recombinant human CBG was prepared using the SUMO expression system with an N terminus of 11SNHHRGLA…, starting from residue 11 of the mature protein with protocols for expression, purification, and characterization as described previously (8).
TABLE 2.
The binding affinities of TBG towards T4–6-CF (22 °C). The affinity changes, termed as the sensitivity to S-to-R transition, are then compared with that of wild-type TBG.
| Variants | Native (Kd) | Cleaved (Kd) | Affinity changes (sensitivity to S-to-R)a |
|---|---|---|---|
| nm | nm | ||
| TBG-WT | 2.2 ± 0.2 | 12.2 ± 0.4 | × 5.5 (100%) |
| TBG-D3 | 24.9 ± 1.8 | 50.7 ± 3.6 | × 2 (36%) |
| TBG-K243A | 3.0 ± 0.1 | 20.4 ± 1.2 | × 6.8 (123%) |
| TBG-K243G | 7.5 ± 0.2 | 30.4 ± 1.3 | × 4.0 (73%) |
a The responses to the S-to-R transitions of the mutants are compared with that of TBG-WT.
Preparation of l-thyroxine-5- and 6-carboxyfluorescein
Based on previous conjugate formation (17) with the scheme shown below (see Fig. 3A), a ∼1/1 mixture of 5-and 6-carboxyfluorescein (0.5 g and 1.33 mmol) was dissolved at ambient temperature in dry N,N′-dimethylformamide as the reaction solvent (13.3 ml) in a 10-ml round bottom flask with magnetic stirring. N-hydroxysuccinamide (230 mg, 1.99 mmol) and 1-ethyl-3-(3-dimethylaminopropyl)-carbodiimide hydrochloride salt (382 mg, 1.99 mmol) were added successively. After 20 h, the resulting 0.1 m solution of crude activated 5(6)-carboxyfluorescein was used directly for the next step. Coupling of l-thyroxine with activated 5(6)-carboxyfluorescein was carried out in a 10 ml round bottom flask. l-Thyroxine (50 mg, 0.064 mmol) was suspended in dry N,N′-dimethylformamide (0.64 ml) and the 0.1 m solution of crude activated 5(6)-carboxyfluorescein (0.7 ml, 0.07 mmol) was added. N,N-diisopropylethylamine (22 μl, 0.12 mmol) was then added drop-wise to give to a homogeneous orange solution. After 4 h, the solution was cooled in an ice bath and acidified with trifluoroacetic acid (29.6 μl, 0.348 mmol). The solvents were removed in vacuo. The crude mixture was purified by reverse phase HPLC with a C18 column and an isocratic 60/40 mixture of MeCN/H2O (0.1% formic acid) as the mobile phase to afford separately the two fluorophores, l-thyroxine-6-carboxyfluorescein (termed T4–6-CF, 23.4 mg, 0.0206 mmol, bright yellow) and l-thyroxine-5-carboxyfluorescein (termed T4–5-CF, 22.3 mg, 0.0196 mmol, pale yellow). The identities of these two conjugates were confirmed by NMR studies. (l-thyroxine-6-carboxyfluorescein: δH (500 MHz, d6-DMSO): 10.15 (br, 2H, OH), 8.83 (br, 1H, NH), 8.10 (d, 1H, J 8.0), 8.03 (d, 1H, J 8.0), 7.72 (br, 3H), 6.98 (s, 2H), 6.68 (d, 1H, J 2.2), 6.66 (d, 1H, J 2.2), 6.562 (d, 1H, J 8.7), 6.557 (d, 1H, J 8.7), 6.54 (dd, 1H, J 8.7 and 2.2), 6.52 (dd, 1H, J 8.7 and 2.2), 4.46–4.54 (m, 1H), 3.12 (dd, 1H, J 13.2 and 4.1), 2.85 (m, 1H). ESI+ Calc. 1135.7422 [M+H]+, found 1135.7454; l-thyroxine-5-carboxyfluorescein, δH (500 MHz, d6-DMSO): 10.16 (br, 2H, OH), 9.04 (d, 1H, J 9.0, NH), 8.44 (s, 1H), 8.17 (dd, 1H, J 8.0 and 1.4), 7.88 (s, 2H), 7.35 (d, 1H, J 8.0), 7.00 (s, 2H), 6.67 (d, 2H, J 2.2), 6.560 (d, 1H, J 8.6), 6.545 (d, 1H, J 8.6), 6.51 (dd, 1H, J 8.6 and 2.2), 6.505 (dd, 1H, J 8.6 and 2.2), 4.74–4.67 (m, 1H), 3.24 (dd, 1H, J 13.5 and 4.2), 3.00 (dd, 1H, J 13.5 and 10.9). ESI+ Calc. 1135.7422 [M+H]+, found 1135.7433).
FIGURE 3.

Thyroxine fluorophores. A, fluorophores were conjugated to thyroxine through chemical synthesis (as described under “Experimental Procedures”). B, the conjugates have similar basal fluorescence spectra (dashed lines) when excited at 490 nm, which differ however on binding to TBG. TBG binding of T4–6-CF (thick line) results in a near 200% enhancement in fluorescence at 525 nm, whereas binding of T4–5-CF (thin line) results in a 75% decrease in fluorescence signal. C, the binding affinities of native TBG (circles) and reactive loop-cleaved TBG (triangles) were obtained by titrating TBG into solutions of T4–6-CF with fluorescence changes plotted against protein concentrations. The curves were fitted with the quadratic equilibrium binding equation I.
Crystallization and Data Collection
All the crystallization studies were based on the TBG-Atl variant. The reactive loop cleaved TBG (cTBG) was concentrated in 10 mm Tris-HCl, 50 mm NaCl, 1 mm EDTA, pH 7.4, and crystallized in sitting drops containing 1 μl of protein (15 mg/ml) and 1 μl of precipitant solution (20% PEG 3350 with 0.2 m CaCl2 or Na2SO4, pH 5.4) at 23 °C for ∼1 week. To soak in thyroxine or other analogues, cTBG crystals were transferred into the corresponding precipitant solution containing corresponding ligands and soaked for ∼12 h. The crystals were cryoprotected with 15% glycerol and flash-cooled in liquid nitrogen. The data set for cTBG (1.5 Å) was collected at Daresbury Synchroton Radiation Source Station 14.1 and the data set for its complex with thyroxine (2 Å) was collected in-house. The data sets for cTBG soaked with T4–6-F, T4–5-F, mefenamic acid, and furosemide were collected at Diamond Light Source station I02. Data were processed by Mosflm (18) and scaled with Scala (19). The initial structure of cTBG was solved by molecular replacement with Phaser (20) using coordinates of cleaved antitrypsin (Protein Data Bank code 1QMB) (21) as a search model. One copy of cTBG was found for the cTBG and cTBG-thyroxine structures. The models were built in Coot (22) and refined with TLS (translation, liberation, screw motion) parameters in Refmac5 (23). Subsequent structures of cTBG with different ligands were solved similarly using cTBG as the search model. The T4 fluorescein models were built in Sketcher (CCP4 suite) and the coordinates of other thyroxine analogues were from the CCP4 library. T4–5-CF and T4–6-CF were refined with partial occupancy in the structure. Although both T4 fluorescein analogues can be readily modeled and refined in the structures, the electron densities for the fluorescein moiety are weak, indicating greater flexibility in this region of the ligand. All structures were refined with good geometry, and the final refinement statistics are listed in Table 1. The atomic coordinates and structure factors have been deposited in the Protein Data Bank (Table 1). The secondary structure was assigned by the program DSSP (24). The figures were created using the open source program PyMOL using the following coordinates: native human TBG-thyroxine complex (Protein Data Bank code 2CEO), native rat CBG-cortisol complex (Protein Data Bank code 2V6D), and reactive loop cleaved human CBG (Protein Data Bank codes 2VDX and 2VDY).
TABLE 1.
Crystallographic data collection and refinement statistics
| cTBG | cTBG-thyroxine | cTBG-T4–5-CF | cTBG-T4–6-CF | cTBG-mefenamic acid | cTBG-furosemide | |
|---|---|---|---|---|---|---|
| Data collection | ||||||
| Space group | P21212 | P21212 | P21212 | P21212 | P21212 | P21212 |
| Unit-cell parameters (a, b, c (Å); α, β, γ) | 173.14, 42.59, 55.99; 90, 90, 90° | 173.59, 42.16, 55.98; 90, 90, 90° | 174.03, 42.55, 56.22; 90, 90, 90° | 172.69, 42.14, 56.1; 90, 90, 90° | 172.84, 41.63, 56.19; 90, 90, 90° | 172.88, 42.15, 56.19; 90, 90, 90° |
| Solvent content (%) | 48 | 48 | 48 | 48 | 48 | 48 |
| Molecules per asymmetric unit | 1 | 1 | 1 | 1 | 1 | 1 |
| Resolution range | 29.5–1.5 (1.58–1.5) | 23.5–2.03 (2.14–2.03) | 34.41–1.43 (1.51–1.43) | 29.41–1.285 (1.35–1.28) | 21.97–2.09 (2.21–2.09) | 34.58–1.70 (1.79–1.70) |
| Unique reflection | 66,481 (8729) | 26,881 (3407) | 72,973 (5358) | 95,941 (6906) | 24,692 (3137) | 40,382 (1956) |
| Average redundancy | 6.8 (4.5) | 3.3 (3.0) | 3.5 (3.4) | 3.6 (3.6) | 5.2 (3.3) | 3.7 (3.6) |
| Completeness (%) | 98.6 (90.4) | 97.7 (86.5) | 99.2 (99.8) | 96.3 (95.7) | 98.2 (88.5) | 92.6 (71.1) |
| Average I/σ | 28.9 (7.5) | 16.4 (4.9) | 8.5 (2.0) | 9.2 (2.5) | 14.5 (3.3) | 4.3 (1.7) |
| Rmerge | 0.041 (0.222) | 0.056 (0.168) | 0.07 (0.494) | 0.07 (0.637) | 0.091 (0.322) | 0.194 (0.547) |
| Rmeas | 0.048 (0.291) | 0.077 (0.232) | 0.081 (0.585) | 0.081 (0.734) | 0.109 (0.398) | 0.222 (0.628) |
| Refinement statistics | ||||||
| No. of residues | 373 | 368 | 373 | 371 | 372 | 375 |
| No. of refined atoms | 3482 | 3284 | 3360 | 3388 | 3084 | 3323 |
| No. of solvent molecules | 428 | 295 | 298 | 320 | 131 | 282 |
| R value | 0.188 | 0.198 | 0.200 | 0.209 | 0.213 | 0.206 |
| Rfree value | 0.214 | 0.243 | 0.218 | 0.235 | 0.260 | 0.232 |
| r.m.s. bond length (Å)a | 0.010 | 0.009 | 0.008 | 0.006 | 0.011 | 0.008 |
| r.m.s. bond angles | 1.320° | 1.185° | 1.275° | 1.187° | 1.258° | 1.104° |
| Ramachandran plot (favored/outliers, %) | 98.64/0 | 98.64/0 | 99.19/0 | 98.91/0 | 98.1/0 | 98.65/0 |
| Mean B-factor | 18.8 | 21.1 | 21.9 | 17.6 | 32.8 | 20.0 |
| MolProbity scoreb | 96th percentile (n = 4836, 1.50 ± 0.25 Å) | 99th percentile (n = 12,112, 2.04 ± 0.25 Å) | 95th percentile (n = 3404, 1.43 ± 0.25 Å) | 94th percentile (n = 2101, 1.29 ± 0.25 Å) | 98th percentile (n = 11,618, 2.09 ± 0.25 Å) | 98th percentile (n = 9248, 1.70 ± 0.25 Å) |
| PDB code | 2RIV | 2RIW | 2XN7 | 2XN6 | 2XN3 | 2XN5 |
a r.m.s., root mean square; PDB, Protein Data Bank.
b 100th percentile is the best among structures of comparable resolution; 0th percentile is the worst.
Binding Affinities
Fluorescence titration experiments were performed using a LS50B luminescence spectrometer (Perkin-Elmer Life Sciences). For measuring the binding affinities of the CBG conformer to cortisol, aliquots of cortisol were titrated into 0.8 ml, 100 nm of CBG in phosphate-buffered saline containing 0.1% (w/v) PEG 8000 at the desired temperature, with quenching in intrinsic protein fluorescence of CBG monitored at 340 nm with an excitation at 290 nm. The dissociation constant (Kd) of binding was obtained by fitting the changes in fluorescence signal with the concentrations of cortisol using the quadratic equilibrium binding equation.
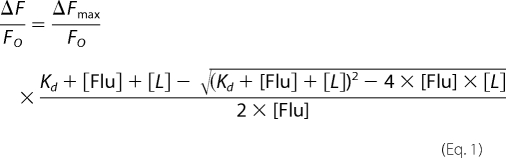 |
In this equation, ΔF represents the change in fluorescence following each addition of ligand (cortisol) from the initial fluorescence FO, and ΔFmax represents the maximal change of fluorescence intensity of CBG. Here, [Flu] = [CBG].
Thyroxine binding studies were performed at defined temperatures in phosphate buffer containing 0.1% (w/v) PEG 8000 and 0.2 mg/ml antitrypsin (which does not bind thyroxine derivatives). TBG stock solution prepared in the same buffer was gradually added into the T4 fluorophore derivative solution (1–2 nm) with fluorescence intensity of T4 fluorophore monitored at 530 nm (excitation wavelength λex = 495 nm) with a cutoff at 515 nm. The slit widths on the excitation and emission side were 2.5 and 15 nm, respectively. The dissociation constant of binding (Kd) was obtained by fitting the changes in fluorescence signal of the individual T4 derivatives with the concentrations of TBG using the binding equation shown above. Due to the detection limitation of the equipment, the fluorescence signal cannot be measured confidently when the concentration of T4 fluoresceins under test is <0.5 nm, which means that Kd values <0.05 nm are likely to be inaccurate (25). Therefore, T4–6-CF, which has a lower binding affinity with TBG, was chosen for subsequent affinity measurements of TBG conformers. The binding affinity of 8-anilino-1-naphthalenesulfonate with TBG was measured similarly with the fluorescence signal of 8-anilino-1-naphthalenesulfonate monitored at 475 nm (λex = 375 nm) following TBG titration.
A competitive assay was used to measure the binding affinity of thyroxine and its analogues, such as mefenamic acid and furosemide. Briefly, aliquots of the analogues were titrated into a mixture of TBG and T4 fluorophore in phosphate buffer containing 0.1% (w/v) PEG 8000, and the changes in fluorescence intensity at 530 nm (λex = 495 nm) with a cutoff at 515 nm was monitored. The dissociation constant of the analog (Ki) was obtained by nonlinear curve fit using Equation 2. (Details of how this equation is derived are shown in the supplemental material.)
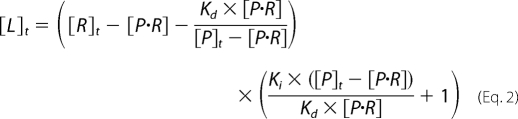 |
All parameters except for [P·R] are constant. R represents the receptor (TBG) of the ligands, P represents probes (T4–6-CF), Kd represents the dissociation constant of P and R binding, Ki represents the dissociation constant of competitive ligand, and [P·R]o represents initial concentration of the complex of receptor and probe. [P·R] is derived from the measured fluorescence changes following addition of competitive ligands,
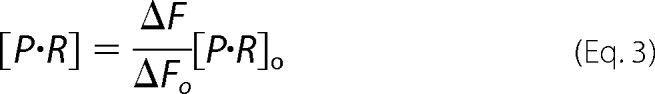 |
where ΔFo represents the initial change in fluorescence when the probe (T4–6-CF) complexes with the receptor (TBG), and ΔF represents the changes of fluorescence following addition of the competitor ligand. All of the Kd measurements are repeated at least three times, and the means ± S.D. are shown in the tables.
RESULTS
Structures of Reactive Loop-cleaved TBG
The crystal structures of cleaved human TBG and its complex with T4 were solved at 1.5 and 2.0 Å resolution, respectively, with good geometry (Table 1). As expected, TBG undergoes the typical overall S-to-R (stressed-to-relaxed) conformational changes observed with inhibitory serpins, with the full incorporation of the exposed reactive loop into the central β-sheet A (Fig. 2). In keeping with observations that the S-to-R transition results in a decrease rather than a complete loss of binding affinity, crystals of cTBG readily formed complexes upon soaking with thyroxine (Fig. 2) with clear electron density for the bound hormone. The binding site of cTBG is substantially unchanged with only small alterations in side chain interactions between thyroxine and cTBG (supplemental Fig. S1A). The thyroxine-binding site lies between helices H and A, with the thyroxine held in place by interactions with principally the side chains of residues in helix H and in the peptide loop of strands 4 and 5 of the underlying β-sheet B. The key residues in this s4/5B loop further form a network of interactions with the preceding loop connecting strands 2 and 3 of the β-sheet B (s2/3B). These key stabilizing interactions of thyroxine are retained in the cleaved TBG including salt-bridges formed by Arg378 and the stacking of Arg381 with the lower aromatic ring of thyroxine (Fig. 2C). Arg378 is further stabilized by a water molecule, which interacts with the main chain carboxyl oxygen atoms of Tyr241 and Ala245. Furthermore, residue Tyr20 of helix A, which is resolved poorly in the native TBG-thyroxine complex structure, is seen in cTBG and its complex with thyroxine to interact with Arg381. This mirrors the cation-π stacking interaction of Arg10 with Trp371 in structures of the CBG-cortisol complex (6–8). Of special note in cTBG is the realignment of the side chains from Tyr20 and Arg381 to allow the binding of thyroxine into the binding pocket with consequent shifting of the N terminus of hA (supplemental Fig. S1).
FIGURE 2.

The thyroxine-binding site. A, the binding site of the native TBG-T4 complex. B, TBG undergoes the typical S-to-R transition with the exposed reactive loop (yellow) on cleavage being fully inserted into the central Aβ-sheet (red). The cleaved form retains the ability to bind thyroxine (in spheres with carbon atoms in gray, oxygen atoms in red, iodine atoms in purple, and nitrogen atoms in blue) in the same binding site as seen in the native TBG-thyroxine complex (supplemental Fig. S1). C, binding is mainly through hydrophobic interactions stabilized by a network of hydrogen bonds surrounding the binding site. The connecting loop on top of hD (in green) interacts with the s2/3B loop (purple) though Lys243. Arg378 of s4/5B loop is stabilized by forming salt bridges with Asp240 of s2/3B and directly with thyroxine (carbon atoms shown in dark gray sticks). Arg378 is further linked to the main chain of s2/3B loop by forming a hydrogen bond with a water molecule (red ball). Salt bridges and hydrogen bonds are shown as black dashed lines.
T4 Fluorophores and Binding Affinities
TBG has a tight binding affinity for T4 (Kd ∼ 0.1 nm) (26) and the binding and release of thyroxine from TBG cannot be monitored readily by direct fluorimetry. Therefore, to fluorimetrically correlate the changes in binding affinity in TBG with its changes in conformation, two fluorescent T4 conjugates were synthesized, l-thyroxine-5-carboxyfluoroscein and l-thyroxine-6-carboxyfluoroscein (designated T4–5-CF and T4–6-CF), with the carboxyl group of fluorescein coupled to the amine group of thyroxine (Fig. 3A). The crystal structures of each of the T4 fluoresceins in complex with cleaved TBG were solved at a resolution of 1.5 and 1.3 Å resolution (Table 1 and supplemental Fig. S1). The structures confirm that binding takes place through their T4 moiety with the same orientation and contacts within the thyroxine-binding pocket as those of unmodified thyroxine (6). As shown in Fig. 3B, the two thyroxine derivatives have a similar basal fluorescent emission when excited at 490 nm. However, they have different fluorescent characteristics on binding of TBG. The binding of TBG with T4–6-CF results in a ∼200% enhancement of the fluorescence, whereas the binding of TBG with T4–5-CF results in a ∼75% decrease in fluorescent intensity. The binding affinities of the T4-fluorophores with TBG were determined by fluorescent titration at 22 °C, with the gradual addition of TBG to solutions of the T4 derivatives. TBG binds T4–6-CF with a dissociation constant of 2.2 nm (Fig. 3C), whereas TBG binds T4–5-CF very tightly with a Kd estimated less than 0.1 nm. Hence, T4–6-CF, with a lower binding affinity allowing convenient fluorescence measurement, was used to assess and correlate changes in affinity with changes in conformation. Notably, the reactive loop cleaved wild-type TBG was shown to bind T4–6-CF with a Kd of 12.2 nm, indicating a 5.5-fold increase compared with the native form (Fig. 3C). Confirmation of the relevance and validity of this approach came from the measurement of the binding affinity of TBG toward T4 by a competitive assay with the T4 fluorophore. Although the measurement error is relatively large for the Kd of native TBG (∼0.04 nm) at 22 °C due to the tightness of the binding and the limitation in detecting small fluorescence signal changes, a similar 5-fold change in T4 binding affinity with cleaved TBG (Kd = 0.2 nm) was observed. Further confirmation of the direct relevance of the T4–6-CF fluorophore came from its use to competitively determine the larger, and hence more accurately measured, Kd of T4 with TBG at 37 °C. The Kd value of 0.075 nm obtained here is in good agreement with literature values (27).
Role of Helix D and Its interactions with Hormone-binding Site
Our previous structural studies of cleaved CBG showed that the expansion of β-sheet A resulted in a lengthening of the peptide loop connecting it to the top of helix D (hDs2A), with the extension being provided by a partial unwinding of the helix. The structures indicated that the transmission of changes on the unwinding of helix D to the hormone-binding site in cleaved CBG are due to the extended connecting loop bending toward and interacting with the edge of the binding site. In the structure of native TBG, however, the reactive loop is already partially inserted and, consequently, no significant change takes in the connecting loop of TBG upon cleavage (supplemental Fig. S1). To test whether the induced extension of the connecting loop from the top of helix D also mediates hormone release in TBG, we engineered a TBG mutant with three residues deleted from the connecting loop. This mutant (TBG-D3) has a considerably increased Kd of 25 nm as compared with the Kd of wild-type TBG of 2.2 nm and greater than that of cleaved wild-type TBG at 12.2 nm. This indicates that residues of this whole connecting loop, including residues 104–106, influence the hormone-binding site, most likely through interacting with the neighboring connecting loop of s2/3B. Cleavage of the reactive loop of the TBG-D3 mutant increases its Kd to 50.7 nm. This is only a 2-fold change and proportionately less than the 5.5-fold change observed on cleavage of wild-type TBG, which corresponds to a 64% decrease in its sensitivity to the S-to-R transition of TBG. Together, these findings further support the notion that the connecting loop directly interacts with the hormone-binding site (6) and plays a key role in stabilizing the hormone-binding site. It also confirms that the connecting loop is a key element in transmitting the S-to-R conformational changes of TBG to the hormone-binding site.
The detailed interactions between the extended helix D connecting loop (hDs2A) and the binding site are seen in Fig. 2C. There is little interaction between the D helix itself and the adjacent loop of s4/5B that forms one flank of the binding site. Instead, the potential linkage of the hDs2A loop to the thyroxine-binding site is seen to be indirect, through its interaction with the loop linking s2B and 3B, which is in turn linked to the flanking s4/5B loop. Notably, in the TBG structures, the extended connecting loop from helix D is in close contact with Lys243, a conserved residue in the s2/3B loop in TBGs of various species. The long side chain of Lys243 is bent, with its γ-carbon pushed away from the connecting loop. Evidence of the critical contribution of this linkage is seen with the loss of affinity and increase in Kd from 2.2 nm to 3.1 and 7.5 nm on replacement of Lys243 by the shorter side chains of Ala and Gly, respectively. More marked changes in affinity are observed with their cleaved forms (Table 2), with the Ala mutant being of lower binding affinity but slightly more efficient in hormone release (∼20% increase) and with the Gly mutation resulting in lower binding affinity and inefficient hormone release following the S-to-R transition of TBG (with a 27% decrease in hormone release) compared with the wild-type. Together, these results confirm the sensitivity of the linked transmission of changes in the helix D connecting loop to the thyroxine-binding site. Interestingly, these changes have been mirrored in a recently identified natural variant of CBG where the replacement of the homologous residue, Gly237 in CBG, by a Val results in a drastic decrease in affinity (28). The bulkier side chain of Val will predictably affect the packing between the hDs2A loop and s2/3B loop with a consequent perturbation of the hormone-binding site. Overall, the structural and functional findings show that the loop on top of hD together with the s2/3B loop are integral parts of the hormone-binding site.
Binding of T4 Analogues to TBG and Their Sensitivities to S-to-R Transition
Further evidence showing how the changes of hD affect the binding affinity of thyroxine comes from the study of the binding by TBG of thyroxine analogues. The modified TBG, TBG-Atl, was selected for this study as its cleaved form can be readily prepared and crystallized. It has a similarly decreased hormone binding affinity following the S-to-R conformational changes to that of the wild-type TBG (as in Table 2). It appears that this variant is a more efficient thyroxine carrier than the wild-type with its native form having a higher T4–6-CF binding affinity than that of wild-type, whereas its cleaved form has lower binding affinity. It is likely that replacement of the reactive loop affects the flip-flop movement of the reactive loop and subsequent packing of β-sheet A following reactive loop insertion. This is consistent with previous findings that changes in the reactive loop affect hormone binding affinity (29, 30).
The binding affinities of four thyroxine analogues with TBG-Atl conformers were measured using a competitive assay involving the fluorophore T4–6-CF (Fig. 4) as described under “Experimental Procedures,” and with the affinity of a fifth analogue, 8-anilino-1-naphthalenesulfonate, being measured by direct fluorescent titration. In general, the analogues bound native TBG-Atl with Kd in the range of 89–304 nm and bound the reactive loop cleaved TBG-Atl with Kd in the μm range (Table 3). However, the analogues differed in their sensitivities to the S-to-R changes in TBG. This was especially so with furosemide, which binds the native form with a Kd of 123 nm and binds the cleaved form with a Kd of 205 nm. This represents only a 1.7-fold change in the Kd of furosemide following reactive loop cleavage of TBG, whereas the binding of T4–6-CF or mefenamic acid experiences a change of >13-fold. To understand the structural basis of the difference in sensitivity of these ligands toward the S-to-R transition of TBG, the crystal structures of furosemide and mefenamic acid complexed with reactive loop cleaved TBG were solved at 1.7 and 2 Å resolution, respectively (Table 1). The electron density of the two ligands allowed their unequivocal placement in the binding pocket, with binding seen to occur mainly through hydrophobic interactions with residues lining the pocket (Fig. 4). Furosemide forms a network of four hydrogen bonds with surrounding residues, whereas mefenamic acid forms two, and the binding of both ligands also involves similar π-stackings of their aromatic rings with the side chain of Arg381 and that of Tyr20, as seen in the cTBG-thyroxine structure. However, there are major differences in the binding of the two ligands. Whereas the upper ring of mefenamic acid, as with that of thyroxine, forms a direct ionic interaction with the side chain of Arg378, furosemide with a smaller upper ring has no direct interaction with Arg378. It is also evident from overlays of the structures that the binding pocket of TBG enclosing furosemide is slightly smaller than those enclosing thyroxine and mefenamic acid. Thus, for a ligand to be sensitive to the contraction of the hormone binding pocket that constitutes the release mechanism, it must be optimally sized and must also form interactions with the moving part of the binding site, as shown here with the side chain of Arg378.
FIGURE 4.

Binding of T4 analogues to TBG. The binding affinities of furosemide (A) or mefenamic acid (B) toward TBG conformers were measured by competitive assay with titration of the analogues into a TBG/T4–6-CF mixed solution with the fluorescence signal monitored and fitted using the competitive binding equations II and III. The fitted curves are shown in blue (cTBG) or green (native TBG). C and D, stereo-view of the binding site of cTBG-furosemide complex (C) and cTBG-mefenamic acid (D). Electron density, contoured at 2.5 times the root mean square of the map for furosemide and 1 root mean square for mefenamic acid, is shown in blue mesh. Key residues are shown in sticks with carbon atoms are shown in green, nitrogen atoms are shown in blue, and oxygen atoms are shown in red. Furosemide (C) forms four hydrogen bonds with surrounding residues, but it has no interaction with Arg378. The side chain of Arg378 is largely solvent exposed with little direct interaction with the binding site. Whereas in the cTBG-mefenamic acid structure (D), Arg378 exiting in alternative conformations, forms ionic interactions with both the ligand and Asp240, similar to that of thyroxine (Fig. 2C). E and F, when these two structures are superimposed with that of cTBG-thyroxine (gray), it is apparent that the furosemide-binding site (E, light blue) is slightly smaller and the side chain of Arg378 shifts away from the s2/3B loop and will thus be insensitive to its shifts. The side chain of Arg378 of the cTBG-mefenamic acid structure (F, green), however, retains a similar position and hence responsiveness to the S-to-R change as that of cTBG-thyroxine.
TABLE 3.
The binding affinities of thyroxine analogues towards native and cleaved TBG-ATL variant (22°C)

The affinities of ANSA were measured by directly titrating conformers of TBG-Atl variant into ANSA solution. The affinities of other compounds were obtained through the competitive assay as described in “Experimental Procedures.”
Apart from forming a direct ionic interaction with thyroxine, the arginine at position 378 on the s4/5B loop is further stabilized by interactions with residues Asp240, Tyr241, and Asp245 of the adjacent s2/3B loop (Fig. 2C). Thus any movement of the s2/3B loop (residues 240–245) will predictably affect the interactions with Arg378, and consequently affect hormone binding. The key contribution of Arg378 is confirmed here with the study of the R378G mutant, TBG-Atl-R378G. The substitution of the arginine with glycine results in a nearly 180-fold decrease in the binding affinity of the native conformation with Kd increasing from 1.6 to 291 nm. Moreover, this mutant is largely insensitive to the S-to-R transition of TBG, with only a 4.8-fold increase in the Kd (1398 nm) of the cleaved form, as comparing to 15.2-fold of the corresponding (nonmutated) TBG-Atl. This represents a 68% decrease in the response of TBG to the S-to-R transition (Table 3). Therefore, Arg378 plays a key role for high affinity binding of thyroxine in the hormone binding site and also its subsequent release.
Direct Linkage between Reactive Loop and Hormone-binding Site
Our preceding crystal structure of intact (uncleaved) TBG-T4 showed the side chain of the reactive loop residue P14 (Thr342) poised for insertion into the β-sheet A but sterically blocked in doing so by the underlying Tyr241 in the s2/3B loop. The spatial rearrangement required on reactive loop entry is seen here in the cleaved TBG-T4 crystal structure (Fig. 5). The full insertion of the side chain of Thr342 requires a rotation of its side chain, resulting in the formation of a direct contact with the protruding OH group of Tyr241. To demonstrate that this rearrangement plays a role in hormone release, a mutant (TBG-Atl-Y241F) with Tyr241 replaced by the smaller Phe was prepared and tested for its binding affinities before and after reactive loop cleavage. The native conformer of this mutant has an increased Kd of 2.6 nm, and the cleaved form has a Kd of 29.7 nm (Table 3), corresponding to a 11-fold change in binding affinity following the S-to-R transition. Therefore, this direct interaction between the reactive loop and the hormone site does contribute to the hormone release (∼25% decrease in sensitivity to the S-to-R transition) but plays a lesser role than shifts in hD in transmitting the S-to-R transitions to the hormone binding site. The significant (∼60%) decrease in affinity of intact TBG-Atl-Y241F (Kd = 2.6 nm) as compared with the corresponding TBG-Atl (Kd = 1.6 nm) and smaller changes in the cleaved forms (from 24.4 to 29.7 nm) indicate that the conserved Tyr241 plays a role in sterically impeding the further insertion of the P14 residue and hence in fine-tuning the binding affinity of the native conformation. Mutation of this residue with a Phe favors further insertion of the reactive loop into the β-sheet A and tips the equilibrium from stage II to III of Fig. 1D resulting in the lower binding affinity of the native conformer.
FIGURE 5.

The direct interactions between the reactive loop and the hormone-binding site in stereo. A, in the native TBG-T4 complex, the reactive loop is partially inserted in the central β-sheet A (blue) with P14 residue (Thr342) impeded from further insertion by the underlying Tyr241 from the S2/3B connecting loop (purple). B, in the cleaved TBG-T4 structure, the reactive loop is fully inserted into the central β-sheet A with the side chain of Thr342 forming a direct contact with the OH group of Tyr. The β-sheet B is colored in yellow.
Temperature Modulation of Binding Affinity
A corollary of the flexibility and plasticity of the binding sites demonstrated by the overall results is the likelihood of a modulated rather than a direct on-off hormone release mechanism. Our proposal from the earlier structural studies (6) that the release of thyroxine from TBG is potentially modulated by temperature, is confirmed here (Table 4) by the changes in binding affinities of the T4 fluorophore at ambient temperature (22 °C) and normal body temperature (37 °C). The prediction that increases in temperature will affect hormone binding affinity were based on two likely contributions, primarily the known effect from other serpins (31) of increasing temperature on the opening of the β-sheet A and entry of the reactive loop and second, on the predictable increased flexibility of the binding pocket at higher temperature. Evidence that both factors contribute to the temperature induced changes in TBG is seen in Table 4 with 2.5-fold increase in Kd between 22 and 37 °C with wild-type TBG versus the lesser 1.9-fold change with its cleaved form in which the loop is fully inserted. The changes in CBG are more profound, with a nearly 11-fold decrease in cortisol binding affinity between 22° and 37 °C. The difference in sensitivity between native TBG and CBG toward temperature is likely due to the different configurations of reactive loop and β-sheet A where CBG has a closed β-sheet A and fully exposed reactive loop, whereas TBG has a partially opened β-sheet A with the reactive loop partially inserted.
TABLE 4.
The temperature effect on the binding affinity of TBG and CBG conformers
| Temperature | TBG (Kd) |
CBG (Kd)a |
||
|---|---|---|---|---|
| Native | Cleaved | Native | Cleaved | |
| nm | nm | nm | nm | |
| 22 °C | 2.1 ± 0.2 | 12.1 ± 0.4 | 26.9 ± 2.4 | N.D. |
| 37 °C | 5.6 ± 0.1 | 23.4 ± 0.6 | 292.2 ± 19.0 | 1366.0 ± 123.5 |
a We note that the Kd values for recombinant CBG determined here differ from those of our colleagues (36); the differences are in absolute values rather than in principle and do not affect the conclusions in the earlier paper. N.D., not determined.
DISCUSSION
During the past 20 years, crystallography has played a key role in elucidating how the function of serpins as protease inhibitors or hormone carriers is dependent on their unique S-to-R conformational change. These studies show that serpins are folded in a metastable conformation, which is normally in an equilibration between different reactive loop-sheet configurations. This dynamic equilibrium allows the allosteric modulation of the functions of serpins, as seen in protease inhibition by antithrombin (32) and more recently with hormone release from TBG and CBG (6–8). However, each of the crystal structures in these studies represents just a single “frozen” conformation and crystallographic structural studies alone are often inadequate in illustrating the binding kinetics of a protein. For example, native antithrombin binds heparin ∼30-fold more tightly than its latent conformer; however, structures of native and latent antithrombin complexed with heparin show that heparin binds to the same site in latent as in native antithrombin and induces similar conformational changes in the site (12, 33). Therefore, it is not surprising that in the crystal structures of CBG cortisol binds to both native and cleaved conformers in the same way and, as also shown here, thyroxine binds to native and cleaved TBG with identical interactions, even though the cleaved conformers have lower hormone binding affinity. Similarly, the dynamic nature of ligand-related changes in serpins also is well documented in antithrombin. The activation of antithrombin induced by binding to the heparin pentasaccharide was shown in an initial structure (12) to be due to the full expulsion of its reactive center loop. But, subsequently, a second structure of the liganded antithrombin showed the loop to be partially inserted into the β-sheet A (13). Thus, these two frozen depictions illustrate the dynamic movement of the loop that take place in and out of the β-sheet A, giving the equilibrated changes in activity and affinity that we believe is also true of TBG and CBG, as illustrated schematically in Fig. 1D.
To dissect the detailed mechanism involved in hormone carriage and release, we have complemented our crystallographic structural studies by developing a sensitive fluorescent method for measuring the binding affinity of TBG. This allows us to demonstrate unequivocally that although cleavage of the reactive loop in TBG results in a markedly lowered affinity, the cleaved form still binds thyroxine with an affinity that greatly exceeds the binding affinity of intact uncleaved TBG for drugs such as furosemide that are considered to compete in vivo for binding with thyroxine (34). We also show here that cleaved CBG can still effectively complex with cortisol (Table 3). This is contrary to the prevailing view in the field that hormone release following reactive loop cleavage results from the irreversible destruction of the hormone-binding site (35).
Taken together with the parallel studies of antithrombin, the results here provide an explanation of the changes in binding affinity that accompany each stage of reactive loop insertion in the hormone-binding globulins, as in Fig. 1D, I–IV. In I, the shorter reactive loop of CBG is fully exposed in what will be a high affinity state. In the lower affinity state II, the longer loop in TBG is already partly inserted into the β-sheet A but will predictably readily fluctuate between the two conformations. It is at this stage, from I to II, that the expansion of the β-sheet A and the unwinding of the top of the D helix takes place in antithrombin. We believe it is this equilibrated transition between steps I and II, with the changes in the proportional population of each, that accounts for the changes in affinity in the hormone-binding globulins and allows modulated hormone binding. Hence, any changes that favor full loop expulsion will result in increased binding affinity, as shown previously with an engineered shortening of the reactive loop of TBG by Grassberger et al. (29). Conversely, changes that favor a shift beyond the partial insertion in II will result in decreased affinity as shown previously with extended reactive center loop and here with the replacement of the conserved Tyr241 that otherwise sterically impedes further loop extension. The complete and irreversible expansion of the β-sheet A, with a major loss of affinity, occurs with the full insertion of the cleaved reactive loop, as in IV.
As confirmed here, the connecting loop on top of the hD is the key mediator in transmitting the movements of the reactive loop to the hormone-binding site with shortening of it by three residues making the mutant insensitive to the S-to-R transition. As summarized in Fig. 6, the connecting loop is seen in the structures of TBG to be linked to residues in the s2/3B loop, which in turn interacts with the s4/5B loop, and especially so with Arg378, which directly flanks the binding site. It is the close packing of these loops that allows the transmission of the expansion of β-sheet A to give a perturbation of the binding pocket that in TBG will favor the release of the tightly fitting thyroxine but will have a lesser effect on smaller ligands, as shown here with furosemide.
FIGURE 6.

Key interactions of TBG in regulating hormone binding and release. Hormone binding and release involves coherent movements of three closely associated elements: the connecting loops of hDs2A (dashed black line), s2/3B (thin red line), and s4/5B (thick red line). Thus, the binding of thyroxine will be destabilized by slight changes within any of these elements including increases in the flexibility of the hDs2A loop in the S-to-R transition, removal of residues from the top of hD, loosening the packing between hD and s2/3A by the K243G mutation, or the removal the side chain of Arg378. Replacing the homologous residue 243 in CBG, a glycine, with a bulkier valine will similarly affect the packing and also lead to decreased hormone binding affinity (28). Also, only the ligands that are fitted perfectly in the hormone-binding site and form direct interactions with Arg378 can be efficiently released following the S-to-R transitions of TBG.
Although we have focused here on how the movements of the helix D are associated with the changes in the hormone binding site, changes in other part of TBG following reactive loop insertion likely also contribute to the changes in the binding affinity, such as the shifts of hA following the movements of the reactive loop as shown in Fig. 2B and supplemental Fig. S1. Overall, we conclude it is the inherent plasticity of both TBG and CBG, the key feature of the serpin-fold, in contrast to other hormone carriers such as albumin, that provides the potential for subtle modulation of hormone binding and release. We demonstrate this here with TBG in response to changes in ambient temperature, as we have also shown with our colleagues in CBG, with physiological changes in body temperature (36).
Supplementary Material
Acknowledgment
We thank Richard Turner for HPLC purification of l-thyroxine-5- and 6-carboxyfluoroscein.
This work was supported by the British Heart Foundation, the Wellcome Trust, the Isaac Newton Trust of the University of Cambridge, and the Diamond Light Source.
The atomic coordinates and structure factors (codes 2RIV, 2RIW, 2XN7, 2XN6, 2XN3, and 2XN5) have been deposited in the Protein Data Bank, Research Collaboratory for Structural Bioinformatics, Rutgers University, New Brunswick, NJ (http://www.rcsb.org/).

The on-line version of this article (available at http://www.jbc.org) contains supplemental “Methods,” including equations, and Fig. S1.
- T4
- thyroxine
- TBG
- thyroxine-binding globulin
- CBG
- corticosteroid-binding globulin
- T4–5-CF
- l-thyroxine-5-carboxyfluorescein
- T4–6-CF
- l-thyroxine-6-carboxyfluorescein
- EDCI
- ethyl-3-(3-dimethylaminopropyl)carbodiimide
- hD
- helix D
- SUMO
- small ubiquitin-like modifier
- cTBG
- cleaved TBG.
REFERENCES
- 1. Flink I. L., Bailey T. J., Gustafson T. A., Markham B. E., Morkin E. (1986) Proc. Natl. Acad. Sci. U.S.A. 83, 7708–7712 [DOI] [PMC free article] [PubMed] [Google Scholar]
- 2. Hammond G. L., Smith C. L., Goping I. S., Underhill D. A., Harley M. J., Reventos J., Musto N. A., Gunsalus G. L., Bardin C. W. (1987) Proc. Natl. Acad. Sci. U.S.A. 84, 5153–5157 [DOI] [PMC free article] [PubMed] [Google Scholar]
- 3. Huber R., Carrell R. W. (1989) Biochemistry 28, 8951–8966 [DOI] [PubMed] [Google Scholar]
- 4. Silverman G. A., Bird P. I., Carrell R. W., Church F. C., Coughlin P. B., Gettins P. G., Irving J. A., Lomas D. A., Luke C. J., Moyer R. W., Pemberton P. A., Remold-O'Donnell E., Salvesen G. S., Travis J., Whisstock J. C. (2001) J. Biol. Chem. 276, 33293–33296 [DOI] [PubMed] [Google Scholar]
- 5. Irving J. A., Pike R. N., Lesk A. M., Whisstock J. C. (2000) Genome Res. 10, 1845–1864 [DOI] [PubMed] [Google Scholar]
- 6. Zhou A., Wei Z., Read R. J., Carrell R. W. (2006) Proc. Natl. Acad. Sci. U.S.A. 103, 13321–13326 [DOI] [PMC free article] [PubMed] [Google Scholar]
- 7. Klieber M. A., Underhill C., Hammond G. L., Muller Y. A. (2007) J. Biol. Chem. 282, 29594–29603 [DOI] [PubMed] [Google Scholar]
- 8. Zhou A., Wei Z., Stanley P. L., Read R. J., Stein P. E., Carrell R. W. (2008) J. Mol. Biol. 380, 244–251 [DOI] [PubMed] [Google Scholar]
- 9. Loebermann H., Tokuoka R., Deisenhofer J., Huber R. (1984) J. Mol. Biol. 177, 531–557 [PubMed] [Google Scholar]
- 10. Pemberton P. A., Stein P. E., Pepys M. B., Potter J. M., Carrell R. W. (1988) Nature 336, 257–258 [DOI] [PubMed] [Google Scholar]
- 11. Carrell R. W., Owen M. C. (1985) Nature 317, 730–732 [DOI] [PubMed] [Google Scholar]
- 12. Jin L., Abrahams J. P., Skinner R., Petitou M., Pike R. N., Carrell R. W. (1997) Proc. Natl. Acad. Sci. U.S.A. 94, 14683–14688 [DOI] [PMC free article] [PubMed] [Google Scholar]
- 13. Johnson D. J., Huntington J. A. (2003) Biochemistry 42, 8712–8719 [DOI] [PubMed] [Google Scholar]
- 14. Janssen O. E., Golcher H. M., Grasberger H., Saller B., Mann K., Refetoff S. (2002) J. Clin. Endocrinol. Metab. 87, 1217–1222 [DOI] [PubMed] [Google Scholar]
- 15. Hammond G. L., Smith C. L., Paterson N. A., Sibbald W. J. (1990) J. Clin. Endocrinol. Metab. 71, 34–39 [DOI] [PubMed] [Google Scholar]
- 16. Owen M. C., Brennan S. O., Lewis J. H., Carrell R. W. (1983) N. Eng. J. Med. 309, 694–698 [DOI] [PubMed] [Google Scholar]
- 17. Adamczyk M., Johnson D. D., Mattingly P. G., Moore J. A., Pan Y. (1998) Bioconjug. Chem. 9, 23–32 [DOI] [PubMed] [Google Scholar]
- 18. Leslie A. W. (1992) in Joint CCP4 and ESF-EACMB Newsletter on Protein Crystallography, Issue 26, Daresbury Laboratory, Warrington, UK [Google Scholar]
- 19. Evans P. R. (1993) in Proceedings of the CCP4 Study Weekend: Data Collection and Processing (Sawyer L., Isaacs N., Bailey S. ed.) Daresbury Laboratory, Warrington, UK [Google Scholar]
- 20. McCoy A. J., Grosse-Kunstleve R. W., Storoni L. C., Read R. J. (2005) Acta Crystallogr. D. Biol. Crystallogr. 61, 458–464 [DOI] [PubMed] [Google Scholar]
- 21. Huntington J. A., Pannu N. S., Hazes B., Read R. J., Lomas D. A., Carrell R. W. (1999) J. Mol. Biol. 293, 449–455 [DOI] [PubMed] [Google Scholar]
- 22. Emsley P., Cowtan K. (2004) Acta Crystallogr. D. Biol. Crystallogr. 60, 2126–2132 [DOI] [PubMed] [Google Scholar]
- 23. Winn M. D., Isupov M. N., Murshudov G. N. (2001) Acta Crystallogr. D. Biol. Crystallogr. 57, 122–133 [DOI] [PubMed] [Google Scholar]
- 24. Kabsch W., Sander C. (1983) FEBS Lett. 155, 179–182 [DOI] [PubMed] [Google Scholar]
- 25. Clark A. R. (1996) in Enzymology (Engel P. C. ed.) pp. 199–222, BIOS Scientific Publishers, Ltd., Oxford, UK [Google Scholar]
- 26. Refetoff S., Murata Y., Mori Y., Janssen O. E., Takeda K., Hayashi Y. (1996) Horm. Res. 45, 128–138 [DOI] [PubMed] [Google Scholar]
- 27. Ross H. A., Benraad T. J. (1992) Clin. Chem. 38, 880–886 [PubMed] [Google Scholar]
- 28. Perogamvros I., Underhill C., Henley D. E., Hadfield K. D., Newman W. G., Ray D. W., Lightman S. L., Hammond G. L., Trainer P. J. (2010) J. Clin. Endocrinol. Metab. 95, E142–150 [DOI] [PubMed] [Google Scholar]
- 29. Grasberger H., Golcher H. M., Fingerhut A., Janssen O. E. (2002) Biochem. J. 365, 311–316 [DOI] [PMC free article] [PubMed] [Google Scholar]
- 30. Lin H. Y., Underhill C., Gardill B. R., Muller Y. A., Hammond G. L. (2009) J. Biol. Chem. 284, 884–896 [DOI] [PubMed] [Google Scholar]
- 31. Beauchamp N. J., Pike R. N., Daly M., Butler L., Makris M., Dafforn T. R., Zhou A., Fitton H. L., Preston F. E., Peake I. R., Carrell R. W. (1998) Blood 92, 2696–2706 [PubMed] [Google Scholar]
- 32. Huntington J. A. (2006) Trends Biochem. Sci. 31, 427–435 [DOI] [PubMed] [Google Scholar]
- 33. Schedin-Weiss S., Richard B., Olson S. T. (2010) Arch. Biochem. Biophys. 504, 169–176 [DOI] [PMC free article] [PubMed] [Google Scholar]
- 34. Stockigt J. R., Lim C. F., Barlow J. W., Wynne K. N., Mohr V. S., Topliss D. J., Hamblin P. S., Sabto J. (1985) J. Clin. Endocrinol. Metab. 60, 1025–1031 [DOI] [PubMed] [Google Scholar]
- 35. Lin H. Y., Muller Y. A., Hammond G. L. (2010) Mol. Cell Endocrinol. 316, 3–12 [DOI] [PubMed] [Google Scholar]
- 36. Cameron A., Henley D., Carrell R., Zhou A., Clarke A., Lightman S. (2010) J. Clin. Endocrinol. Metab. 95, 4689–4695 [DOI] [PubMed] [Google Scholar]
Associated Data
This section collects any data citations, data availability statements, or supplementary materials included in this article.