

Abstract
We report the development of a sensitive liquid chromatography–tandem mass spectrometric assay to quantitate 3-methoxysalicylamine (3-MoSA) in biological samples. Derivatization with 1,1’-thiocarbonyldiimidazole followed by C18 reverse-phase chromatography allowed the detection of both analyte and internal standard (hexylsalicylamine) using electrospray ionization and selected reaction monitoring (SRM) in positive ion mode. We monitored the transitions from m/z 196.7 to 65.1 and from m/z 250.1 to 77.1 for 3-MoSA and HxSA, respectively. The method is validated with respect to linearity (r2 = 0.995), precision (< 17% RSD), recovery (100% for 3-MoSA and HxSA), and stability (77 % after storage up to 7 month at −80°C). The LOD and LOQ were 16.12 and 48.87 µg/l, respectively and the LLOQ of 1 pg/ml. In addition, we used this assay to analyze the pharmacokinetics of 3-MoSA in mouse plasma and tissues following both intraperitoneal or oral administration, providing new information regarding the distribution of this compound in vivo.
Keywords: 3-Methoxysalicylamine (3-MoSA); Hexylsalicylamine (HxSA); LC-MS/MS; 1,1’-Thiocarbonyldiimidazole (TCDI); Mouse tissue; Pharmacokinetics
1. Introduction
Reactive aldehydes are formed during oxidative stress and inflammation. Amongst these molecules, γ-ketoaldehydes (γ-KA) are the most reactive species. Levuglandins (LG) are γ-KA that form by non-enzymatic rearrangement of prostaglandin H2, the product of the cyclooxygenases (COXs) [1]. They are formed in vitro following COX activity [2], as well as in cells [3] and in vivo in the brain of transgenic mice over-expressing COX-2 in neurons [4]. Levuglandins are also formed following non-enzymatic oxidation of arachidonic acid [5].
LGs readily react with primary amines to form covalent adducts with proteins and DNA [5–11]. Lipid modification of proteins by fatty acids is known to modify protein folding, localization, degradation, and function [12–14], suggesting that formation of LG adducts on proteins may have biological effects. Higher levels of LG adducts on proteins have been linked to oxidative injury [15–18] and inflammation [4, 19, 20]. Compelling evidence suggest that LG may be invovled in the developemnt of Alzheimer’s disease: LG-lysine adducts are present in hippocampus of AD brain, and levels of LG-lysyl adducts correlate with both the Braak stage and the CERAD plaque score in patients with AD [19], and formation of LG adducts on the Aβ peptide increases its rate of oligomerization to form a species with similar neurotoxicity and immunoreactivity as the amyloid-derived diffusible ligands (ADDLs) [4, 21]. Our laboratory is interested in understanding the roles of reactive aldehydes in the development of diseases such as Alzheimer’s disease. In order to differentiate between the effects due to formation of LG adducts on protein from those mediated by activation of specific receptors by prostaglandins, also products of the COXs, we have developed series of small molecules that specifically react with LG several order of magnitude faster than lysine but do not inhibit COX activity in vitro and in cells [22]. One of these molecules, 3-methoxysalicylamine acetate (3-methoxy-2-hydroxybenzylamine, 3-MoSA), is a vanillin derivative containing an amino group that scavenges LGs by competing with the lysine in protein. It is efficient in all cells tested and is not cytotoxic [22], making it a good candidate for in vivo studies.
In order to quantify tissue concentrations of this compound in vivo, we have developed a simple and rapid method for extraction of 3-MoSA from tissues or biological fluids and its detection by liquid chromatography/electrospray ionization/tandem mass spectrometry (LC/ESI/MS/MS). A simple liquid extraction procedure following chemical derivatization was used for the sample preparation [23]. This method was then applied to study the pharmacokinetics of 3-MoSA in animals after intraperitoneal or oral administration.
2. Experimental
2.1 Chemical and reagents
3-Methoxysalicylamine acetate (3-MoSA) and hexylsalicylamine (HxSA) were synthesized as previously described [22]. Water, ethyl acetate, acetonitrile (ACN) and methanol were purchased from Fisher Chemicals and 10X phosphate buffered saline from Fisher BioReagents (Fisher Scientific, Fair Lawn, New Jersey, USA). All solvents were HPLC-grade or higher. Acetic acid, potassium phosphate dibasic anhydrous (K2HPO4), phosphoric acid (H3PO4) and 1,1’-thiocarbonyldiimidazole (TCDI) 97% were obtained from Sigma-Aldrich (Saint Louis, MO). Spin X centrifuge filter devices were purchased from Costar (Corning, NY).
2.2 Preparation of stock and standard solutions
The stock solution of 3-MoSA and HxSA were prepared in water (10 mM) and used to spike standards samples. Working solutions of 3-MoSA were prepared by serial dilution in water (0.01, 0.1, 1, 10, 100, 1000, µg/l), and the working concentration of the HxSA internal standard (IS) was prepared by diluting the stock with water to 10 µg/l. Calibration standard samples were prepared at concentrations of 0.001, 0.01, 0.1, 1, 10 and 100 µg/l by adding 20 µl of 3-MoSA working solutions and 20 µl of I.S. (final concentration 1 µg/l) into 160 µl water. A “zero” standard sample was prepared by adding 20 µl of I.S. to 180 µl of water. These solutions were stored at −20°C until used.
2.3 Derivatization with TCDI
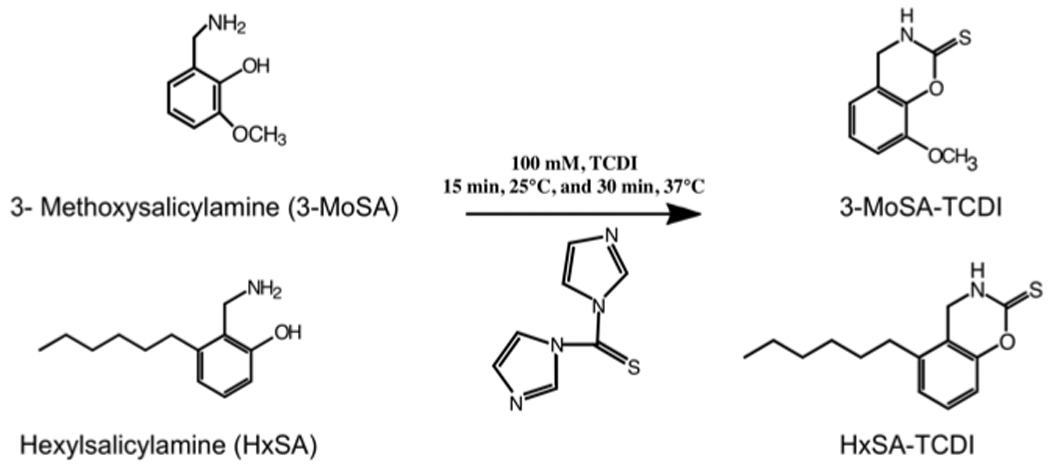
Before derivatization, 10 µl of 1M H3PO4 was added to the samples, followed by 400 µl of PBS, and 50 µl of 1M K2HPO4. The derivatization agent (50 µl of 100 mM TCDI in ACN) was added to each tube, vortexed vigorously for 10 s and incubated for 15 min at 25°C followed by 30 min at 37°C. The structures of the parent and derivatized compounds are shown in figure 1. The derivatized compounds were extracted three times with 500 µl of ethyl acetate. The extract was dried down, resuspended in 100 µl of ACN-water (1:1, v/v), vortexed, and filtered through a 0.22-µm spin X column. 10 µl of the supernatant was injected for LC/ESI/MS/MS analysis [23].
Figure 1. Structures of 3-methoxysalicylamine (3-MoSA), hexylsalicylamine (HxSA), and their thiocarbonyldiimidazole (TCDI) derivatives.
2.4 NMR spectroscopy analysis
The reaction of 3-MoSA with TCDI was purified by HPLC using a Discovery C18 5 µm (25 cm × 4.6 mm i.d. Supelco, Torrance CA.) column. The mobile phase consisted of solvent A (10% ACN/0.1% glacial acetic acid) and solvent B (99.9% ACN/0.1% glacial acetic acid), both of which were filtered through a 0.45-µm filter prior to mixing and were ultrasonically degassed after mixing. The gradient was as follows: 0 to 8 min 100 % A to 10 % A, 8 to 10 min 10 % A, 10 to 13 min 10 % A to 100 % A, 13 to 16 min 100 % A, with a flow rate of 1 ml/min. Fractions of 0.5 ml have been collected and analyzed by LC/ESI/MS/MS. The fractions containing 3-MoSA-TCDI were pooled, dried and resuspended in [2H6] DMSO. Nuclear magnetic resonance spectra were acquired using a 14.0 T Bruker magnet equipped with a Bruker AV-III console operating at 600.13 MHz. All spectra of the sample were acquired in 3 mm NMR tubes using a Bruker 5 mm TCI cryogenically cooled NMR probe. Chemical shifts were referenced internally to [2H6] DMSO (δ 2.5 ppm), which also served as the 2H lock solvent, and the coupling constants (J) are reported in Hz. For 1H and 13C NMR experimental conditions includes 32K data points, 13 ppm sweep width, a recycle delay of 1.5 s, and 32–256 scans, depending on sample concentration. 3-Methoxysalicylamine-TCDI (3-MoSA-TCDI): 1H NMR (600 Mhz, DMSO-d6) δ 7.11 (dd, 1H, J = 3.0 and 7.9 Hz, 5-H), 7.01 (dd, 1H, J = 1.98 and 7.9 Hz, 7-H), 6.76 (dd, 1H, J = 1.64 and 7.9 Hz, 6-H), 4.37 (s, 2H, CH2), 3.82 (s, 3H, CH3), 2.05 (s, 1H, NH). 13C NMR δ 181.65 (C1), 146.21 (C8), 137.55 (C9), 125.23 (C4), 117.95 (C6), 117.44 (C5), 111.77 (C7), 55.76 (C10) and 41.39 (C3).
2.5 Method validation procedure
Assays were performed in brain homogenate. The stability of 3-MoSA in mouse brain homogenate to freezing was assessed by comparing freshly prepared samples to the same samples stored at −80°C for up to 7 months. Carry over was evaluated by placing vials of blank solvent at several locations in the analysis set. In order to assess the intra- and inter-batch precision and accuracy of the assay, 3-MoSA standard curve samples were prepared at 0.1, 1, 10, 100, and 1000 µg/l concentrations. The intra-batch precision (repeatability) of the assay was evaluated by the relative standard deviation (% RSD) of four replicates and the inter-batch precision (reproducibility) was evaluated by the analysis of standard curve samples in four batches (in duplicate); % RSD = (SD/mean) × 100. The accuracy was calculated as the percent error in the calculated 3-MoSA concentration relative to the nominal 3-MoSA concentration (% R.E.). For the assay to be considered acceptable, the precision and accuracy of a method is generally considered acceptable if % RSD < 15%, or for the lowest concentrations, < 20% [24].
The limit of quantification (LOQ) and limit of detection (LOD) were calculated directly from the calibration plot. LOQ and LOD were calculated as 10σ/S and 3.3σ/S, respectively, where σ is the standard deviation of line and S is the slope of the calibration plot [25]. The lower limit of quantification (LLOQ) was determined by evaluating the linear range of the calibration curve. LLOQ was defined as the lowest concentration yielding precision and accuracy with % RSD < 20% for both intra- and inter-batch analysis.
2.6 In vivo pharmacokinetic studies
The extraction recovery was determined by comparing peak areas of the 3-MoSA from spiked matrix (blank brain homogenate spiked with 3-MoSA) before extraction and from the same amount of 3-MosA added to samples after extraction. Matrix effect on ionization was evaluated by comparing the peak areas of 3-MoSA from samples spiked post-extraction with corresponding peak area of the same amount of 3-MoSA added to tissue–free extraction solvent. The specificity of the method was demonstrated by comparing chromatograms of control brain homogenate, brain homogenate spiked with 3-MoSA ex vivo, and brain homogenate obtained from 3-MoSA-treated mice.
2.7 Liquid chromatography and mass spectrometry conditions
The reactions were analyzed by LC/ESI/MS/MS using a Jupiter 5 µm C18, 300 Å (150 mm × 2.00 mm i.d.; Phenomenex, Torrance CA.) column. The mobile phase consisted of solvent A (10% ACN/0.1% glacial acetic acid) and solvent B (99.9% ACN/0.1% glacial acetic acid), both of which were filtered through a 0.45-µm filter prior to mixing and were ultrasonically degassed after mixing. The gradient was as follows: 0 to 8 min. 100% A to 10% A, 8 to 10 min. 10% A, 10 to 13 min. 10%A to 100%A, 13 to 16 min. 100%A, with a flow rate of 0.2 ml/min. The mass spectrometer was a Thermo Finnigan (San Jose, CA) TSQ Quantum Triple Quadrupole equipped with a standard electrospray ionization source. Nitrogen was used for both the sheath and auxiliary gas. The mass spectrometer was operated in the positive ion mode and the electrospray needle was maintained at 4300 V. The ion transfer tube was operated at 35 V and the capillary temperature was 300°C. The tube lens voltage varied depending on the compound being analyzed (240 for 3-MoSA and 22 for HxSA). The ions were subjected to collision-induced dissociation at from −28 to −45 eV, and daughter ions were scanned between m/z 50 and 500. Xcalibur software (version 1.3; ThermoFinnigan) operated the instrument and processed the data.
2.8 Pharmacokinetic study
Animal experiments were performed according to the National Institutes of Health Guide for Care and Use of Laboratory Animals and institutional guidelines, which comply with AALAS legislation. All protocols were approved by Vanderbilt’s IACUC. Mice were 12-week-old males of C57BL/6N background, weighing 23–25 g. C57BL6 mice were chosen for these studies because they are the background strain for the animal models of Alzheimer’ Disease in which we are interested. Because there may be differences in metabolism between males and females and the studies in AD are done using males, we have focused our efforts on male mice. Animals were kept in a temperature-controlled environment with a 12-h light/12-h dark cycle. They received a standard diet and free access to water.
2.8.1 Drug administration and sample collection
Mice were injected intraperitoneally with 3-MoSA in PBS (200 mg/kg). At 15 min, 30 min, 1h, 2h and 4h after injection, mice were anesthetized with isoflurane and were sacrificed by decapitation. Blood was collected in heparinized tubes and tissue samples were harvested.
For oral administration experiments, 3-MoSA was added to the drinking water (3, 5, 7 or 10 g/l) for 1 week before sacrifice. Blood was collected in heparinized tubes and tissue samples were harvested.
To prepare plasma, blood was centrifuged at 3000 × g for 10 min at room temperature; plasma was stored with other tissues (heart, liver, brain, and spleen) at −80°C until analysis.
2.8.2 Preparation of Biological Samples
Plasma: In a 2-ml polypropylene tube, 170 µl of PBS and 10 µl of I.S. were added to 20 µl of plasma. After briefly vortexing the sample, 10 µl of 1M phosphoric acid was added and the sample was vortexed again. The sample was derivatized with TCDI as describe above.
Tissue: Tissue (20–40 mg) was mechanically homogenized in a 2-ml polypropylene tube with 180 µl of 50 mM phosphoric acid and 20 µl of I.S. The solution was centrifuged at 12,000 × g for 10 min at 4°C. The supernatant was transferred into a new 2-ml polypropylene tube and the sample was derivatized with TCDI as described above.
2.8.3 Pharmacokinetic analysis
Pharmacokinetic parameters of 3-MoSA were calculated by a non-compartmental method using WinNonlin 5.1 Program (Pharsight Corp., Mountain View, CA USA). The pharmacokinetic parameters were derived using the method described by Gabrielssom et al. [26]. To resume, the area under the plasma or tissue concentration versus time curve up to the last quantifiable time point, AUC(0-t), was obtained by the linear and log–linear trapezoidal summation. The AUC(0-t) was extrapolated to infinity (AUC(0-∞)) by adding the quotient Clast/kel, where Clast is the last quantifiable concentration and Kel represents the apparent terminal rate constant, and was calculated by the linear regression of the log-transformed concentrations of the drug in the terminal phase. The half-life of the terminal elimination phase was obtained using the relationship t1/2 = 0.693/kel. Systemic clearance (CL/F) was calculated by the relationship CL/F = (Dip)/(AUC(0-t),ip) where Dip is the dose of the compound injected intra-peritoneally. The apparent volume of distribution (Vd/F) was obtained from the equation Vd/F = (Dip).MRT/(AUC(0-t)kel), where MRT is the mean residence time. The observed peak plasma concentration (Cmax) and the time-to-peak concentration (Tmax) were recorded.
2.9 Statistical analysis
Statistical analysis was performed using GraphPad Prism 4.0 (GraphPad Software, Inc., San Diego, CA). Student’s t-test was used, and p < 0.05 was considered statistically significant. Data are expressed as mean ± SE.
3. Results and Discussion
3.1 Chromatographic method
The full mass spectra for 3-MoSA-TCDI and the internal standard (I.S., HxSA-TCDI) revealed predominant peaks at m/z=196.7 and 250.1 as protonated molecular ions ([M+H]+) (Figure 2). These precursor ions were fragmented and the product ion spectra were obtained. The probable cleavage reactions of 3-MoSA-TCDI (m/z=196.7) that form the product ions 138.1, 124.0, 108.2, 80.2, 79.1, and 65.2 are presented in Figure 2A. The probable cleavage reactions of HxSA-TCDI (at m/z=250.1) that form the product ions 191.1, 137.1, 121.0, 107.0, 93.0, 79.1, and 77.1 are presented in Figure 2B. The fragment ions at m/z=138.1 and 65.2 [27] were used for quantification for 3-MoSA-TCDI, and the fragment ions at m/z=191.1 and 77.1 were chosen for quantification of the I.S. Selected reaction monitoring (SRM) mode was used to carry out the quantitative analysis because it could simultaneously detect the precursor and product ions and consistently provide high selectivity, sensitivity, and intensity. To achieve a higher peak intensity and better peak shape, optimization was done using a gradient of acetonitrile/water with an addition of 0.1% glacial acetic acid to the mobile phase. The development of the chromatographic system was focused on shortening retention times with preserving the chromatographic separation of the analytes from the matrix contaminants. This was achieved by using a flow rate of 0.2 ml/min with the gradient described above. The conditions of elution of the analytes were optimized to improve both analyte purification and ionization process (more efficient evaporation and desolvation processes in the electrospray interface). The use of SRM provides high selectivity for both 3-MoSA and HxSA. These ions had an acceptable retention time (6.4 min and 10.4 min, respectively; Figure 3A). The overall analysis time was 16 min including re-equilibration time for the column with the initial mobile phase.
Figure 2. LC/ESI/MS spectra and selected ion monitoring of (A) 3-MoSA and (B) HxSA TCDI derivatives.
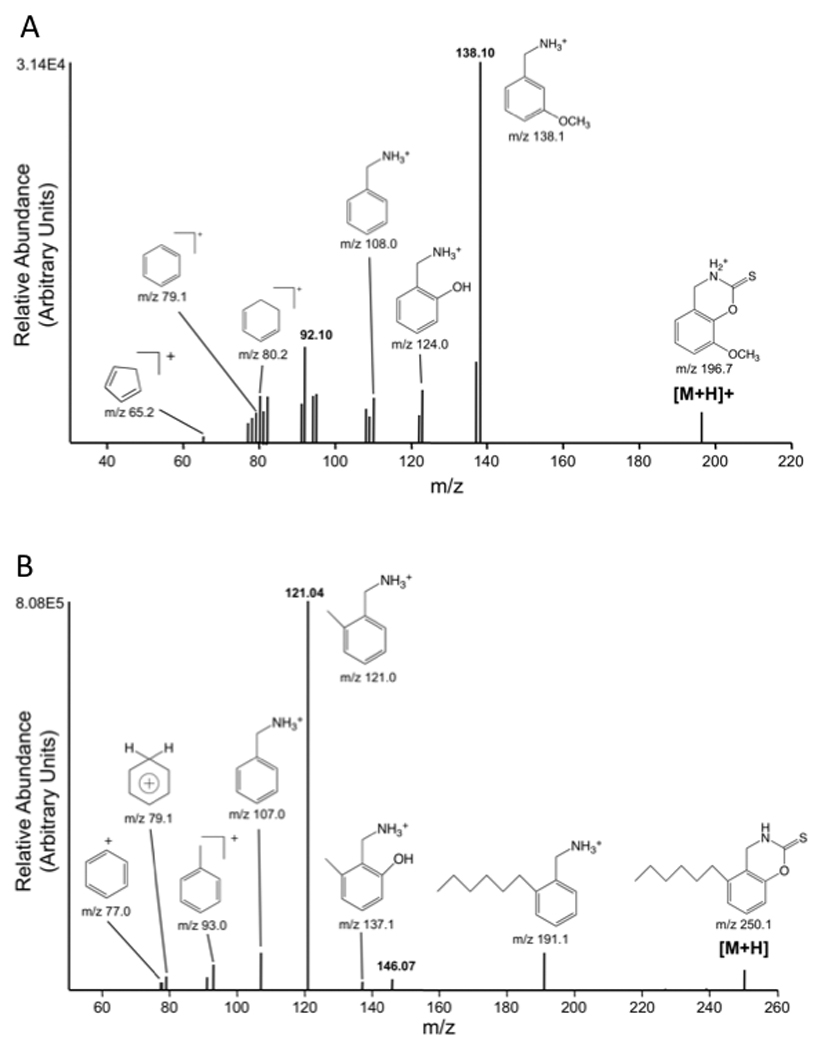
The [MH]+ ions of 3-MoSA (m/z 196.7) and HxSA (m/z 250.1) were subjected to CID. The product ions were scanned from m/z 50 to m/z 300. The spectra recorded at − 28eV are shown as they contain all fragments generated by CID. The proposed structures of individual ions and their selected ion monitoring spectrum are shown.
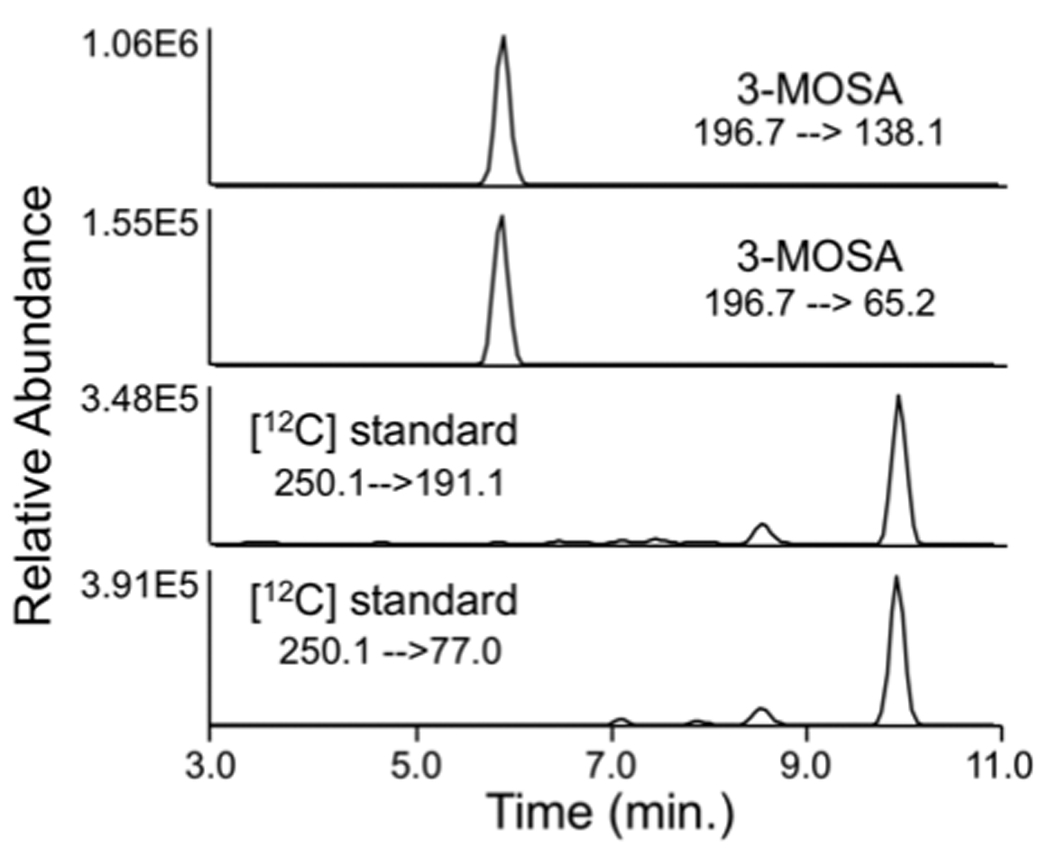
Figure 3. Typical SRM chromatograms of 3-MoSA and HxSA (internal standard) TCDI derivatives.
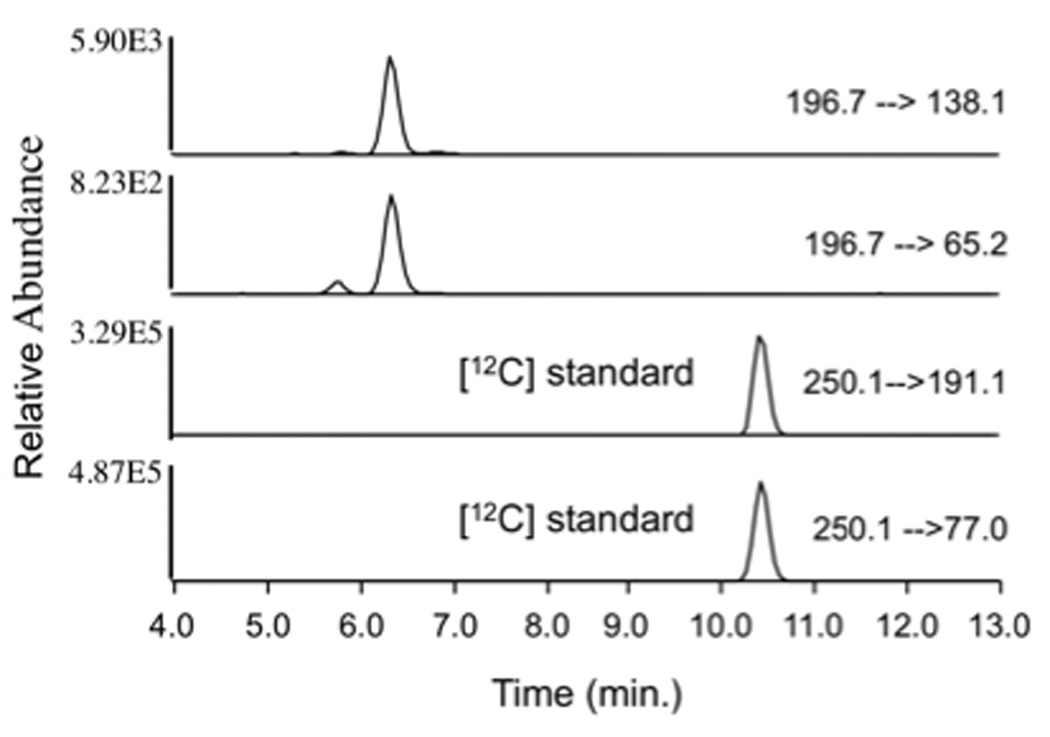
The [M+H]+ ions 3-MoSA (m/z 196.7) and HxSA (m/z 250.1) were subjected to CID. SRM chromatograms of the product ions m/z 138.1 (−22 eV) and m/z 65.2 ((−44 eV) for 3-MoSA and the product ions m/z 191.1 ((−15 eV) and m/z 77.1 ((−45 eV) for HxSA are shown.
3.2 Method validation
Assays were validated according to the U.S. FDA guidance on bioanalytical method validation [24]. A calibration curve was constructed using 5 concentrations of calibration standard ranging from 0.001–100 µg/l. Reliable reproducibility was observed throughout this range. A dose-response curve was prepared by weighing different amounts of 3-MoSA and the concentration was measured by LC/ESI/MS/MS as described above. The data was analyzed by linear regression; y = 0.8752 × described this relationship, where y is the 3-MoSA concentration measured by LC/ESI/MS/MS and × is the 3-MoSA concentration determined by weight. Good linearity was observed over the concentration range evaluated. The slope and intercept of the calibration plot were 0.73 and 3.53, respectively and the correlation coefficient (r2) was 0.995. The LOD and LOQ were 16.12 and 48.87 µg/l, respectively; these low values are indicative of the high sensitivity of the method. The LLOQ was 0.001 µg/l.
3.3 Application to in vivo pharmacokinetic studies
We have identified a means to specifically remove LGs in vivo using a novel class of scavenger molecule that removes LGs before they can adduct to proteins, without inhibiting the COX-derived production of prostaglandins [22]. We have selected the compound 3-MoSA for further study in an animal model of Alzheimer’s disease. Although we have quantified the compound concentration in several tissues and palsma, our main focus was to demonstrate its brain penetrance and achievable brain conctration after oral administration. For this purpose, we developed an efficient method for extracting and quantitating the compound in small pieces of tissues. In preliminary experiments, we found that the yields of extraction of 3-MoSA and HxSA from tissues was not high enough to allow accurate quantitation. Therefore, we assessed the effect of derivatization of 3-MoSA and HxSA with TCDI on sensitivity and chromatography. We found that derivatization with TCDI increased the compounds hydrophobicity, helping their extraction from biological tissues and fluids (99.7 % for for 3-MoSA and 82% for HxSA), and improved the chromatographic purification by improving their retention on the C18 column. We therefore used TCDI derivatization for all subsequent analysis.
The concentration of analyte in unknown samples was determined by interpolating from a standard curve performed extemporaneously. The samples suspected of containing high levels of 3-MoSA were diluted prior to analysis to achieve analyte concentrations within the linear range.
The intra- and inter-day precision and accuracy for the quantification of 3-MoSA were determined (Table 1). The intra- and inter-day precisions were acceptable with % RSD < 15 % (at the exception of the highest concentration; % RSD = 15.3%), suggesting that the method is both accurate and reproducible for quantification of 3-MoSA in mouse brain. To determine recovery, the amounts of 3-MoSA and I.S. obtained from brain samples spiked with the analytes post-extraction were compared with the amounts obtained from the same brain samples spiked with the analytes pre-extraction. The mean recovery of 3-MoSA was 116.36 ± 16.93 % for 1 µg/l (n=4) and 108.81 ± 14.04 % for 10 µg/l (n=4). The mean recovery of the I.S. at 1 µg/l was 106.43 ± 3.15 % (n=4). These data suggest that the treatment of the samples did not cause a significant loss of drug. The 3-MoSA in brain was relatively stable: 76.87 % was recovered after storage for ≥ 7 months at −80°C. The matrix effect was evaluated by using 1 µg/l and 10 µg/l of 3-MoSA. Average matrix factor values (matrix factor = AUC of 3-MoSA in sample spiked post extraction / AUC of 3-MoSA in tissue-free extraction solvent) obtained for 3-MoSA-TCDI were 74.70 ± 12.96 % and 74.84 ± 5.23 % at concentrations of 1 µg/l and 10 µg/l, respectively. The average matrix factor value obtained for I.S. at 1 µg/l was found to be 117.81 ± 8.55 %. To assess the specificity of the SRM method for 3-MoSA, blank brain samples were prepared and analyzed following the protocol used for normal samples. These samples did not contain any 3-MoSA nor I.S. No interfering peaks from endogenous compounds were observed at the retention times of 3-MoSA and I.S. (Figure 4, A), demonstrating that our purification method removes all potentially interfering endogenous compounds and that the observed signals are specific for the analytes (Figure 4, B).
Table 1.
Intra- and inter-day precision and accuracy of the LC/MS/MS method to quantitate 3-MoSA.
| Prepared concentration of 3-MoSA (µg/l) |
Measured concentration of 3-MoSA (µg/l) (mean ± S.D.) |
Accuracy (% R.E.)a |
% R.S.D.b |
|---|---|---|---|
| Intra-day | |||
| 0.1 | 0.1 ± 0.01 | 90 | 11.1 |
| 1 | 1.0 ± 0.1 | 100 | 10.0 |
| 10 | 8.0 ± 1.1 | 90.9 | 14.2 |
| 100 | 66.7 ± 09.6 | 76.3 | 14.4 |
| 1000 | 725.3 ± 110.8 | 83.6 | 15.3 |
| Inter-day | |||
| 0.1 | 0.1 ± 0.01 | 110 | 9.1 |
| 1 | 1.0 ± 0.1 | 109 | 11.2 |
| 10 | 8.0 ± 1.2 | 91.7 | 14.8 |
| 100 | 66.7 ± 9.7 | 76.4 | 14.6 |
| 1000 | 741.4 ± 106.7 | 84.8 | 14.3 |
relative error
relative standard deviation
Values are means ± SE (n > 4)
Figure 4. Representative SRM chromatograms for the determination of 3-MoSA in mouse brain homogenate samples by LC/ESI/MS/MS.

SRM chromatograms are shown for (A) mice brain homogenate without additives; (B) brain homogenate spiked with 3-MoSA and 1 µg/l HxSA (internal standard); (C) brain homogenate after 7 days of treatment with 5 g/l 3-MoSA and spiked ex vivo with 1 µg/l HxSA (internal standard).
3.4 Application to study 3-MoSA pharmacokinetics in mice
All data were corrected for the measured plasma volume in brain and other tissues in lieu of routinely performing saline perfusion. The total plasma volume for an average mouse brain is 1.6% of the total wet weight according to previously published work [28].
3.4.1 Intraperitoneal administration
A single intraperitoneal (i.p.) dose of 3-MoSA (200 mg/kg) was administered to mice and tissues were harvested over time as previously described. 3-MoSA was detectable in tissue for up to 4h after injection. Time course of the mean plasma and brain concentrations of 3-MoSA are shown in figure 5 and the pharmacokinetic parameters are shown in Table 2. 3-MoSA was rapidly absorbed in the systemic circulation; the plasma concentration was maximal (343 µg/ml) at 30 min and decreased quickly between 1 h and 4 h after injection. The volume of distribution Vd/F (486.39 L/Kg) indicates penetration of the drug into organs and tissues. The plasma elimination half-life (t1/2) of 3-MoSA was 0.61 h and the AUC0-t was 361 ± 42 µg.h/ml. In brain, the maximum concentration (CBmax) of 3-MoSA was 1395 ± 207 µg/g at 15 min after dosing, suggesting that the compound rapidly penetrates through the blood-brain barrier (log BB = 0.56), and elimination half-life (t1/2) was 0.46 h. The AUC0-t for brain was 1339 ± 88 µg.h/g. The total body clearance (CL/F) was 544.06 l/h/kg. The kinetics of 3-MoSA distributions to the heart, spleen, liver and kidneys were determined (Table 3). Similar to the brain, 3-MoSA distributed to these organs within 15–30 min of administration, with the maximum concentrations in the kidney and spleen. Although the organ drug content markedly exceeded that of plasma, there was no evidence of specific drug accumulation over time in any of the organs studied.
Figure 5. Brain and plasma concentration-time profile of 3-MoSA in mice after a single intra-peritoneal injection (200 mg/kg).
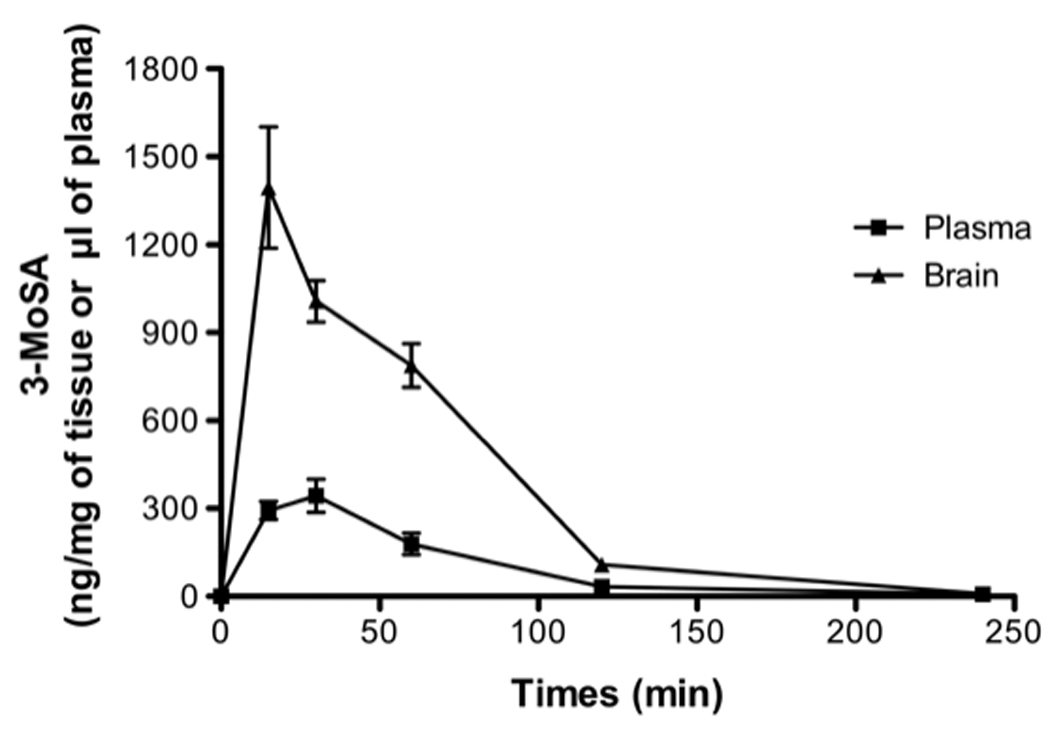
The concentration of 3-MoSA was determined by LC/ESI/MS/MS analysis, as described in Materials and methods. Values are means ± SE (n > 6)
Table 2.
Pharmacokinetic parameters of 3-MoSA in mouse brain or plasma after a single intra-peritoneal administration of 200 mg/kg.
| Parameter | Plasma (± S.E.M.) | Brain (± S.E.M.) |
|---|---|---|
| Cmax (µg/ml or µg/g) | 342.6 ± 56.4 | 1395.3 ± 207.0 |
| Tmax (h) | 0.5 | 0.25 |
| Elimination t1/2 (h) | 0.6 | 0.5 |
| AUC (0-t) (µg.h/ml or µg.h/g) | 361.5 ± 41.6 | 1338.9 ± 87.6 |
| CL/F (l/h/kg) | 544.1 | - |
| V/F (l/kg) | 486.4 | - |
| Log BB = 0.56 | ||
Values are means ± SE (n > 6). Pharmacokinetic parameters calculated by a non-compartmental method using WinNonlin 5.1.
Table 3.
Pharmacokinetic parameters of 3-MoSA in mouse tissue (heart, spleen, liver, and kidney) after a single intra-peritoneal administration of 200 mg/kg.
| Parameter | Heart (± S.E.M.) | Spleen (± S.E.M.) | Liver (± S.E.M.) | Kidney (± S.E.M.) |
|---|---|---|---|---|
| Cmax (µg/g) | 600.5 ± 113.0 | 935.6 ± 115.4 | 880.4 ± 122.3 | 1703.1 ± 146.1 |
| Tmax (h) | 0.25 | 0.25 | 0.25 | 0.50 |
| Elimination t1/2 (h) | 0.5 | 0.6 | 0.9 | 0.6 |
| AUC (0-t) (µg.h/g) | 546.7 ± 52.4 | 734.5 ± 60.7 | 540.4 ± 37.1 | 1981.6 ± 174.0 |
| MRTinf (h) | 0.9 | 1.0 | 1.0 | 0.9 |
Values are means ± SE (n > 6). Pharmacokinetic parameters calculated by a non-compartmental method using WinNonlin 5.1.
3.4.2 Oral administration
To investigate the pharmacokinetics of orally administered 3-MoSA, the compound was dissolved in drinking water, which was made freely available to the mice. Separate cages received one of 4 concentrations of 3-MoSA: 3, 5, 7 or 10 g/l. After 7 days of drug administration, 3-MoSA was monitored in tissues; a representative chromatogram for 3-MoSA and the I.S. is presented in figure 6. The concentrations of 3-MoSA in the brain were 18, 25, 38 and 82 µg/g tissue for the drink concentration 3, 5, 7 and 10 g/l, respectively (Table 4). The highest tissue levels of 3-MoSA in liver and kidney support a role for these organs in drug excretion. Assuming an equal density (1 ml plasma = 1 g brain), the oral administration of 3-MoSA for 1 week at the doses of 3, 5, 7 and 10 g/l/day gives concentrations of 92, 126, 191 and 419 µM in the brain, respectively.
Figure 6. Representative SRM chromatograms for the determination of 3-MoSA in mouse brain homogenate after 7 days of oral administration of 5 g/l 3-MOSA.
Brain homogenate were spiked ex vivo with 1 µg/l HxSA (internal standard). SRM chromatograms of the product ions m/z 138.1 (22 eV) and m/z 65.2 (44 eV) for 3-MoSA and the product ions m/z 191.1 (15 eV) and m/z 77.1 (45 eV) for HxSA are shown.
Table 4.
Accumulation of 3-MoSA in plasma and tissues after oral drug administration.
| Tissues * | Drink at 3 g/l (± S.E.M.) | Drink at 5 g/l (± S.E.M.) | Drink at 7 g/l (± S.E.M.) | Drink at 10 g/l (± S.E.M.) |
|---|---|---|---|---|
| Kidney | 91.1 ± 16.3 | 154.9 ± 20.3 | 210.0 ± 13.1 | 211.7 ± 17.4 |
| Liver | 74.1 ± 11.7 | 203.7 ± 22.0 | 251.6 ± 24.3 | 259.3 ± 26.2 |
| Heart | 23.9 ± 6.5 | 46.3 ± 6.0 | 53.5 ± 8.1 | 60.2 ± 8.7 |
| Spleen | 46.6 ± 7.9 | 82.2 ± 7.2 | 184.9 ± 11.6 | 192.5 ± 23.6 |
| Plasma | 4.0 ± 1.0 | 5.4 ± 1.1 | 10.8 ± 1.6 | 11.5 ± 1.2 |
| Brain | 18.1 ± 4.4 | 24.7 ± 3.1 | 37.6 ± 0.8 | 82.3 ± 24.5 |
expressed in µg of 3-MoSA/g of tissue or µg of 3-MoSA/ml of plasma
Values are means ± SE (n = 5)
4. Conclusion
We developed and validated a selective LC/MS/MS method to quantitate 3-MoSA in biological samples following derivatization with TCDI. The chemical derivatization improved extraction yields from tissues and facilitated the chromatographic purification of the analytes. The method is sensitive and specific: the LOD and LOQ were 16.12, 48.87 µg/l, respectively and a LLOQ of 1 pg/ml. It was applied to study the pharmacokinetics of 3-MoSA in mouse tissues. Following oral or intraperitoneal administration, 3-MoSA was rapidly absorbed and widely distributed to body tissues, including the brain. This study determines that 3-MoSA can be used in vivo for studies aimed at understanding the biological consequences of formation of γ-ketoaldehyde adducts on proteins in conditions of inflammation and/or oxidative stress, such as Alzheimer’s disease.
Acknowledgement
We are grateful to Dr. Donald Stec for his help with the NMR experiments. We thank Dr Erica Carrier for expert assistance and Dr James Smith for his valuable advice. This work was supported in part by the American Health Assistance Foundation and by grants AG026119, GM15431 and GM42056 from the National Institutes of Health. JAO is the Thomas F. Frist, Sr. Professor of Medicine.
Footnotes
Publisher's Disclaimer: This is a PDF file of an unedited manuscript that has been accepted for publication. As a service to our customers we are providing this early version of the manuscript. The manuscript will undergo copyediting, typesetting, and review of the resulting proof before it is published in its final citable form. Please note that during the production process errors may be discovered which could affect the content, and all legal disclaimers that apply to the journal pertain.
This work was presented, in part, at the 11th International Conference on “Alzheimer’s disease and Related Disorders”, Chicago, IL, July 26–31, 2008.
References
- 1.Salomon RG. Acc. Chem. Res. 1985;18:294. [Google Scholar]
- 2.Boutaud O, Brame CJ, Chaurand P, Li J, Rowlinson SW, Crews BC, Ji C, Marnett LJ, Caprioli RM, Roberts LJ, 2nd, Oates JA. Biochemistry. 2001;40:6948. doi: 10.1021/bi002629k. [DOI] [PubMed] [Google Scholar]
- 3.Boutaud O, Li J, Zagol I, Shipp EA, Davies SS, Roberts LJ, 2nd, Oates JA. J. Biol. Chem. 2003;278:16926. doi: 10.1074/jbc.M300940200. [DOI] [PubMed] [Google Scholar]
- 4.Boutaud O, Montine TJ, Chang L, Klein WL, Oates JA. J. Neurochem. 2006;96:917. doi: 10.1111/j.1471-4159.2005.03586.x. [DOI] [PMC free article] [PubMed] [Google Scholar]
- 5.Brame CJ, Salomon RG, Morrow JD, Roberts LJ., 2nd J. Biol. Chem. 1999;274:13139. doi: 10.1074/jbc.274.19.13139. [DOI] [PubMed] [Google Scholar]
- 6.Salomon RG, Miller DB, Zagorski MG, Coughlin DJ. J. Am. Chem. Soc. 1984;106:6049. [Google Scholar]
- 7.Iyer RS, Ghosh S, Salomon RG. Prostaglandins. 1989;37:471. doi: 10.1016/0090-6980(89)90096-8. [DOI] [PubMed] [Google Scholar]
- 8.Iyer RS, Kobierski ME, Salomon RG. J. Org. Chem. 1994;59:6038. [Google Scholar]
- 9.Boutaud O, Brame CJ, Salomon RG, Roberts LJ, 2nd, Oates JA. Biochemistry. 1999;38:9389. doi: 10.1021/bi990470+. [DOI] [PubMed] [Google Scholar]
- 10.Zagol-Ikapitte I, Bernoud-Hubac N, Amarnath V, Roberts LJ, 2nd, Boutaud O, Oates JA. Biochemistry. 2004;43:5503. doi: 10.1021/bi049842r. [DOI] [PubMed] [Google Scholar]
- 11.Carrier EJ, Amarnath V, Oates JA, Boutaud O. Biochemistry. 2009;48:10775. doi: 10.1021/bi9015132. [DOI] [PMC free article] [PubMed] [Google Scholar]
- 12.Nadolski MJ, Linder ME. Febs J. 2007;274:5202. doi: 10.1111/j.1742-4658.2007.06056.x. [DOI] [PubMed] [Google Scholar]
- 13.Resh MD. Nat. Chem. Biol. 2006;2:584. doi: 10.1038/nchembio834. [DOI] [PubMed] [Google Scholar]
- 14.Buser CA, Sigal CT, Resh MD, McLaughlin S. Biochemistry. 1994;33:13093. doi: 10.1021/bi00248a019. [DOI] [PubMed] [Google Scholar]
- 15.Salomon RG, Batyreva E, Kaur K, Sprecher DL, Schreiber MJ, Crabb JW, Penn MS, DiCorletoe AM, Hazen SL, Podrez EA. Biochim. Biophys. Acta. 2000;1485:225. doi: 10.1016/s1388-1981(00)00038-x. [DOI] [PubMed] [Google Scholar]
- 16.Fukuda K, Davies SS, Nakajima T, Ong BH, Kupershmidt S, Fessel J, Amarnath V, Anderson ME, Boyden PA, Viswanathan PC, Roberts LJ, 2nd, Balser JR. Circ. Res. 2005;97:1262. doi: 10.1161/01.RES.0000195844.31466.e9. [DOI] [PubMed] [Google Scholar]
- 17.Poliakov E, Brennan ML, Macpherson J, Zhang R, Sha W, Narine L, Salomon RG, Hazen SL. FASEB J. 2003;17:2209. doi: 10.1096/fj.03-0086com. [DOI] [PubMed] [Google Scholar]
- 18.Davies SS, Talati M, Wang X, Mernaugh RL, Amarnath V, Fessel J, Meyrick BO, Sheller J, Roberts LJ., 2nd Free Radic. Biol. Med. 2004;36:1163. doi: 10.1016/j.freeradbiomed.2004.02.014. [DOI] [PubMed] [Google Scholar]
- 19.Zagol-Ikapitte I, Masterson TS, Amarnath V, Montine TJ, Andreasson KI, Boutaud O, Oates JA. J. Neurochem. 2005;94:1140. doi: 10.1111/j.1471-4159.2005.03264.x. [DOI] [PubMed] [Google Scholar]
- 20.Boutaud O, Andreasson KI, Zagol-Ikapitte I, Oates JA. Brain Pathol. 2005;15:139. doi: 10.1111/j.1750-3639.2005.tb00510.x. [DOI] [PMC free article] [PubMed] [Google Scholar]
- 21.Boutaud O, Ou JJ, Chaurand P, Caprioli RM, Montine TJ, Oates JA. J. Neurochem. 2002;82:1003. doi: 10.1046/j.1471-4159.2002.01064.x. [DOI] [PubMed] [Google Scholar]
- 22.Zagol-Ikapitte I, Amarnath V, Bala M, Roberts LJ, 2nd, Oates JA, Boutaud O. Chem. Res. Toxicol. 2010;23:240. doi: 10.1021/tx900407a. [DOI] [PMC free article] [PubMed] [Google Scholar]
- 23.Amarnath K, Amarnath V, Amarnath K, Valentine HL, Valentine WM. Talanta. 2003;60:1229. doi: 10.1016/S0039-9140(03)00232-7. [DOI] [PubMed] [Google Scholar]
- 24.F.a.D.A. US Department of Health and Human Services, Center for Drug Evaluation and Research, Center for Veterinary Medicine. 2001 Available at: www.fda.gov/cder/guidance/4252fnl.pdf.
- 25.Harmonised tripartite guideline: validation of analytical procedures: text and methodology Q2(R1) 2005 http://www.ich.org/LOB/media/MEDIA417.pdf.
- 26.Gabrielssom JL, Weiner DL. Pharmacokinetic and Pharmacodynamic Data Analysis: Concepts and Applications. Fourth Edition. Swedish Pharmaceutical Press; 2007. [Google Scholar]
- 27.Silverstein RM, Bassler GC, Morrill TC. Spectrometric Identification of Organic Compounds. 4th ed. New York. Chichester. Brisbane. Toronto: John Wiley & Sons; 1963. [Google Scholar]
- 28.Blasberg RG, Patlak CS, Fenstermacher JD, Cereb J. Blood Flow Metab. 1983;3:215. doi: 10.1038/jcbfm.1983.29. [DOI] [PubMed] [Google Scholar]