

SUMMARY
This article surveys the use of pain charts or pain drawings in eliciting information about the location of pain symptoms from children and adolescents. While pain charts are widely used and have been incorporated in multidimensional pediatric pain questionnaires and diaries, they present a number of issues requiring further study. These include, in particular, the number and size of different locations or areas of pain that need to be differentiated; the age at which children are able to complete pain charts unassisted; and whether the intensity and other qualities of pain can be accurately recorded on pain charts by children and adolescents. Based on data currently available, it is suggested that the unassisted use of pain charts be restricted to children aged 8 years or over, while for clinical purposes many younger children can complete pain charts with adult support. Where the investigator’s interest is restricted to a few areas of the body, checklists of body parts may have greater utility than pain charts. A new pain chart adapted for use in studies of pediatric recurrent and chronic pain is presented.
The usual focus in pain measurement is primarily pain intensity, and secondarily temporal features such as frequency and duration. The location of pain is less frequently addressed. One reason for this may be that the location of pain is hard to summarize in a single number as can be done with intensity, frequency and duration. Another reason is that many researchers are based in disciplines concerned with particular parts of the body and have little interest in pain in other locations. Nevertheless, measures of the location of pain may be important for diagnosis, targeting treatment and evaluation of treatment efficacy. They are particularly relevant for studies of patients who have pain in multiple locations [1].
Three principal ways of eliciting self-report information on the bodily location of pain are as follows:
-
▪
Patient’s verbal response to the clinician’s inquiry, usually focusing on the presenting complaint;
-
▪
Checklist of possible locations, from which the patient selects the relevant items;
-
▪
Printed pain chart or body outline on which the patient colors or writes symbols denoting pain in the appropriate places.
Combinations of a checklist and corresponding chart have also been used [1-3].
This article reviews the pain chart approach as applied in the assessment of pediatric pain. Several other terms have been used for this technique, including body outline, body map, pain drawing, line drawing of the body and pain manikin; we use the term pain chart for simplicity. Topics to be addressed include: the comparison of pain charts with checklists; scoring methods; the optimum number of body locations to be distinguished; the validity of pain charts; the advantages of electronic versus paper-and-pencil administration; the age range for which pain charts are appropriate; the aspects of pain that can be represented; and technical details such as clothing and demarcation of areas of the body.
Published pain charts
A pain chart for adults was introduced by Melzack as part of the McGill Pain Questionnaire [4], which also provides word descriptors and a rating of pain intensity. Numerous issues related to clinical and research use of pain charts with adults were reviewed [5]. The pain chart was proposed elsewhere as a tool for screening adult pain patients for psychological disorder; 19 studies of that proposition were reviewed with the conclusion that statistical associations are apparent but are too weak to justify the use of pain charts in psychological screening [6].
Pain charts are used in two widely used multidimensional questionnaires on pediatric pain: the Pediatric Pain Questionnaire [7-10] and the Adolescent Pediatric Pain Tool [11-14]. Other paper-and-pencil pain charts [15,16] and electronic diary methods [17-20] have been used in pediatric pain studies. Some research using pain charts has not yet been described in detail in published studies [Schanberg L, Roth-Isigkeit A, Zeltzer L, Pers. Comm.]. Two online examples of interactive pain charts are available [101,102].
A number of questions about children’s use of pain charts have yet to be addressed, as noted above.
How do pain charts compare with pain location checklists?
A checklist of pain locations can be scored more quickly and reliably than a pain chart. A short checklist is also quicker to complete for a skilled reader. However, the more precision that is required in locating separate sites of pain, the more unwieldy a checklist becomes. For example, it is easy to ask about arm pain, but it would take up more space and time to ask and answer the six questions needed to distinguish left versus right upper arm, elbow and forearm pain, whereas these would be quick to differentiate on a pain chart.
As far as we know, only one research group has directly compared a pain chart and a checklist of body locations given simultaneously to children [Roth-Isigkeit A, Pers. Comm.]. Their pain chart included front and back views of the whole body as well as separate close-ups of the front and back of the head. The checklist required yes/no responses to 12 questions as to whether the child had had any of the following pains in the previous 3 months: pain in the head, back, ear, stomach, lower abdomen, arm, leg, chest, throat, tooth, menstrual pain or other pain. In extensive pilot work with children, the pain chart response option was chosen less often and was filled out less completely than the verbal response categories listed in the checklist. (Individuals’ reasons for their preference were not sought.) Therefore, the pain chart was abandoned in subsequent versions of this instrument [2]. However, a different choice might be reached in a project in which a greater number of pain locations must be differentiated. The choice would also be influenced by whether measures are to be administered face-to-face, by telephone, by paper-and-pencil questionnaire, or on a smartphone, computer or other electronic device.
What is the best scoring method for research & clinical purposes?
Several ways of scoring pain charts have been described:
-
▪
In clinical practice, informal verbal description of the location indicated on the chart is often used. This method has the advantage of using only that level of specificity needed for diagnosis and treatment;
-
▪
For research in which the extent of pain is under study (i.e., the number and size of painful areas, rather than their specific location), a grid of squares can be placed over the pain chart, and the number of filled-in squares can be counted [21];
-
▪
Finally, a preselected set of pain locations can be demarcated on a transparent overlay, or using printed boundaries on the pain chart itself or, in the case of a computer-based pain chart, programmed ‘hot spots’ that automatically produce scores if clicked or touched with a stylus. Any mark added by the patient within the boundaries of a location is scored as positive for pain in that location [22].
Scoring methods vary as to their reliability and validity. In pilot work, we encountered challenges in scoring nondemarcated body maps. Without demarcations, the locations of different categories were subjective and dependent on the scorer. For example, the boundaries between chest and abdomen, or between head and neck, were not self-evident, and reliability was very low. Increasing the number of body locations from 7 to 15 decreased, but did not eliminate, discrepancies between scorers. The ambiguities encountered in scoring a nondemarcated body map were remedied with the application of a demarcated scoring template (transparent overlay) in conjunction with a stringent protocol, yielding near 100% scoring reliability.
What is the optimum number of body locations to be included in scoring systems for clinical & research purposes?
The optimum number of locations depends on the objectives and assumptions of the user. Broadly speaking, ‘lumpers’ will be content with demarcating and scoring a few large areas on the pain chart, while ‘splitters’ are concerned with detailed differences among many small areas. For example, studies in rheumatology might separately identify individual finger, toe and other joints [23], requiring a database that can accommodate 80 or more separate variables to express pain location. By contrast, investigators who are interested in the common psychological substrates of recurrent pain and coping, regardless of body location, may be content to distinguish far fewer and larger areas. For example, nine broad areas on a pain chart were identified in a study of coping with pain in young adults, and an important outcome was the proportion of those nine areas for which pain was reported [24].
A series of studies is currently underway entitled ‘SUPER-KIDZ: Ask Me Where It Hurts’ [25]. In a consensus exercise, that group has accepted a pain chart with 21 scored areas (Figure 1 & Table 1), which was regarded as a compromise usable by clinicians and investigators with a variety of interests and objectives. In this chart, the number of necessary variables for scoring is reduced by combining, for example, the left hand, right hand or both hands into a single field. It is hoped that the necessary evaluation of the utility and validity of this tool will be undertaken via studies by members of the SUPER-KIDZ research group and others.
Figure 1. Suggested pain chart for studies of recurrent and chronic pain adopted as part of the SUPER-KIDZ pain assessment project.
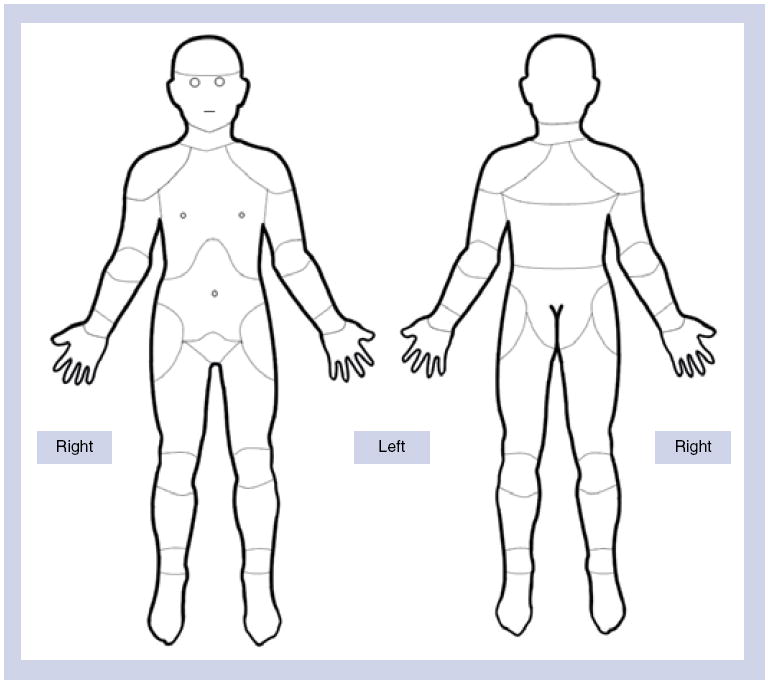
The chart is designed for paper or electronic administration. Instructions: “Color in [click] all the parts of your body where you have had pain in the past 2 weeks.” Instructions may be varied if necessary to show pain “right now”, or pain during a specified activity, or during a different period of time, or to show pain of di erent quality or intensity using different colors or symbols (areas for scoring are listed in Table 1).
Reproduced with permission from [104] © Childhood Arthritis and Rheumatology Research Alliance (CARRA; CA, USA).
Table 1.
Scoring the pain chart (see Figure 1).
| Area | Description | Front view only | Back view only | Either view, either side |
|---|---|---|---|---|
| 1 | Head (exclude face) | X | ||
| 2 | Face/jaw/temple | X | ||
| 3 | Throat/neck | X | ||
| 4 | Shoulder | X | ||
| 5 | Chest | X | ||
| 6 | Upper arm | X | ||
| 7 | Elbow | X | ||
| 8 | Forearm | X | ||
| 9 | Wrist | X | ||
| 10 | Hand | X | ||
| 11 | Abdomen | X | ||
| 12 | Hip | X | ||
| 13 | Groin/pubic area | X | ||
| 14 | Thigh | X | ||
| 15 | Knee | X | ||
| 16 | Calf | X | ||
| 17 | Ankle | X | ||
| 18 | Foot | X | ||
| 19 | Upper back | X | ||
| 20 | Mid back | X | ||
| 21 | Low back | X |
21 areas are identified on the map. Any mark in an area results in a score (yes or 1) for that area. Any area left blank gets a score of no or 0. Laterality is ignored: for example, a mark on the left foot, the right foot or both feet all score the same (yes for foot).
Investigators can score the map more finely if desired, or add demarcations or enlargements of areas of interest. This system is the suggested minimum.
How valid are children’s pain charts in representing their areas of pain?
Assessment of validity of responses on pain charts requires that they be compared with pain locations identified by other means. In one study [15], 32 children with recurrent pain, aged 4 through to 14 years, were asked ‘Where does it hurt?’ and also were asked to mark pain locations on a chart [26]. Responses were classified as consistent or inconsistent with the final confirmed diagnosis. Significantly more consistent (valid) responses were found in the pain chart condition (n = 27) than in the verbal condition (n = 18). In another study employing the Adolescent Pediatric Pain Tool in 175 hospitalized children [11], agreement was assessed between markings on the chart and patients’ pointing to body parts. Agreement ranged from 83% for the amount of surface area to 94% for locations among the 43 sites marked on the scoring template. Single surgical incision sites were identified with 98% accuracy.
What are the advantages of electronic versus paper-and-pencil administration?
Electronic and paper versions may be compared as to their reliability, validity, preference and other aspects of utility. In general, the greater initial cost and complexity of pain charts administered on the web or on a handheld computer or smartphone [17,18,23] may be balanced against their greater scoring reliability, preference on the part of children and efficiency in data acquisition. Beyond one pilot study [20], no published research has carried out this comparison specifically with respect to pain charts, but extensive literature is available on the analogous issues of electronic versus paper administration of pain diaries and pain intensity scales [27,103]. In general, electronic versions are preferred by children, and they eliminate inconsistencies in scoring. However, in computer-based systems, the validity of scoring depends on the accuracy of registration of pain locations as hot spots on the pain chart. Such hot spots are easy to program as rectangles, polygons, circles or check boxes, but difficult to render as anatomically accurate parts of the body pictured on the chart.
For what age range are pain charts appropriate?
No task analysis or cognitive developmental studies have been published in relation to pain charts. The concept of mapping is not familiar or intuitive to young children, although they may be able to point to a painful body part. A relevant experiment with 5 and 6 year olds showed that body maps do not facilitate accurate report of touch [28]. More than half of the touch locations reported by children on a body map were incorrect, even when the children were interviewed immediately afterward. The authors strongly recommended against use of body maps with children of this age [28]. Anecdotally, our own experience supports the observation that many children below the age of 8 years require adult guidance in completing a pain chart, which may bias their responses. Accurate left–right mapping may elude many children until adolescence.
Until further research is available, we recommend that unassisted pain charts be used only with children older than 7 years. For clinical purposes, many younger children may be able to complete pain charts with adult assistance, but the adults’ influence must be recognized.
Are technical details of the pain chart important in eliciting self-reports of pain?
Existing pain charts differ in many ways with respect to technical details. There is, as far as we know, no research on the impact of any of these features.
Visible versus nonvisible demarcations of areas of the body
Some pain charts provide a body outline without any markings to indicate the borders that are used in scoring. Other pain charts make the demarcations visible to the respondent. Visible demarcations might make the outline more complex and confusing. On the other hand, such demarcations might simplify the task because any mark in a demarcated area suffices, and the child does not have to be concerned with tracing the exact boundaries of the pain, which is often diffuse and poorly localized. Lines used to demarcate areas of the body need not be of the same weight and style as lines used for the body outline itself (e.g., Figure 1).
Clothing
Some children are believed to be embarrassed on presentation of apparently nude body outlines. There may be cultural and geographic variations in this respect. A complication of adding clothing is that it might, even if drawn transparently, be perceived by the child as covering (or demarcating) painful areas, which are then more difficult to indicate accurately. We have seen a number of clothed pain charts in which the clothing was colored in by the child: the clothing may be more salient and easy to color than the body outline itself. On the other hand, visible demarcations of parts of the body might reduce the respondent’s tendency to be embarrassed, as these could be seen as representing a covering for the body, distracting the child’s attention from the apparent nakedness of the body outline itself.
Ethnicity, gender & age-related features
Even very simple pain charts contain unintended cues as to the ethnicity, sex and age of the person portrayed. It is not known, for example, whether a picture printed in a black outline on a white background is perceived to be more like one ethnic/racial group than another, or whether this makes any difference in responses. Similarly, it is not known whether omitting hair and sexual characteristics from the pictures influences children’s identification with the gender of the manikin and hence their ability to locate the pain on it.
Size
On paper it is easy to present a pain chart that is large enough to see all the features clearly. The challenge is greater when the pain chart is to be presented on the small screen of a smartphone or handheld computer. In particular, small demarcated areas such as individual finger joints would be difficult to select on a small screen; therefore, some electronic pain charts contain magnified images of the areas or joints of particular interest. Moreover, the total number of areas that is easily discriminable is smaller on a small screen than on a full page on paper. A system intended for both electronic and paper administration might have to compromise on the number of areas scored.
What aspects of pain should be represented in a pain chart?
In principle, not only presence or absence, but many other aspects of pain can be represented on a pain chart (e.g., severity and sensory quality) using symbols, shading or colors. This flexibility has been exploited in pain charts designed for adults: in one example, burning, freezing, squeezing, lacerating and aching types of pain can be represented [102]. With children, however, more complex systems may be confusing, particularly if they require unfamiliar vocabulary. Further study is needed to establish the age at which most children are able to represent aspects other than presence or absence of pain.
The intensity of pain often varies in different locations within individuals. Treatment may reduce pain intensity in some locations and not others. Should pain intensity be measured:
-
▪
Separately for each painful site?
-
▪
As an average across all painful sites?
-
▪
Only for the single pain location of greatest concern?
Each of these alternatives has advantages and disadvantages. Separate scoring of pain intensity for each of the multiple sites leads to difficulties in statistical analysis, both because of the large number of data fields required, and also because each participant may have a different number of scores for intensity at each measurement occasion. On the other hand, for a child to provide a single average intensity score across multiple sites requires a complex judgment and weighting of the components of pain experience. A single pain intensity score for the most important site of pain is an oversimplification, but has the advantage of being easy to analyze and to compare across individuals and across time.
As a provisional recommendation, we suggest that pain intensity scores (least and worst for a specified period of time such as 2 weeks, as well as present pain intensity) normally be collected only for the one or two pain sites that are of greatest concern; that is, the main presenting problem(s). This can be done in a separate rating task and need not be part of the pain chart itself. Additional outcome variables derived from the pain chart can include presence or absence of pain in each demarcated area at each time point, and number of pain sites at each time point.
Discussion
Pain charts can assist children in recording the location of pain symptoms. Based on limited existing data, their use seems most appropriate for children aged 8 years and older, although many younger children can use them with adult assistance.
There are important distinctions between methods used for research and for clinical purposes. In clinical use, pain charts offer great flexibility for use of color and symbols to represent not only the presence and absence of pain, but its quality and intensity. These details must be developed collaboratively between individual patients and clinicians.
The fineness of differentiation of body locations will vary widely according to context. Generally, no numerical scoring of pain locations is needed in clinical use since the pain chart can be described verbally; pain intensity can be scored separately for one or two chief presenting complaints. On the other hand, in research, standardized, simple, numerical methods are required in order to ensure compliance and reliability of scoring, and to facilitate data analysis. The number of locations differentiated on the pain chart depends on the nature of the research, and no single solution can be offered. For example, research in rheumatology may require separate recording of symptoms in individual finger joints, which would be of no use in gastroenterology studies. The number of discrete locations in pain charts has ranged from nine to nearly 100. We recommend a compromise, adapted for use in research on treatment of recurrent and chronic pain, in which 21 locations are recorded; individual researchers may supplement these with closer examination of specific parts as needed.
We have suggested a number of avenues for research on pain charts, including cognitive developmental and practical aspects. Pain charts are not necessarily always the best way to elicit information about pain location. Checklists referring to particular body locations of interest may be more suitable in particular circumstances, such as when only a small number of locations are of interest.
Future perspective
Over the past decade, there has been increasing standardization of measures of pain intensity, such as the widespread adoption of the 0–10 metric in faces, visual analog and numerical scales. Over the next decade, we expect to see similar knowledge transfer and standardization in other aspects of assessment including pain location and quality. If future research supports the validity and utility of the new paper and electronic pain chart proposed in this paper, we might in future see it included in a streamlined and standardized initial assessment of pediatric pain complaints.
Acknowledgments
The authors thank G Walco, M Connelly and J Stinson for their comments on an earlier version of this paper.
This review was initiated following a consensus conference supported by the following grants: Stinson J, Connelly M, Chira P, McGrath PJ, Rapoff M, Schanberg L: Towards A Standardized Universal Pain Evaluation by Rheumatology Providers for Children (SUPER-KIDZ) with Arthritis and other Rheumatic Conditions (2009), a Mayday Fund grant, and Canadian Institutes of Health Research: Meetings, Planning and Dissemination Grant 90885. This review was also supported in part by Grant 1R01MH063779, awarded by the National Institute of Mental Health (Principal Investigator: MC Jacob).
Footnotes
Financial & competing interests disclosure The authors have no other relevant affiliations or financial involvement with any organization or entity with a financial interest in or financial conflict with the subject matter or materials discussed in the manuscript apart from those disclosed.
No writing assistance was utilized in the production of this manuscript.
Bibliography
Papers of special note have been highlighted as:
-
▪
of interest
- 1.Paananen MV, Auvinen JP, Taimela SP, et al. Psychosocial, mechanical, and metabolic factors in adolescents’ musculoskeletal pain in multiple locations: a cross-sectional study. Eur J Pain. 2010;14(4):395–401. doi: 10.1016/j.ejpain.2009.06.003. [DOI] [PubMed] [Google Scholar]
- 2.Roth-Isigkeit A, Ellert U, Kurth BM. Assessment of pain in the child and adolescent health survey. Gesundheitswesen. 2002;64(Suppl. 1):S125–S129. doi: 10.1055/s-2002-39012. [DOI] [PubMed] [Google Scholar]
- 3.van den Hoven LH, Gorter KJ, Picavet HS. Measuring musculoskeletal pain by questionnaires: the manikin versus written questions. Eur J Pain. 2010;14(3):335–338. doi: 10.1016/j.ejpain.2009.06.002.. ▪ Recent comparison of pain charts with written questions (in adults).
- 4.Melzack R. The McGill pain questionnaire: major properties and scoring methods. Pain. 1975;1(3):277–299. doi: 10.1016/0304-3959(75)90044-5. [DOI] [PubMed] [Google Scholar]
- 5.Margoles M. The pain chart: spatial properties of pain. In: Melzack R, editor. Pain Measurement and Assessment. Raven Press; NY, USA: 1983. pp. 215–225.. ▪ The earliest comprehensive discussion of ways to assess pain location.
- 6.Carnes D, Ashby D, Underwood M. A systematic review of pain drawing literature: should pain drawings be used for psychologic screening? Clin J Pain. 2006;22(5):449–457. doi: 10.1097/01.ajp.0000208245.41122.ac. [DOI] [PubMed] [Google Scholar]
- 7.Varni JW, Thompson KL, Hanson V. The Varni/Thompson Pediatric Pain Questionnaire. I. Chronic musculoskeletal pain in juvenile rheumatoid arthritis. Pain. 1987;28(1):27–38. doi: 10.1016/0304-3959(87)91056-6. [DOI] [PubMed] [Google Scholar]
- 8.Ameringer S. Measuring pain in adolescents. J Pediatr Health Care. 2009;23(3):201–204. doi: 10.1016/j.pedhc.2009.01.006. [DOI] [PubMed] [Google Scholar]
- 9.Walco GA, Dampier CD. Pain in children and adolescents with sickle cell disease: a descriptive study. J Pediatr Psychol. 1990;15(5):643–658. doi: 10.1093/jpepsy/15.5.643. [DOI] [PubMed] [Google Scholar]
- 10.Gragg RA, Rapoff MA, Danovsky MB, et al. Assessing chronic musculoskeletal pain associated with rheumatic disease: further validation of the pediatric pain questionnaire. J Pediatr Psychol. 1996;21(2):237–250. doi: 10.1093/jpepsy/21.2.237. [DOI] [PubMed] [Google Scholar]
- 11.Savedra MC, Holzemer WL, Tesler MD, Wilkie DJ. Assessment of postoperation pain in children and adolescents using the adolescent pediatric pain tool. Nurs Res. 1993;42(1):5–9. [PubMed] [Google Scholar]
- 12.Savedra M, Gibbons P, Tesler M, Ward J, Wegner C. How do children describe pain? A tentative assessment. Pain. 1982;14(2):95–104. doi: 10.1016/0304-3959(82)90091-4. [DOI] [PubMed] [Google Scholar]
- 13.Savedra MC, Tesler MD, Holzemer WL, Wilkie DJ, Ward JA. Pain location: validity and reliability of body outline markings by hospitalized children and adolescents. Res Nurs Health. 1989;12(5):307–314. doi: 10.1002/nur.4770120506.. ▪ The most direct evaluation of the validity and reliability of pediatric pain charts.
- 14.Savedra MC, Tesler MD. Assessing children’s and adolescents’ pain. Pediatrician. 1989;16(1–2):24–29. [PubMed] [Google Scholar]
- 15.O’Donnell PJ, Curley H. Validation of a nonverbal instrument for pain location descriptions in children. Percept Mot Skills. 1985;60(3):1010. doi: 10.2466/pms.1985.60.3.1010. [DOI] [PubMed] [Google Scholar]
- 16.Zebracki K, Drotar D. Pain and activity limitations in children with Duchenne or Becker muscular dystrophy. Dev Med Child Neurol. 2008;50(7):546–552. doi: 10.1111/j.1469-8749.2008.03005.x. [DOI] [PubMed] [Google Scholar]
- 17.Palermo TM, Valenzuela D, Stork PP. A randomized trial of electronic versus paper pain diaries in children: impact on compliance, accuracy, and acceptability. Pain. 2008;107(3):213–219. doi: 10.1016/j.pain.2003.10.005.. ▪ Use of pain charts in electronic versus paper format.
- 18.Stinson JN, Petroz GC, Tait G, et al. e-Ouch: usability testing of an electronic chronic pain diary for adolescents with arthritis. Clin J Pain. 2006;22(3):295–305. doi: 10.1097/01.ajp.0000173371.54579.31.. ▪ Approach to assessing the usability of an electronic diary including a pain chart.
- 19.Calam RM, Jimmieson P, Cox AD, Glasgow DV, Larsen SG. Can computer-based assessment help us understand children’s pain? Eur J Anaesthesiol. 2000;17(5):284–288. doi: 10.1046/j.1365-2346.2000.00655.x. [DOI] [PubMed] [Google Scholar]
- 20.Cushing C, Connelly M, Lathram N, Schurman J. Initial development and testing of an electronic assessment tool for pediatric pain. Poster, Society for Behavioral Medicine. Ann Behav Med. 2010;39(Suppl. 1):S150. [Google Scholar]
- 21.Ohnmeiss DD. Repeatability of pain drawings in a low back pain population. Spine. 2000;25(8):980–988. doi: 10.1097/00007632-200004150-00014. [DOI] [PubMed] [Google Scholar]
- 22.Margolis RB, Tait RC, Krause SJ. A rating system for use with patient pain drawings. Pain. 1986;24(1):57–65. doi: 10.1016/0304-3959(86)90026-6. [DOI] [PubMed] [Google Scholar]
- 23.Connelly M, Anthony KK, Sarniak R, Bromberg MH, Gil KM, Schanberg LE. Parent pain responses as predictors of daily activities and mood in children with juvenile idiopathic arthritis: the utility of electronic diaries. J Pain Symptom Manage. 2010;39(3):579–590. doi: 10.1016/j.jpainsymman.2009.07.013. [DOI] [PMC free article] [PubMed] [Google Scholar]
- 24.Lester N, Lefebvre JC, Keefe FJ. Pain in young adults – III: Relationships of three pain-coping measures to pain and activity interference. Clin J Pain. 1996;12(4):291–300. doi: 10.1097/00002508-199612000-00008. [DOI] [PubMed] [Google Scholar]
- 25.Stinson J, Connelly M, Chalom E, et al. Ask me where it hurts? Developing a standardized approach to the assessment of pain in children and youth presenting to pediatric rheumatology providers. Arthritis Rheum. 2009;60(Suppl. 10):S577. doi: 10.1186/1546-0096-10-7. [DOI] [PMC free article] [PubMed] [Google Scholar]
- 26.Tesler M, Ward J, Savedra M, Wegner CB, Gibbons P. Developing an instrument for eliciting children’s description of pain. Percept Mot Skills. 1983;56(1):315–321. doi: 10.2466/pms.1983.56.1.315. [DOI] [PubMed] [Google Scholar]
- 27.Stinson JN, Stevens BJ, Feldman BM, et al. Construct validity of a multidimensional electronic pain diary for adolescents with arthritis. Pain. 2008;136(3):281–292. doi: 10.1016/j.pain.2007.07.002. [DOI] [PubMed] [Google Scholar]
- 28.Willcock E, Morgan K, Hayne H. Body maps do not facilitate children’s reports of touch. Appl Cognit Psychol. 2006;20:607–615.. ▪ Highlights limitations of body maps with a young child (assessing nonpainful touch).
Websites
- 101.Body map from web-based diary study. Connelly M, et al. [30 June 2010]; pilot test, www.poweredbyu.com/bodymap.
- 102.Iconic Pain Assessment Tool. [30 June 2010]; www.emiliemcmahon.ca/pain-tool.html.
- 103.Goodenough B, Piira T, von Baeyer CL, et al. Comparing six self-report measures of pain intensity in children. The Suffering Child. 2005:8. www.usask.ca/childpain/research/6scales/6scales.pdf (Version current on 22 May 2010)
- 104.Childhood Arthritis and Rheumatology Research Alliance. [30 June 2010]; www.carragroup.info.