

Abstract
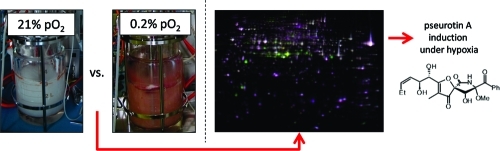
The mold Aspergillus fumigatus is the most important airborne fungal pathogen. Adaptation to hypoxia represents an important virulence attribute for A. fumigatus. Therefore, we aimed at obtaining a comprehensive overview about this process on the proteome level. To ensure highly reproducible growth conditions, an oxygen-controlled, glucose-limited chemostat cultivation was established. Two-dimensional gel electrophoresis analysis of mycelial and mitochondrial proteins as well as two-dimensional Blue Native/SDS-gel separation of mitochondrial membrane proteins led to the identification of 117 proteins with an altered abundance under hypoxic in comparison to normoxic conditions. Hypoxia induced an increased activity of glycolysis, the TCA-cycle, respiration, and amino acid metabolism. Consistently, the cellular contents in heme, iron, copper, and zinc increased. Furthermore, hypoxia induced biosynthesis of the secondary metabolite pseurotin A as demonstrated at proteomic, transcriptional, and metabolite levels. The observed and so far not reported stimulation of the biosynthesis of a secondary metabolite by oxygen depletion may also affect the survival of A. fumigatus in hypoxic niches of the human host. Among the proteins so far not implicated in hypoxia adaptation, an NO-detoxifying flavohemoprotein was one of the most highly up-regulated proteins which indicates a link between hypoxia and the generation of nitrosative stress in A. fumigatus.
Keywords: Aspergillus fumigatus, proteome analysis, hypoxia, pseurotin A, chemostat, mitochondria
Short abstract
Aspergillus fumigatus is a ubiquitously distributed filamentous fungus and an important human pathogen. To colonize the human lung, A. fumigatus has to adapt to low oxygen concentrations. We analyzed the cytosolic and mitochondrial proteome of A. fumigatus under normoxic in comparison to hypoxic conditions using an oxygen-controlled chemostat. Hypoxia led to an increased respiratory capacity, induction of the biosynthesis of the secondary metabolite pseurotin A and presumably nitrosative stress.
Introduction
The environmental mold Aspergillus fumigatus has become the most important airborne fungal pathogen of humans and is the second most frequent cause of systemic fungal infections.(1) In immunocompetent individuals, A. fumigatus can cause allergic reactions and noninvasive infections such as aspergilloma. However, in immunocompromised patients, this filamentous fungus is the main causative agent for life-threatening systemic infections named invasive aspergillosis (IA). Due to the improvements in transplant medicine and the therapy of hematological malignancies, the number of patients and thus the quantity of cases of IA has increased significantly in the last decades. Specific diagnostics are still limited, as are the possibilities of therapeutic intervention, leading to a high mortality rate of 30 up to 90% for IA.2,3 Infection is most commonly initiated by inhalation of airborne fungal spores (conidia), which germinate in the lung alveoli and the formed hyphae start to grow invasively into the lung tissue. Accumulating evidence suggests that A. fumigatus experiences hypoxia while growing in the lung.4−6 The oxygen partial pressure within the alveoli averages at 7.9 kPa (19.7 kPa in the atmosphere). In the surrounding tissue, it drops down to 2−4 kPa and in inflamed, necrotic areas even down to 0.13 kPa.(7) This can lead on one hand to a general reduction of phagocyte killing by the host, but on the other hand may promote the availability of free iron for the pathogen due to a decrease in redox potential.(8) Additionally, nitric oxide (NO) secreted by cells of the innate immune system, such as macrophages, acts as an inhibitor of cellular respiration and can cause so-called metabolic hypoxia.(9) Thus, it is obvious that A. fumigatus has to adapt to low oxygen partial pressures during the infection. However, the fungus is considered to be an obligate aerobe and there is no clear evidence for either a fermentative metabolism or anaerobic respiration in A. fumigatus. Nevertheless, some hints for ethanol fermentation during A. fumigatus infection were obtained in a murine model of IA(10) and A. fumigatus was shown to be capable of growing at low oxygen concentrations between 0.1% (v/v) and 0.5% (v/v) on agar plates.(11) Under these conditions, the fungus faces the challenge to maintain the homeostasis of ergosterol and other cellular components, such as NAD and heme, whose biosyntheses require molecular oxygen.(12)
It is very likely that A. fumigatus has evolved mechanisms to cope with hypoxic growth conditions, but the details of the genetic and biochemical response of A. fumigatus to hypoxia has not been described in detail yet. Recent discoveries in the nonpathogenic fission yeast Schizosaccharomyces pombe(13) and the pathogenic encapsulated yeast Cryptococcus neoformans(14,15) have led to the elucidation of a central regulatory pathway activated in response to hypoxia. Here, O2 deprivation is indirectly sensed by measuring the level of ergosterol in the cell and is designated as the sterol response element binding protein (SREBP) pathway. The ER-bound transcription factor Sre1p is activated upon hypoxia due to a decrease of the ergosterol content.(16) This allows Sre1p to enter the nucleus and to activate genes essential for hypoxic growth.(17) The orthologue in A. fumigatus, SrbA was shown to be involved in hypoxic adaptation and virulence.6,10 An SrbA null mutant was unable to grow under hypoxic condition, was more sensitive to antifungal azoles, and was avirulent in a mouse infection model for IA.(6)
Target genes of the hypoxic regulator SrbA have not been studied in fully detail yet and global transcript profiling of the response of pathogenic fungi to low oxygen levels revealed a relative heterogeneous picture on hypoxia-responsive genes. In the pathogenic dimorphic yeast Candida albicans, genes involved in fermentative metabolism were up-regulated, whereas genes regulating oxidative metabolism were down-regulated by hypoxia.(18) By contrast, the transcript levels of respiratory genes increased in C. neoformans during exposure to hypoxic growth conditions.(15) In A. fumigatus, transcriptional profiling of the srbA null mutant revealed an SrbA-dependent regulation of genes involved in ergosterol biosynthesis, cell wall biosynthesis and transport processes.(6) In contrast, regulation of the hypoxic response on the level of proteins has not been elucidated in A. fumigatus or any other important human-pathogenic fungi yet. For this reason, we carried out global analysis of the change of the A. fumigatus proteome during hypoxia by two-dimensional gel fluorescence gel electrophoresis (DIGE). Because of the advantages in generating more reproducible, reliable and biologically homogeneous data sets, we used an oxygen-controlled chemostat(19) to cultivate A. fumigatus either under normoxic (21% O2) or under hypoxic (0.2% O2) conditions. By our proteome analysis we have shown that A. fumigatus compensates the depletion of molecular oxygen by the increased production of respiratory proteins and that a link exists between hypoxia and nitrosative stress. Furthermore, for the first time we report that hypoxia is able to induce the activation of an otherwise silent secondary metabolite gene cluster in A. fumigatus.
Experimental section
Strain and Culture Conditions
The Aspergillus fumigatus wild-type strain ATCC 46645 was used for this study. A. fumigatus was grown at 37 °C in a glucose-limited oxystat (chemostat with constant oxygen partial pressure [pO2]) (Biostat B, Braun, Melsungen, Germany) in continuous culture (3 L working volume) with constant stirring (550 rpm). The dissolved oxygen was measured with a high sensitive pO2 electrode (InPro6800/12/320, Mettler Toledo, Steinbach, Germany) connected to a data amplifier in a range of 0 − 10% pO2 (8842698 Braun, Melsungen, Germany). This setting allowed detecting low oxygen concentrations of up to 0.2% O2. Aerobic culture conditions were established (21% O2 atmospheric pO2) by aerating with 0.8 L/min of air. Under hypoxic culture conditions (0.2% O2), the medium was continuously aerated with a mixture of nitrogen at a constant rate (0.65 L/min) and air. The influx of air was controlled manually. The fungus was cultivated in Aspergillus minimal medium (AMM) as described in.(20) The medium contained 8.3 mM glucose as sole carbon source. The fermenter was inoculated with conidia to give a final concentration of 3 × 10⁵ conidia/mL. Fermentation started as a batch culture for 20 h under aerobic and 30 h under hypoxic (2% pO2 for the initial batch cultivation) conditions. Subsequently, the dilution rate was set to 0.08 h−1 (correspond to a flow rate of 240 mL/h). Samples were taken during fermentation to determine pH-value, glucose concentration (BIOSEN C-Line, EKF Diagnostic, Barleben, Germany) and dry weight biomass (HR73 Halogen Moisture Analyzer, Mettler Toledo, Steinbach, Germany). After reaching the steady state (constant biomass, constant pO2, constant pH, sixteen times exchange of culture volume, glucose-limitation) the whole biomass was harvested, immediately rinsed with tap water, pressed to remove any liquid and the dried mycelium was immediately frozen in liquid nitrogen for further protein and RNA extraction procedures or directly used for mitochondria isolation. The culture supernatant was collected and stored at −20 °C for further analysis.
Sample Preparation for 2-D Gel Electrophoresis
Frozen mycelium was ground in a mortar in the presence of liquid nitrogen. Proteins from 100 mg of this homogenate were extracted by the phenol extraction methanol/ammonium acetate precipitation method as described in(21) with slight modifications. After overnight precipitation the sample was centrifuged at 3200× g for 15 min at 4 °C, the supernatant was removed and the pellet was rinsed three times with ice-cold acetone/0.3% (wt/vol) dithiothreitol. The pellet was air-dried and resuspended in 300 μL lysis buffer (7 M urea, 2 M thiourea, 2% [wt/vol] CHAPS, 1% [wt/vol] Zwittergent 3−10 and 20 mM Tris), sonicated for 10 min in an ultrasonic bath and incubated for 1 h at room temperature.(22) The pH of the samples was adjusted to 8.5 by using 100 mM NaOH. A. fumigatus mitochondria were isolated as described previously.(23) For 2-DE, mitochondrial pellets (100 mg moist mass) were resuspended in 400 μL lysis buffer containing 2.8% (wt/vol) dodecylmaltoside.
Protein Quantification
The protein concentration was determined according to the method of Bradford(24) using the BIO-RAD protein assay (BIO-RAD Lab., Hertfordshire, U.K.).
2-D Gel Electrophoresis Analysis
The DIGE (difference in gel electrophoresis) technique was used to analyze protein samples of mycelium cultivated under normoxic and hypoxic conditions and carried out as described.(25) Samples from three independent normoxic and hypoxic cultivations were labeled with CyDye minimal dyes according to the manufacturer’s protocol with slight modifications (GE Healthcare Bio-Sciences, Munich Germany). 50 μg of protein of each sample were labeled with 300 pmol of CyDye DIGE flourophores (dissolved in dimethyl formamide). Samples obtained from normoxic (21% pO2) and hypoxic (0.2% pO2) conditions were labeled either with Cy3 or Cy5. A pool of all six samples (3 × normoxic and 3 × hypoxic) was prepared, labeled with Cy2, and used as a global internal standard. Samples were mixed and incubated for 30 min in the dark on ice. The reaction was stopped by adding 1 μL of 10 mM l-lysine. An equal volume of 4× sample buffer (composition described above for the lysis buffer, plus 3.2% [vol/vol] SERVALYT ampholytes 3−10 [SERVA Electrophoresis, Heidelberg, Germany] and 40 mM DTT) was added. Equal amounts of each of the three label preparations were combined and mixed with 50 μg unlabeled protein extract of both growth conditions (to increase the protein amount for subsequent mass spectrometry analysis) and applied via anodic cup loading to IPGstrips (GE Healthcare Bio-Sciences). Isoelectric focusing was carried out as described previously(22) using 24 cm IPG strips with a nonlinear pH range from pH 3 to 11, which had been rehydrated overnight (7 M urea, 2 M thiourea, 2% [wt/vol] CHAPS (3-[(3-cholamidopropyl)-dimethylammonio]-1-propanesulfonate), 1% [wt/vol] Zwittergent 3−10, 0.002% [wt/vol] bromophenol blue, 0.5% [vol/vol] IPG buffer, 1.2% [vol/vol] De-Streak reagent [GE Healthcare Bio-Sciences]). After separation by the first dimension the strips were equilibrated for 15 min in 10 mL of equilibration buffer (6 M urea, 30% [vol/vol] glycerol, 2% [wt/vol] SDS (sodium dodecyl sufate), 75 mM Tris, 0.002% [wt/vol] bromophenol blue) containing 1% (wt/vol) dithiothreitol and subsequently for 15 min in 10 mL of equilibration buffer containing 2.5% (wt/vol) iodoacetamide. For the separation of proteins in the second dimension, the Ettan DALT System (GE Healthcare Bio-Sciences) was used. SDS polyacrylamide gels [11−16% (wt/vol)] of 1.0 mm thickness were casted with the a2DEoptimizer (Biometra, Göttingen, Germany). Separation conditions were as follows: 2 W/gel for 1 h followed by 15 W/gel for 4 h. Proteins were visualized by analyzing the gels with a Typhoon 9410 scanner (GE Healthcare Bio-Sciences) using a resolution of 100 μm. Spot detection of cropped images was performed with the DeCyder software package (version 6.5). The following parameters were applied: detection sensitivity, 2500 spots (excluding filter set); slope, >2.1; area, <200; peak height, <600; and area, <10 000. Changes in the abundance of protein spots were regarded as significant with a threshold of 2-fold standard deviation difference. Gels of six independent experiments were analyzed with the BVA software, and average ratios as well as t test values for each spot were calculated. Only spots with a t test value below 0.05 were regarded as significant. After scanning, the gels were stained with ruthenium II tris (bathophenanthroline disulfonate) according to Rabilloud(26) and Lamanda(27) and protein spots were excised manually on a dark reader transilluminator (DR-88M, Clare Chemical Research, Dolores, CO). Protein spots were tryptically digested according to the protocol of Shevchenko.(28) Extracted peptides were identified on an Ultraflex I MALDI-TOF/TOF device using flexControl 3.0 for data collection and flexAnalysis 3.0 spectra analysis/peak list generation (Bruker Daltonics, Germany) as described.(23) Peptide mass fingerprint (PMF) and peptide fragmentation fingerprint (PFF) spectra were submitted to the MASCOT server (MASCOT 2.1.03, Matrix Science, U.K.), searching the NCBI database limited to the taxon Fungi. With respect to the sample preparation, fixed modification of cysteine thiols to S-carbamidomethyl derivatives and variable methionine oxidation were defined for the database search. Further, up to one missed cleavage, and a peptide mass tolerance of 50 ppm was allowed. Results were regarded as significant with an allowed likelihood for a random hit of p ≤ 0.05, according to the MASCOT score. All proteome data were imported into our in-house data warehouse Omnifung(29) (http://www.omnifung.hki-jena.de), which is based on Protecs (Decodon, Germany). Identified proteins were classified with the FungiFun annotation tool as described in Priebe et al.(30)
Two Dimensional Blue-Native/SDS-PAGE
A. fumigatus mitochondria were solubilized by a dodecylmaltosid solution (750 mM amino caproic acid, 50 mM Bis(2-hydroxyethyl)-imino-tris(hydroxymethyl)-methane, 0.5 mM EDTA, pH 7.0, 1% [wt/vol] dodecylmaltoside) and the protein concentration was determined using the Bradford assay. 170 μg mitochondrial protein were separated on a two-dimensional blue-native/SDS-PAGE as described.31,32 Proteins were visualized by Coomassie staining. Quantification of the spot volume was achieved by using ImageQuant 5.2 (GE Healthcare).
Immunofluorescence and Confocal Laser Scanning Microscopy (CLSM)
To 500 μL of A. fumigatus culture grown in a chemostat under normoxic or hypoxic condition 5 μL Mito Tracker Red FM was added (Invitrogen, Germany) and was incubated for 1 h at 37 °C. Afterward the mycelium was washed three times with phosphate buffered saline (PBS). Fluorescence microscopic analysis was performed with an Axiovert 200 M/LSM 5 live confocal laser scanning microscope (Zeiss, Jena, Germany). Fluorescence signals were detected using a 560−675 nm band-pass filter. Images were obtained using the ZEN 2008 software (Zeiss).
Determination of the Oxygen Consumption Rate
Determination of the respiration rates of A. fumigatus hyphae were performed with an oxygen monitor (YSI 5300, YSI Life Sciences, Yellow Springs, OH) equipped with polarographic Clark-type electrodes. One mL of A. fumigatus culture grown in a chemostat under normoxic or hypoxic condition were added to 4 mL fresh AMM and applied to the sample chamber. The depletion of dissolved oxygen in AMM was measured for 20 min at 37 °C under continuous stirring under atmospheric oxygen partial pressure. Measurements were conducted in triplicate. Pure AMM was set as 100% oxygen saturation. Oxygen consumption rates were expressed as percent O2 consumed per minute per mg mycelium dry weight.
Northern blot analysis
Northern blot analysis was performed as previously described.(33) The oligonucleotides used for amplifying DIG-labeled probes are shown in Supplementary Table 1S (Supporting Information).
Extraction, HPLC and LC−MS Analysis
The culture filtrates were exhaustively extracted with ethyl acetate, the resulting extracts were dried with sodium sulfate and concentrated under reduced pressure. For HPLC analysis the extracts were dissolved in 500 μL of methanol. Analytical HPLC was performed on a Shimadzu LC-10Avp series HPLC system consisting of an autosampler, high pressure pumps, column oven and PDA. HPLC conditions: C18 column (Eurospher 100−5 250 × 4.6 mm) and gradient elution (MeCN/0.1% (v/v) TFA 0.5/99.5 in 30 min to MeCN/0.1% (v/v) TFA 100/0, MeCN 100% for 10 min), flow rate 1 mL min−1; injection volume: 20 μL. LC−MS measurements were performed using a Surveyor HPLC system (Thermo Electron, Bremen) coupled to a Finnigan LCQ benchtop mass spectrometer with an electrospray ion source. HPLC conditions: gradient elution (MeCN/0.1% (v/v) HCOOH 2/98 in 30 min to MeCN/0.1% (v/v) HCOOH 98/2; flow rate 0.6 mL min−1). Pseurotin A was identified by comparison with an authentic standard (obtained from Alexis Biochemicals, Lörrach, Germany).
Isolation of RNA and First-Stranded cDNA Synthesis from Infected Mice Lungs
Eight week-old female CD-1 mice were infected with 1 × 10⁵ conidia of the A. fumigatus wild-type strain CBS 144.8S. Immunosuppression and infection was performed as described previously.(34) Mice were monitored for weight loss and physical conditions and sacrificed when moribund. Mice were cared for in accordance with the principles outlined by the European Convention for the Protection of Vertebrate Animals Used for Experimental and Other Scientific Purposes (European Treaty Series, no. 123 [http://conventions.coe.int/treaty/Default.asp]). Lungs of two mice, which were sacrificed on day four and five were directly removed and stored in RNAlater (Ambion Europe, Huntingdon, U.K.) until further processing. RNA isolation and cDNA synthesis were performed as described.(35)
Isolation of RNA and First-Stranded cDNA Synthesis from A. fumigatus Mycelia
Harvested mycelium was directly frozen in liquid nitrogen as described above, and ground to a fine powder. One-hundred milligrams were used for RNA isolation and subsequent cDNA synthesis as described above.
Quantitative Real Time-PCR
qRT-PCR was performed on a Corbett Rotor Gene 6000 (Qiagen, Hilden, Germany) Real-Time PCR system in triplicate for each sample. The A. fumigatus actin gene act1 (AFUA_6G04740) was used as reference gene to calculate the expression levels of the genes of interest. The cDNA samples from the in vitro and in vivo experiments were 250 times diluted and undiluted, respectively, used for amplification. To obtain SYBRGreen-labeled PCR fragments (DyNAmo Flash SYBR Green qPCR Kit, Finnzymes, Espoo, Finland) the gene-spezific primers AFUA_8G00540_qRT-PCR-for 5′ GAA GAC CAC AGT CAT CGA CC 3′, AFUA_8G00540_qRT-PCR-rev 5′ TTA ACA CTT GCC CGT AGC GG 3′, AFUA_8G00550_qRT-PCR-for 5′ GCA CCT GGC TTC GCA ATG T 3′, AFUA_8G00550_qRT-PCR-rev 5′ GCA CGT TCT TCA AGC CGG 3′, AFUA_6G04740_qRT-PCR-for 5′ GCT TTG CTA CGT CGC TCT CG 3′ and AFUA_6G04740_qRT-PCR-rev 5′ GGA GGA GCA ATG ATC TTG ACC 3′ were used. The size of the PCR amplicons of AFUA_8G00540, AFUA_8G00550 and AFUA_6G04740 were 252, 416 and 353bp, respectively. The cycling parameters included an initial DNA denaturation step at 95 °C for 15 min, followed by 40 cycles with DNA denaturation at 95 °C for 15 s, primer annealing at 60 °C for 30 s and extension at 72 °C for 30 s. Controls with no added template were included for each primer pair to exclude primer dimers interfering with amplification detection. qRT-PCR results were analyzed using Rotor Gene software 1.7 (Qiagen, Hilden, Germany). Relative expression levels for each cDNA sample were obtained via normalization to actin using the formula 2−ΔCt [2−(Ct AFUA_8G00540−Ct actin), 2−(Ct AFUA_8G00550−Ct actin)] for all samples.
Heme and Metal Measurement
Porphyrins were quantified by HPLC with UV and fluorescence detection and normalized to the sample protein content as described.(36) For determination of the total cellular iron, copper, zinc and manganese content the freeze-dried mycelia was decomposed in closed polytetrafluorethylene vessels containing 2 mL of HNO3 and 0.5 mL of hydrogen peroxide using a high-performance microwave digestion unit (mLs-1200 mega) as described.(37) The mentioned metals were determined by inductively coupled plasma-atomic emission spectroscopy (ICP-AES).(38)
Measurement of the Intracellular NAD(P)+/NAD(P)H Concentrations
Pyridine nucleotides were quantified using the Amplite Colorimetric NAD(P)+/NAD(P)H Assay Kit (BioMol, Hamburg, Germany) according to the manufacturer’s instructions. Fifty micrograms of ground mycelium were treated with 1 mL PBS buffer, incubated on ice and centrifuged. The supernatant was used to determine the ratio of NAD(P)+/NAD(P)H in a plate reader (FLUOstar Omega, BMG LABTECH, Offenburg, Germany) at 575 nm.
Results
Proteome Analyses of the Adaptation of A. fumigatus to Hypoxia
To study the adaptation mechanism of A. fumigatus to hypoxia, we analyzed the proteomes of A. fumigatus wild-type strain grown either under normoxic (21% pO2) or hypoxic (0.21% pO2) conditions (Figure 1). Therefore, we established continuous cultivation for A. fumigatus in a fermenter system, which allowed to culture A. fumigatus at different defined oxygen partial pressures while keeping constant all other cultivation parameter (pH, temperature, nutrition supply, dilution rate/growth rate, glucose limitation). To determine the optimal dilution rate (equal to the growth rate in the chemostat at steady state) for the continuous cultivation of A. fumigatus, we performed batch fermentations to define the maximal growth rate (μmax) of A. fumigatus under different oxygen concentrations (Supplementary Figure 1, Supporting Information). The μmax values of A. fumigatus were determined with 0.11 h−1 and 0.25 h−1 for cultivation under hypoxic and normoxic growth conditions, respectively. To ensure the same growth rate of A. fumigatus under normoxic and hypoxic culture conditions, we applied a dilution rate of 0.08 h−1 during chemostat cultivation. A culture volume of 3 L and a dilution rate of 0.08 h−1 led to a flow rate of 240 mL/h. The glucose concentration was set to 8 mM in the feed medium, which resulted in a biomass of around 750 mg dry weight/L. These settings turned out to be optimal for continuous cultivation of A. fumigatus and, at the same time, prevented clogging of the outlet tube. Steady state (constant biomass, pH value, and glucose depletion) was reached after 72−96 h.
Figure 1.

2D gel electrophoresis of protein extracts of A. fumigatus grown under hypoxic (Cy5, green) and normoxic conditions (Cy3, purple). Proteins were stained with the difference in gel electrophoresis (DIGE) labeling technique. The orientation of the IEF is indicated. The spot numbers refer to differentially synthesized proteins under hypoxic growth conditions (see Table 1).
The results of the proteome analyses are summarized in Figure 1, Table 1 and Table S2 (Supporting Information). Fifty-nine protein spots showed an increased while 31 protein spots showed a decreased standard abundance of >1.5 fold (2-fold standard deviation) in extracts of A. fumigatus mycelia grown under hypoxic conditions. Several proteins appeared as multiple spots on the gels with the same apparent molecular mass, but with varying pI values and abundance, probably due to post-translational modifications or isoenzyme variation, for example, thiamine biosynthesis protein (Nmt1) and acetyl-coenzyme A synthetase (FacA). Hence, the identified 90 protein spots represented 65 different proteins (Figure 1 and Table 1). The protein spot number was assigned to the protein spot with the highest change in intensity (Figure 1).
Table 1. Differentially Synthesized Proteins of A. fumigatus under Hypoxia in Comparison to Normoxic Conditions.
| spot no.a | putative function and protein name (AFUA_...)b | ratioc |
|---|---|---|
| Translation initiation, translation and protein biosynthesis | ||
| 1 | Translation elongation factor eEF-3 (7G05660) | 2.20 |
| 2 | Translation elongation factor EF-Tu (1G12170) | 3.33 |
| Amino acid metabolism | ||
| 3 | Aminotransferase family protein (2G13295) | 1.87 |
| Aspartate | ||
| 4 | Aspartate aminotransferase (4G10410) | 1.73 |
| Glutamate | ||
| 5 | Glutamate/Leucine/Phenylalanine/Valine-DH (4G06620) | 1.96 |
| Lysine | ||
| 6 | Isocitrate-DH LysB (6G07390) | 1.67 |
| 7 | Saccharopine-DH Lys9 (4G11340) | 1.62 |
| Methionine | ||
| 8 | S-adenosylmethionine synthetase (1G10630) | 1.88 |
| Arginine | ||
| 9 | Argininosuccinate lyase (3G07790) | 2.58 |
| 10 | Argininosuccinate synthase (2G04310) | 1.74 |
| 11 | Ornithine carbamoyltransferase (4G07190) | 6.10 |
| Protein folding | ||
| 12 | Mitochondrial Hsp70 chaperone (2G09960) | 1.86 |
| 13 | Peptidyl-prolyl cis/trans isomerase (2G08550) | −1.62 |
| Oxidative and nitrosative stress | ||
| 14 | Allergen Asp F3 (6G02280) | 3.38 |
| 15 | Mycelial catalase Cat1 (3G02270) | −3.42 |
| 16 | Thioredoxin (8G01090) | −1.66 |
| 17 | Flavohemoprotein (4G03410) | 12.46 |
| Secondary metabolism | ||
| 18 | Alpha/beta hydrolase (8G00530) | 2.22 |
| 19 | Protein of unknown function (8G00430) | 5.85 |
| 20 | Methyltransferase SirN-like (8G00550) | 7.31 |
| 21 | Steroid monooxygenase (8G00440) | 2.73 |
| 22 | O-methyltransferase GliM-like (3G12910) | 3.32 |
| Cytoskeleton/Septum-associated structure | ||
| 23 | ARP2/3 complex 34 kDa subunit (1G02670) | 2.05 |
| 24 | Actin-binding protein (2G14270) | −2.67 |
| 25 | Septin (5G03080) | −1.69 |
| 26 | Septin AspB (7G05370) | −2.11 |
| 27 | Woronin body protein HexA (5G08830) | −1.70 |
| Sulfate assimilation | ||
| 28 | 3′(2′),5′-Bisphosphate nucleotidase (6G09070) | −1.62 |
| 29 | ATP sulphurylase (3G06530) | −1.54 |
| Fatty acid metabolism | ||
| 30 | Fatty acid activator Faa4 (2G09910) | −1.67 |
| 31 | 2-Methylcitrate dehydratase (6G03730) | −1.61 |
| 32 | Acetyl-coenzyme A synthetase (4G11080) | −4.07 |
| Carbohydrate interconversion | ||
| 33 | UTP-glucose-1-phosphate uridylyltransferase Ugp1 (7G01830) | −1.52 |
| 34 | Phosphoglucomutase PgmA (3G11830) | −1.79 |
| 35 | UDP-glucose 4-epimerase (5G10780) | 4.82 |
| Pentose phosphate pathway | ||
| 36 | 6-Phosphogluconate-DH Gnd1 (6G08050) | 1.83 |
| 37 | Transaldolase (5G09230) | 3.00 |
| Cellular one-carbon pathways | ||
| 38 | Serine hydroxymethyltransferase (3G09320) | 1.80 |
| Glycolysis/Pyruvate metabolism | ||
| 39 | Glyceraldehyde 3-phosphate-DH (5G01030) | 3.44 |
| 40 | Phosphoglycerate kinase PgkA (1G10350) | 1.74 |
| 41 | Pyruvate-DH complex, dihydrolipoamide acetyltransferase component (7G05720) | 1.70 |
| 42 | Pyruvate-DH E1 component alpha subunit (1G06960) | 1.67 |
| TCA cycle | ||
| 43 | Dihydrolipoamide succinyltransferase (3G05370) | 1.88 |
| NAD(P)+regeneration | ||
| 44 | Fumarate reductase Osm1 (8G05530) | −1.51 |
| 45 | Succinate-semialdehyde-DH (3G07150) | −1.59 |
| Electron transport and oxidative phosphorylation | ||
| 46 | Cytochrome c oxidase polypeptide vib (2G13010) | 2.03 |
| 47 | Cytochrome c oxidase subunit Via (3G06190) | 1.75 |
| 48 | Cytochrome c subunit Vb (2G03010) | 1.82 |
| 49 | Mitochondrial F1 ATPase subunit alpha (8G05320) | 1.75 |
| 50 | Ubiquinol-cytochrome c reductase iron−sulfur subunit precursor (5G10610) | 1.58 |
| 51 | NADH-cytochrome b5 reductase (1G04540) | 1.83 |
| 52 | Quinone oxidoreductase (5G11430) | −2.00 |
| Vitamin and cofactor biosynthesis | ||
| 53 | Thiamine biosynthesis protein (5G02470) | 6.66 |
| 54 | Thiazole biosynthesis enzyme (6G08360) | 2.87 |
| Unclassified and proteins of unknown function | ||
| 55 | Alcohol-DH, zinc-containing (1G04620) | 1.88 |
| 56 | Carbonic anhydrase Nce103 (4G11250) | 3.03 |
| 57 | Protein of unknown function (3G06460) | 1.76 |
| 58 | GMC oxidoreductase (3G01580) | 2.53 |
| 59 | Possible apospory-associated protein c (4G08880) | 1.60 |
| 60 | Aldehyde-DH AldA (6G11430) | −2.21 |
| 61 | Conserved lysine-rich protein (4G12450) | −1.79 |
| 62 | DUF636 domain protein (2G15290) | −21.27 |
| 63 | HAD superfamily hydrolase (5G08270) | −1.53 |
| 64 | M protein repeat protein (6G08660) | −2.03 |
| 65 | Phosphoribosylaminoimidazolecarboxamide formyltransferase/IMP cyclohydrolase (4G07690) | −1.50 |
| 66 | 14-3-3 Family protein ArtA (2G03290) | −1.53 |
Spot number in Figure 1.
DH, dehydrogenase.
Average ratios extracted from statistical analysis of DIGE gels by the Decyder software programs DIA and BVA.
Exposure of A. fumigatus to hypoxic conditions resulted in an increased level of many proteins involved in glycolysis, pyruvate metabolism, respiration, the pentose phosphate pathway and amino acid metabolism. Interestingly, the drastic reduction of the O2 concentration also led to an increased abundance of enzymes catalyzing reactions in secondary metabolite biosynthesis. Two of these proteins, a methyltransfrase and an α/β-hydrolase (protein spot No. 17 and 19 in Figure 1), are involved in the formation of pseurotin A, a known fungal mycotoxin with a highly substituted 1-oxa-7-azaspiro[4,4]non-2-ene-4,6-dione skeleton.39,40 Abundance of proteins involved in sulfate assimilation and fatty acid metabolism decreased under hypoxia. Most likely, because oxidative stress is typically low under hypoxia, also the hydrogen peroxide scavenging catalase Cat1 and the redox-balancing protein thioredoxin showed reduced protein expression.
A flavohemoprotein (spot No.16 in Figure 1) and an acetyl-coenzyme A synthetase (spot No. 31 in Figure 1) showed the highest up- and down-regulation, respectively, under hypoxic culture conditions. Flavohemoproteins are known to be involved in scavenging reactive nitrogen intermediates as shown for A. oryzae and A. nidulans.41,42
Because of the hypoxic upregulation of many proteins involved in respiration and electron transport, we examined the mitochondrial protein fraction in more detail. For this reason, mitochondria were isolated and protein samples were produced for two-dimensional gel electrophoresis as described previously.(23) The result of the comparative analysis of the mitochondrial proteome under hypoxic and normoxic growth conditions is shown in Figure 2, Table 2 and Table S3 (Supporting Information). In total, 93 protein spots showed a different abundance upon hypoxia, in which 10 protein spots were down- and 83 protein spots were up-regulated. The 93 protein spots represented 50 different proteins (Table 2). Of the 50 differentially regulated proteins 35 proteins had not been detected in the mycelial fraction before (Table 2 footnote e) comprising proteins involved in glycolysis, the TCA cycle, respiration, protein folding and amino acid metabolism. Obviously, mitochondrial fractionation did not completely avoid contamination by cytosolic proteins and, in addition, a small number of cell-wall associated proteins were detected as well, for example, Gel proteins and Ecm33.
Figure 2.

2D gel electrophoresis of mitochondrial protein extracts of A. fumigatus grown under hypoxic (Cy5, green) and normoxic conditions (Cy3, purple). Proteins were stained with the difference in gel electrophoresis (DIGE) labeling technique. The orientation of the IEF is indicated. The spot numbers refer to differentially synthesized proteins under hypoxic growth conditions (see Table 2).
Table 2. Differentially Synthesized Proteins of A. fumigatus under Hypoxia in Comparison to Normoxic Conditions in the Mitochondrial Fraction.
| spot no.a | putative function and protein name (AFUA_...)b | ratioc |
|---|---|---|
| Amino acid metabolism | ||
| Aspartate | ||
| 1 | Aspartate aminotransferase (4G10410)d | 2.17 |
| Glutamate | ||
| 2 | Glutamate/Leucine/Phenylalanine/ Valine-DH (4G06620) | 1.95 |
| Lysine | ||
| 3 | Homoaconitase LysF (5G08890)d,e | 2.14 |
| Valine/Leucine/Isoleucine | ||
| 4 | Dihydroxy acid dehydratase Ilv3 (2G14210)d,e | 2.11 |
| 5 | Mitochondrial acetolactate synthase small subunit (4G07210)d,e | 1.62 |
| Protein folding | ||
| 6 | Mitochondrial Hsp70 chaperone (2G09960)d | 2.13 |
| 7 | Hsp70 chaperone (HscA) (8G03930)e | 1.63 |
| 8 | Antigenic mitochondrial protein HSP60 (2G09290)d,e | 1.77 |
| 9 | Calnexin (4G12850)e | −2.57 |
| Protein degradation | ||
| 10 | Aspartic endopeptidase Pep2 (3G11400)e | 2.32 |
| Secondary metabolism | ||
| 11 | Alpha/beta hydrolase (8G00530) | 4.51 |
| 12 | Methyltransferase SirN-like (8G00550) | 3.79 |
| Cytoskeleton/Septum-associated structure | ||
| 13 | Woronin body protein HexA (5G08830) | 5.68 |
| 14 | Septin AspA (5G08540)e | −1.86 |
| 15 | Septin (5G03080) | −1.54 |
| Fatty acid metabolism | ||
| 16 | Lysophospholipase Plb3 (3G14680)e | 11.2 |
| 17 | Lysophospholipase Plb1 (4G08720)e | 5.48 |
| 18 | Long chain fatty alcohol oxidase (1G17110)e | 1.7 |
| 19 | Acetyl-coenzyme A synthetase (4G11080) | −4.92 |
| 20 | Mitochondrial glycerol-3-phosphate DH (1G08810)d,e | −1.69 |
| Pentose phosphate pathway | ||
| 21 | 6-Phosphogluconate-DH Gnd1 (6G08050) | 1.9 |
| 22 | Transaldolase (5G09230) | 2.09 |
| Glycolysis/Pyruvate metabolism | ||
| 23 | Phosphoglycerate kinase PgkA (1G10350) | 1.51 |
| 24 | Enolase/allergen Asp F 22 (6G06770)e | 1.67 |
| 25 | Fructose-bisphosphate aldolase, class II (3G11690)e | 1.61 |
| 26 | Pyruvate-DH complex component Pdx1 (3G08270)d,e | 3.72 |
| 27 | Pyruvate-DH E1 component alpha subunit (1G06960) | 1.67 |
| TCA cycle | ||
| 28 | Aconitate hydratase, mitochondrial (6G12930)d,e | 2.41 |
| 29 | Succinyl-CoA synthetase alpha subunit (5G06130)d,e | 1.69 |
| 30 | Succinate dehydrogenase subunit Sdh1 (3G07810)d,e | −1.74 |
| Electron transport and oxidative phosphorylation | ||
| 31 | ATP synthase D chain, mitochondrial (6G03810)d,e | 3.02 |
| 32 | ATP synthase F1, beta subunit (5G10550)d,e | 1.98 |
| 33 | Mitochondrial F1 ATPase subunit alpha (8G05320)d | 1.85 |
| 34 | Ubiquinol-cytochrome C reductase complex core protein 2 (5G04210)d,e | 1.85 |
| 35 | Vacuolar ATP synthase catalytic subunit A (5G02370)e | 1.54 |
| 36 | Mitochondrial ATPase subunit ATP4 (8G05440)d,e | −2.02 |
| 37 | Electron transfer flavoprotein-ubiquinone oxidoreductase (3G10110)d,e | −1.64 |
| Ubiquitone biosynthesis | ||
| 38 | Ubiquinone biosynthesis monooxgenase (Coq6) (4G12930)d,e | 2.84 |
| 39 | Ubiquinone biosynthesis methlytransferase Coq5 (6G08850)d,e | 2.26 |
| Vitamin and cofactor biosynthesis | ||
| 40 | Thiamine biosynthesis protein (Nmt1) (5G02470) | 5.61 |
| 41 | Thiazole biosynthesis enzyme (6G08360) | 4.65 |
| Unclassified and proteins of unknown function | ||
| 42 | Protein of unknown function (6G11850)e | 34.4 |
| 43 | Protein of unknown function (3G08440)e | 1.78 |
| 44 | 1,3-beta-glucanosyltransferase Gel2 (6G11390)e | 7.35 |
| 45 | 1,3-beta-glucanosyltransferase (2G05340)e | 7.31 |
| 46 | 1,3-beta-glucanosyltransferase Gel1 (2G01170)e | 3.54 |
| 47 | GPI-anchored cell wall organization protein Ecm33 (4G06820)e | 5.78 |
| 48 | Outer mitochondrial membrane protein porin (4G06910)e | 4.26 |
| 49 | Stomatin family protein (3G13440)e | 3.14 |
| 50 | Ras GTPase Rab11 (1G02190)e | −1.74 |
Spot number in Figure 2.
DH, dehydrogenase.
Average ratios extracted from statistical analysis of DIGE gels by the Decyder software programs DIA and BVA.
Mitochondrial import sequence according to MitoProtII - v1.101.
Only found in the mitochondrial fraction as differentially regulated.
A protein of unknown function carrying an Fe(II)/2-oxoglutarate oxygenase domain (spot No. 42 in Figure 2) revealed the strongest induction (34-fold) among the proteins of the mitochondrial fraction under hypoxic growth conditions. Moreover, a drop in O2 levels gave rise to an increased ubiquinone biosynthetic activity, which is illustrated by the higher abundance of the two enzymes ubiquinone biosynthesis monooxygenase Coq6 and methyltransferase Coq5 (Table 2).
Since the mitochondrial membrane complexes are difficult to resolve by conventional 2D-gel analysis, mitochondrial fractions (170 μg of protein) of A. fumigatus grown under normoxic or hypoxic conditions were applied to two-dimensional Blue-native (BN)/SDS PAGE after solubilization of the mitochondrial membrane proteins by using n-dodecylmaltoside as detergent. (Figure 3, Table 3 and Table S4 (Supporting Information)). In the first separation, the respiration complexes with their high molecular masses were separated under native conditions according to their size, whereas the subunits of the native complexes are then separated by SDS-PAGE in the second separation. Altogether, the BN/SDS-PAGE analysis revealed an increase in abundance of proteins of all five respiratory complexes in A. fumigatus mitochondria under hypoxic conditions (Figure 3). However, proteins of complex III and IV showed the highest, proteins of complex V the lowest rise in protein expression. Due to this imbalance it is interesting to speculate that some electrons may not enter the respiratory chain via complex I or II during hypoxic growth conditions.
Figure 3.

Analyses of the protein complexes of the mitochondrial respiration chain of A. fumigatus by two-dimensional Blue-native/SDS PAGE under hypoxic conditions. Proteins were visualized by Coomassie staining. Designation of resolved protein complexes are given on top of the gel. The spot numbers refer to proteins listed in Table 3.
Table 3. Abundance of Proteins of the Mitochondrial Respiratory Complexes in A. fumigatus under Hypoxia in Comparison to Normoxic Conditions.
| spot no.a | protein name and classification to the complexes of the mitochondrial respiration chain | ratiob |
|---|---|---|
| Complex I | ||
| 1 | NADH-ubiquinone oxidoreductase, subunit G | 2.21 |
| 2 | NADH-ubiquinone oxidoreductase, subunit F | 1.96 |
| 3 | NADH-ubiquinone oxidoreductase 49 kDa subunit | 1.87 |
| 4 | NADH-ubiquinone oxidoreductase 39 kDa subunit | 2.52 |
| 5 | NADH-ubiquinone oxidoreductase 304 kDa subunit precursor | 1.83 |
| 6 | NADH-ubiquinone oxidoreductase 299 kDa subunit | 2.54 |
| 7 | NADH-ubiquinone dehydrogenase 24 kDa subunit | 2.58 |
| 8 | NADH-ubiquinone oxidoreductase 18 kDa subunit | 2.99 |
| 9 | NADH-ubiquinone oxidoreductase 213 kDa subunit | 3.13 |
| 10 | NADH-ubiquinone oxidoreductase 21 kDa subunit | 3.06 |
| 11 | NADH-ubiquinone oxidoreductase 178 kDa subunit | 2.55 |
| Complex II | ||
| 12 | Succinate dehydrogenase subunit Sdh1 | 2.01 |
| 13 | Iron−sulfur protein subunit of succinate dehydrogenase Sdh2 | 3.92 |
| Complex III | ||
| 14 | Ubiquinol-cytochrome c reductase complex core protein 2 | 4.91 |
| 15 | Cytochrome C1/Cyt1 | 5.46 |
| Complex IV | ||
| 16 | Cytochrome c subunit Vb | 4.71 |
| 17 | Cytochrome c oxidase subunit V | 5.10 |
| 18 | Cytochrome c oxidase subunit Va | 6.64 |
| Complex V | ||
| 19 | Mitochondrial F1 ATPase subunit alpha | 1.19 |
| 20 | ATP synthase F1, beta subunit | 1.24 |
Spot number in Figure 3.
Average ratios extracted from analysis of BN gels by the ImageQuant 5.2. software.
Determination of the Respiratory Activity of A. fumigatus and Fluorescence Staining of Mitochondria
To investigate whether the up-regulation of proteins involved in the respiratory machinery is directly correlated with a higher respiratory capacity, we measured at atmospheric oxygen partial pressure the rate of oxygen consumption of A. fumigatus hyphae, which had been grown either under normoxic or hypoxic growth conditions (Figure 4A). Adaptation to hypoxic compared to normoxic condition increased the oxygen consumption rate of A. fumigatus hyphae 1.7-fold (4.83% compared to 2.78% (v/v) O2 per minute and mg dry weight). Visualization of mitochondria by staining with the mitochondrion-selective fluorescent MitoTracker Red probe indicated that hypoxia increases the number of mitochondria in comparison to normoxia (Figure 4B).
Figure 4.

Physiological adaptation of A. fumigatus to hypoxic growth condition with regard to modifications in the respiratory activity and the amount of mitochondria in the hyphae. (A) Oxygen consumption rate of A. fumigatus hyphae grown under normoxic (21% pO2) and hypoxic (0.2% pO2) conditions. The oxygen consumption rate of A. fumigatus grown in hypoxia is significantly increased compared to that of A. fumigatus cultivated under normoxic environments (p < 0.01). Error bars indicate standard deviations of the means. (B) Determination of the amount of A. fumigatus mitochondria by Mito Tracker Red fluorescence staining. CLSM fluorescence (FL), brightfield (BF) and overlay (OV) images showing a clearly elevated amount of mitochondria in the mycelium of hypoxic (0.2% pO2) cultivated A. fumigatus in comparison to A. fumigatus grown under normoxia (21% pO2). All scale bars represent 5 μm length.
Metal and Heme Measurement
The most striking difference in the growth morphotype of A. fumigatus at hypoxic growth conditions was a change in the mycelial color from whitish to reddish starting approximately after 2 days of cultivation (Figure 5A). To test the hypothesis that an increased heme or iron content may cause the red color formation during hypoxic chemostat cultivation, we quantified the heme and metal concentration of A. fumigatus mycelium by HPLC and ICP-AES, respectively (Figure 5B). The heme content increased 4-fold in A. fumigatus mycelium under hypoxic growth conditions and also the amount of iron and the trace elements zinc and copper were elevated. These changes most likely reflect the hypoxia-induced rise in mitochondrial respiratory enzyme complexes containing heme, copper and iron as cofactor.
Figure 5.

O2-dependent changes in the mycelial color and in the intracellular concentration of heme and metals in A. fumigatus. (A) Color of the mycelium of A. fumigatus turned from whitish to reddish due to the reduction of the oxygen partial pressure from 21 to 0.2% in the medium. (B) Differences in the metal (left y-axis) and heme (right y-axis) content of A. fumigatus mycelia grown under hypoxic (dark gray bar) in comparison to normoxic (light gray bar) conditions. The metals iron, zinc and copper and the prosthetic group heme are significantly (p < 0.05 * or p < 0.01**) enriched in A. fumigatus mycelia under hypoxia. Error bars indicate standard deviations of the means.
Measurement of the Intracellular NAD(P)+/NAD(P)H Concentrations
Because of the up-regulation of several proteins involved in the pentose phosphate pathway and in the respiration machinery, we analyzed the intracellular concentrations of the pyridine nucleotides of A. fumigatus under both, hypoxic and normoxic conditions (Figure 6). Hypoxia increased the NADP+ and NADPH content 47-fold and 8-fold, respectively, which changed the NADP+/NADPH ratio from 0.4:1 under normoxic to 2.4:1 under hypoxic growth conditions. The increase of the NADP+/NADPH ratio during hypoxia indicates that either reductive biosynthesis pathways or NADPH-consuming mechanisms of oxidative or nitrosative stress defense are more active upon hypoxia. By contrast, no differences in the concentration of intracellular NAD+ was detectable in hyphal cells of A. fumigatus cultivated under normoxia and hypoxia, while NADH was not detectable under neither of the cultivation conditions probably due to the low concentration of NADH in the cell.
Figure 6.

Intracellular concentrations of the pyridine nucleotides of A. fumigatus under normoxia (light gray bar) and hypoxia (dark gray bar). Hypoxic growth conditions led to a significant (p < 0.05 * or p < 0.01**) increase of the NADP+ and NADPH concentration (left y-axis) and to a complete conversion of the NADP+/NADPH ratio (right y-axis) in A. fumigatus. Error bars indicate standard errors of the means.
Activation of Secondary Metabolite Gene Clusters in A. fumigatus under Hypoxic Conditions
The proteome analysis of A. fumigatus grown under normoxic or hypoxic conditions revealed an increased abundance of enzymes involved in the biosynthesis of secondary metabolites (Table 1 and Figure 1), for example, an α/β-hydrolase and a SirN-like methyltransferase, whose corresponding genes are part of the already characterized pseurotin A biosynthesis gene cluster.(39) Northern blot analysis confirmed the proteome data and revealed upregulation under hypoxic conditions of all genes of the pseurotin A biosynthesis gene cluster(39) at the transcriptional level (Figure 7). Moreover, Northern blot analysis also revealed the induction of additional secondary metabolism genes during hypoxia: several genes of the fumitremorgin gene cluster (AFUA_8G00190; AFUA_8G00200 and AFUA_8G0010) and genes of a predicted gene cluster of unknown function (AFUA_8G00300 − AFUA_8G00520) (Figure 7A and Table S2, Supporting Information). All of these genes belong to the postulated fumitremorgin super cluster on chromosome 8.43−45 Reversed phase-HPLC confirmed induction of pseurotin A production under hypoxic conditions at the metabolite level (Figure 7A and B).
Figure 7.

Induction of the pseurotin A biosynthesis gene cluster as well as the biosynthesis of pseurotin A under hypoxic, glucose-limited growth conditions in A. fumigatus. (A) Northern blot analysis and organization of the pseurotin A biosynthesis gene cluster. Total RNA was isolated from A. fumigatus grown under hypoxic and normoxic conditions. rRNA bands are shown as control. All genes of this cluster are highly induced under hypoxia in comparison to normoxia. Arrows indicate open reading frames. H1+2: hydrolases; MT: methyl transferase; P450: cytochrome P450 oxidoreductase; GST: glutathione S-transferase. (B) HPLC profiles of supernatant of the cultures of A. fumigatus grown under hypoxic and normoxic conditions. Commercially available pseurotin A was used as standard. Hypoxic growth conditions induced the biosynthesis of pseurotin A in A. fumigatus. (C) Northern blot analysis of the expression of srbA in A. fumigatus grown under normoxic and hypoxic conditions. rRNA bands are shown as control.
As shown in Figure 7C, the mRNA level of the hypoxic regulator-encoding srbA, which was previously shown to be induced by hypoxia,(6) was increased during chemostat cultivation at 0.2% compared to 21% pO2, confirming the accuracy of the cultivation method.
Activation of the Pseurotin A Biosynthesis Gene Cluster of A. fumigatus under Hypoxic in vitro Conditions and during Infection
To elucidate the transcriptional activity of the pseurotin A biosynthesis gene cluster during infection, we applied qRT-PCR analysis by comparison gene expression of the hybrid polyketide synthase−nonribosomal peptide synthetase (PKS/NRPS) gene AFUA_8G00540 and the methyl transferase gene AFUA_8G00550 under in vivo (murine model of pulmonary aspergillosis in cortisone-treated mice) and in vitro (chemostat cultivation) conditions (Figure 8A). Transcript levels of both genes increased relative to the control gene act1 under hypoxic compared to normoxic in vitro conditions and during A. fumigatus infection in mouse lungs. The relative expression of the methyl transferase AFUA_8G00550 was similar during hypoxic in vitro and in vivo conditions during mice infection, i.e about 11-fold higher compared to normoxic in vitro conditions (12-fold in vitro, 8.3- and 13.4-fold in vivo). Compared to normoxic in vitro conditions, the relative expression of the hybrid PKS/NRPS gene was about 8-fold upregulated during hypoxic in vitro conditions and even 64-fold and 28-fold, respectively, in the two mouse lungs tested. Taken together, the qRT- PCR analysis revealed a clear induction of genes of the pseurotin A biosynthesis gene cluster in experimental aspergillosis.
Figure 8.

Quantitative Real Time-PCR to determine the relative expression of the hybrid PKS/NRPS and methyl transferase genes of the pseurotin A biosynthesis gene cluster in comparison to the control gene act1 (AFUA_6G04740) under normoxic and hypoxic conditions. (A) Relative expression of the genes for the hybrid PKS/NRPS and methyl transferase of the pseurotin A biosynthesis gene cluster in vitro and in the lung of infected mice. For the in vitro tests A. fumigatus was grown under hypoxic and normoxic conditions and the total RNA was subsequently isolated from the mycelium. For the in vivo data, mouse infection experiments were performed and the total RNA was isolated from two infected lungs. (B) Northern blot analysis of the standard gene act1. Ten μg of total RNA of A. fumigatus mycelium grown during hypoxia (0.2% pO2) and normoxia (21% pO2) was analyzed.
Discussion
To colonize the human lungs, the saprophytic fungus A. fumigatus, which is generally found in soil and decaying organic matter such as compost piles, has to adapt to the new environmental conditions. Besides mechanisms to evade the attack of immune cells and an effective nutrient uptake system,(46)A. fumigatus has to adjust to low oxygen partial pressures in the host. Recently, it was shown that the ability to grow under hypoxia is a virulence trait for A. fumigatus and other pulmonary infection pathogens.6,14,47 Despite the reported connection between hypoxia adaptation and virulence, comprehensive knowledge about the detailed molecular basis of stress adaptation in A. fumigatus to hypoxia is lacking. To close this gap, we carried out detailed proteome analyses of the total soluble and the mitochondrial fraction of A. fumigatus mycelium. To achieve a data set with a maximum in reproducibility and reliability we established a chemostat cultivation method for A. fumigatus to maintain the mycelium under strictly controlled environmental conditions. Here, we identified 117 proteins that were differently regulated in this fungus under hypoxic versus normoxic growth conditions. The majority of these proteins belong to the FunCat categories respiration/electron transport, carbon metabolism, amino acid metabolism, cell wall construction, glycolysis and vitamin and cofactor synthesis.(30)
Under hypoxia, A. fumigatus seems to enhance the flux through the glycolytic pathway. Similar to C. neoformans(15) and C. albicans,(18) hypoxia up-regulated proteins of the glycolysis in A. fumigatus. Consequently, for an effective conversion of the main glycolytic end product pyruvate to the entry molecule of the TCA cycle, acetyl-CoA, A. fumigatus increased the biosynthesis of proteins of the pyruvate dehydrogenase complex (PDC). Such a hypoxic dependent up-regulation of the PDC was also shown for A. nidulans,(48)Trichoderma reesei(49) and S. cerevisiae.50,51 In addition to the increased glycolytic activity, A. fumigatus responded to hypoxia with the induction of several enzymes of the TCA cycle like the aconitase, the α-ketoglutarate dehydrogenase complex and the succinyl-CoA synthetase, whereas the level of succinate dehydrogenase decreased. An increased TCA cycle activity at low oxygen levels was also demonstrated for S. cerevisiae,(52) whereas the opposite, a repression of genes coding for enzymes of the TCA cycle with reduced oxygen concentration, was reported for C. albicans.(18) The increased supply with precursor molecules for the biosynthesis of amino acids or tetrapyrrols or an increased flux through the TCA cycle for the generation of NADH and FADH2 are possible explanations for the general induction of the TCA cycle in A. fumigatus at reduced oxygen levels. Altogether, the proteome data did not give any hint for the induction of fermentative pathways in A. fumigatus under hypoxia. In contrast to A. nidulans,(53) no enzymes involved in ethanol or lactate production were induced upon hypoxia. Obviously no other NAD+ regenerating systems were activated. The level of the soluble fumarate reductase Osm1, which has been reported to be involved in the reoxidation of NADH and FADH2 during anaerobiosis in S. cerevisiae,(54) decreased at hypoxic growth conditions in A. fumigatus. Furthermore, proteomic analysis of A. nidulans cultures under hypoxic conditions by Shimizu et al.(48) revealed an increased activity of enzymes of the γ-aminobutyrate (GABA)-shunt, which bypasses the NADH-generating activity of the α-ketoglutarate dehydrogenase in the TCA cycle. Our proteome data do not support a similar hypoxic response in A. fumigatus, since levels of the GABA-shunt enzyme succinate semialdehyde dehydrogenase decreased at hypoxic growth conditions. However, the same group also reported an increased branched-chain amino acid biosynthesis under hypoxia, which contribute to NAD+ and NADP+ regeneration.(55) Indeed, also in A. fumigatus two enzymes of the valine, leucine and isoleucine biosynthesis pathway, namely dihydroxy acid dehydratase and acetolactate synthase, increased in abundance at low oxygen levels. But hypoxia may also affect in a general way the intracellular amino acid pools especially of amino acids that are partly synthesized in mitochondria.(50) Overall, A. fumigatus presumably does not face a drastic metabolic imbalance during glucose-limited chemostat cultivations at hypoxic conditions. A drastic NADH accumulation is probably avoided by the upregulation of proteins of all five respiratory complexes, which is accompanied by an increased cellular content in heme, iron copper, and other metals as well as an augmentation of the mitochondrial mass and respiratory capacity. All these adaptation mechanism most likely lead to an increased efficiency in using the low amount of available oxygen. A similar hypoxic response was also observed for S. cerevisiae cultivated in glucose-limited chemostats.(52) By contrast, in A. niger a decreased activity of the respiratory chain, a lowered level of ATP production and an accumulation of NADH in response to hypoxia was reported.(56)
Similar to C. neoformans,(15) proteins of the ubiquinone biosynthesis, an oxygen-dependent metabolic pathway, were more abundant under hypoxic environments.
Moreover, two mitochondrial-localized heat shock proteins, Hsp70 and Hsp60 that contribute to the biogenesis of Fe/S cluster, mitochondrial protein biosynthesis and translocation processes of cytosolic proteins into mitochondria, were also more abundant under hypoxic environments.57,58 As in A. nidulans,(48) proteins of the biosynthesis of vitamins and cofactors were also found to be up-regulated in A. fumigatus under hypoxia, e.g., the thiamine and the thiazole biosynthesis proteins, which are involved in the formation of thiamine that is subsequently converted into the active thiamine diphosphate (TDP) by the thiamine diphosphokinase.(59) TDP is an essential coenzyme of the transketolase, the pyruvate dehydrogenase and the α-ketoglutarate dehydrogenase.60,61 All these enzymes were identified to be up-regulated in A. fumigatus under hypoxic growth conditions.
The flavohemoprotein AFUA_4G03410 showed the highest upregulation in the mycelial fraction of A. fumigatus when cultured under hypoxia. In Aspergilli, flavohemoproteins are involved in detoxifying reactive nitrogen species (RNS)(41) and are coregulated with nitrate assimilation.(42) An induction of this type of enzyme under hypoxia has not been reported for Aspergilli yet. However, it was shown for S. cerevisiae that under hypoxic conditions cytochrom c oxidase catalyzes the production of NO within mitochondria by reducing nitrite.62,63 Castello et al.(62) suggested that in yeast the mitochondrially produced NO is involved in hypoxic signaling, possibly via protein tyrosine nitration. Therefore, the hypoxia-induced flavohemoprotein may protect cells of A. fumigatus against RNS generated at low oxygen levels.64,65 In addition, the RNS may also act as a signal molecule in the hypoxic response in A. fumigatus.(66) A hypoxia induced up-regulation of a flavohemoprotein was already demonstrated for C. neoformans.(15) The deletion of the corresponding genes of the NO-detoxifying flavohemoproteins in the pathogenic yeasts C. neoformans and C. albicans led to attenuated virulence.67,68 To date, the role of RNS in hypoxic signaling or pathogenicity of A. fumigatus has not been elucidated. The fact that some of the mitochondrially produced NO is released from cells(69) raises the possibility that NO has also an immuno-suppressive effect during later stages of infection.
A further remarkable result of our work is the first identification of hypoxia as an inducing factor for secondary metabolism in A. fumigatus. Two proteins, namely a SirN-like methyltransferase (AFUA_8G00550) and an α/β-hydrolase (AFUA_8G00530) of the pseurotin A biosynthesis gene cluster were found to be up regulated due to hypoxic condition.(39) The hypoxic induction of the entire pseurotin A biosynthesis gene cluster and the actual formation of pseurotin A under these conditions in A. fumigatus was proven by Northern blot and HPLC-MS analysis. qRT-PCR analysis clearly demonstrated a high expression level of two genes of the pseurotin A biosynthesis gene cluster under in vivo infection conditions as well. The pseurotin A hybrid PKS/NRPS gene in A. fumigatus during infection compared to hypoxic in vitro conditions indicating even lower O2 availability in the infected tissue or additional inducing stimuli besides hypoxia. It is conceivable that the production of pseurotin A could contribute to the survival of A. fumigatus in hypoxic microenvironments in the soil,(70) where it could act against competitors like nematodes and microbes.40,71,72 A demonstrated moderate cytotoxicity against lung fibroblasts(72) and the capacity to inhibit IgE production(40) indicate a possible role of pseurotin A in the pathogenicity of A. fumigatus in mammals.
Conclusions
Our 2-D gel electrophoresis and Blue Native/SDS-gel separation provided a global view on the proteome level changes during long-term adaptation of A. fumigatus to hypoxia at substrate limitation. We identified 117 different proteins from A. fumigatus which significantly changed their abundance at hypoxic in comparison to normoxic growth conditions. Our data suggests that A. fumigatus compensates a drastic drop in oxygen levels by increasing the levels of respiratory proteins and thus increasing the respiratory capacity. No evidence could be found for an alternative NAD+ regeneration system activated upon hypoxia. However, it cannot be ruled out that a short-term response of A. fumigatus to hypoxia at sufficient carbon source availability could induce other adaptation mechanisms. The high up-regulation of an NO-detoxifying flavohemoprotein implies indirectly that hypoxia stimulates the formation of reactive nitrogen intermediates in A. fumigatus. Furthermore, hypoxia activated the silent or poorly expressed secondary metabolite pseurotin A biosynthesis gene cluster. Such an activation may have also an impact on the growth of A. fumigatus during the infection, when local obstruction of the airways and necrotic deaths of host’s cells leads consequently to oxygen depletion. The characterization of the mechanisms of transcriptional and translational activation of hypoxia-induced genes and proteins, respectively, should form the focus of future studies.
Acknowledgments
We thank Silke Steinbach, Dagmar Lewejohann and Michael Cyrulies for their excellent technical assistance. Andreas Thywissen is gratefully acknowledged for his help concerning the microscopic analysis. We are particularly indebted to Dr. Matthias Brock and Dr. Christian Fleck for their support in performing the qRT-PCR analysis. Furthermore, we thank Dr. Albert Mirlach for performing the metal measurements. This work was supported by the Hans-Knöll-Institute and the German-Israeli Foundation for Scientific Research & Development Grant No. 996-47.12/2008 (to O.K.) and the FWF Grant No. P21643−B11 (to H.H.).
Supporting Information Available
All oligonucleotides used in this work are shown in Supplementary Table S1.
Supplementary Tables S2 and S3 give additional information about the proteins identified by 2-D PAGE and MALDI-TOF/TOF of the cytosolic and the mitochondrial fraction. Theoretical pI, MW as well as sequence coverage and Mascot score are listed. The same information for the mitochondrial proteins separated by 2-D blue-native/SDS PAGE and identified via MALDI-TOF/TOF can be found in Supplementary Table S4. Supplementary Figure S1 shows a time course of a chemostat cultivation of A. fumigatus at different oxygen partial pressure. This material is available free of charge via the Internet at http://pubs.acs.org.
Author Present Address
§ CINVESTAV Unidad Irapuato, Irapuato, Mexico.
Supplementary Material
References
- Perlroth J.; Choi B.; Spellberg B. Nosocomial fungal infections: epidemiology, diagnosis, and treatment. Med. Mycol. 2007, 45 (4), 321–46. [DOI] [PubMed] [Google Scholar]
- McNeil M. M.; Nash S. L.; Hajjeh R. A.; Phelan M. A.; Conn L. A.; Plikaytis B. D.; Warnock D. W. Trends in mortality due to invasive mycotic diseases in the United States, 1980−1997. Clin. Infect. Dis. 2001, 33 (5), 641–7. [DOI] [PubMed] [Google Scholar]
- Brakhage A. A. Systemic fungal infections caused by Aspergillus species: epidemiology, infection process and virulence determinants. Curr. Drug Targets 2005, 6 (8), 875–86. [DOI] [PubMed] [Google Scholar]
- Warn P. A.; Sharp A.; Guinea J.; Denning D. W. Effect of hypoxic conditions on in vitro susceptibility testing of amphotericin B, itraconazole and micafungin against Aspergillus and Candida. J. Antimicrob. Chemother. 2004, 53 (5), 743–9. [DOI] [PubMed] [Google Scholar]
- Tarrand J. J.; Han X. Y.; Kontoyiannis D. P.; May G. S. Aspergillus hyphae in infected tissue: evidence of physiologic adaptation and effect on culture recovery. J. Clin. Microbiol. 2005, 43 (1), 382–6. [DOI] [PMC free article] [PubMed] [Google Scholar]
- Willger S. D.; Puttikamonkul S.; Kim K. H.; Burritt J. B.; Grahl N.; Metzler L. J.; Barbuch R.; Bard M.; Lawrence C. B.; Cramer R. A. Jr. A sterol-regulatory element binding protein is required for cell polarity, hypoxia adaptation, azole drug resistance, and virulence in Aspergillus fumigatus. PLoS Pathog. 2008, 4 (11), e1000200. [DOI] [PMC free article] [PubMed] [Google Scholar]
- West J. B.Respiratory physiology: the essentials, 8th ed.; Lippincott Williams & Wilkins: Philadelphia, 2008; p 192. [Google Scholar]
- Bullen J. J.; Rogers H. J.; Spalding P. B.; Ward C. G. Natural resistance, iron and infection: a challenge for clinical medicine. J. Med. Microbiol. 2006, 55 (Pt 3), 251–8. [DOI] [PubMed] [Google Scholar]
- Radi R.; Cassina A.; Hodara R.; Quijano C.; Castro L. Peroxynitrite reactions and formation in mitochondria. Free Radic. Biol. Med. 2002, 33 (11), 1451–64. [DOI] [PubMed] [Google Scholar]
- Grahl N.; Cramer R. A. Jr. Regulation of hypoxia adaptation: an overlooked virulence attribute of pathogenic fungi?. Med. Mycol. 2010, 48 (1), 1–15. [DOI] [PMC free article] [PubMed] [Google Scholar]
- Hall L. A.; Denning D. W. Oxygen requirements of Aspergillus species. J. Med. Microbiol. 1994, 41 (5), 311–5. [DOI] [PubMed] [Google Scholar]
- Bailey-Serres J.; Chang R. Sensing and signalling in response to oxygen deprivation in plants and other organisms. Ann. Bot. (London) 2005, 96 (4), 507–18. [DOI] [PMC free article] [PubMed] [Google Scholar]
- Hughes A. L.; Todd B. L.; Espenshade P. J. SREBP pathway responds to sterols and functions as an oxygen sensor in fission yeast. Cell 2005, 120 (6), 831–42. [DOI] [PubMed] [Google Scholar]
- Chang Y. C.; Bien C. M.; Lee H.; Espenshade P. J.; Kwon-Chung K. J. Sre1p, a regulator of oxygen sensing and sterol homeostasis, is required for virulence in Cryptococcus neoformans. Mol. Microbiol. 2007, 64 (3), 614–29. [DOI] [PubMed] [Google Scholar]
- Chun C. D.; Liu O. W.; Madhani H. D. A link between virulence and homeostatic responses to hypoxia during infection by the human fungal pathogen Cryptococcus neoformans. PLoS Pathog. 2007, 3 (2), e22. [DOI] [PMC free article] [PubMed] [Google Scholar]
- Hughes A. L.; Lee C. Y.; Bien C. M.; Espenshade P. J. 4-Methyl sterols regulate fission yeast SREBP-Scap under low oxygen and cell stress. J. Biol. Chem. 2007, 282 (33), 24388–96. [DOI] [PMC free article] [PubMed] [Google Scholar]
- Todd B. L.; Stewart E. V.; Burg J. S.; Hughes A. L.; Espenshade P. J. Sterol regulatory element binding protein is a principal regulator of anaerobic gene expression in fission yeast. Mol. Cell. Biol. 2006, 26 (7), 2817–31. [DOI] [PMC free article] [PubMed] [Google Scholar]
- Setiadi E. R.; Doedt T.; Cottier F.; Noffz C.; Ernst J. F. Transcriptional response of Candida albicans to hypoxia: linkage of oxygen sensing and Efg1p-regulatory networks. J. Mol. Biol. 2006, 361 (3), 399–411. [DOI] [PubMed] [Google Scholar]
- Hoskisson P. A.; Hobbs G. Continuous culture--making a comeback?. Microbiology 2005, 151 (Pt 10), 3153–9. [DOI] [PubMed] [Google Scholar]
- Weidner G.; d’Enfert C.; Koch A.; Mol P. C.; Brakhage A. A. Development of a homologous transformation system for the human pathogenic fungus Aspergillus fumigatus based on the pyrG gene encoding orotidine 5′-monophosphate decarboxylase. Curr. Genet. 1998, 33 (5), 378–85. [DOI] [PubMed] [Google Scholar]
- Carpentier S. C.; Witters E.; Laukens K.; Deckers P.; Swennen R.; Panis B. Preparation of protein extracts from recalcitrant plant tissues: an evaluation of different methods for two-dimensional gel electrophoresis analysis. Proteomics 2005, 5 (10), 2497–507. [DOI] [PubMed] [Google Scholar]
- Kniemeyer O.; Lessing F.; Scheibner O.; Hertweck C.; Brakhage A. A. Optimisation of a 2-D gel electrophoresis protocol for the human-pathogenic fungus Aspergillus fumigatus. Curr. Genet. 2006, 49 (3), 178–89. [DOI] [PubMed] [Google Scholar]
- Vödisch M.; Albrecht D.; Lessing F.; Schmidt A. D.; Winkler R.; Guthke R.; Brakhage A. A.; Kniemeyer O. Two-dimensional proteome reference maps for the human pathogenic filamentous fungus Aspergillus fumigatus. Proteomics 2009, 9 (5), 1407–15. [DOI] [PubMed] [Google Scholar]
- Bradford M. M. A rapid and sensitive method for the quantitation of microgram quantities of protein utilizing the principle of protein-dye binding. Anal. Biochem. 1976, 72, 248–54. [DOI] [PubMed] [Google Scholar]
- Lessing F.; Kniemeyer O.; Wozniok I.; Loeffler J.; Kurzai O.; Haertl A.; Brakhage A. A. The Aspergillus fumigatus transcriptional regulator AfYap1 represents the major regulator for defense against reactive oxygen intermediates but is dispensable for pathogenicity in an intranasal mouse infection model. Eukaryot. Cell 2007, 6 (12), 2290–302. [DOI] [PMC free article] [PubMed] [Google Scholar]
- Rabilloud T.; Strub J. M.; Luche S.; van Dorsselaer A.; Lunardi J. A comparison between Sypro Ruby and ruthenium II tris (bathophenanthroline disulfonate) as fluorescent stains for protein detection in gels. Proteomics 2001, 1 (5), 699–704. [DOI] [PubMed] [Google Scholar]
- Lamanda A.; Cheaib Z.; Turgut M. D.; Lussi A. Protein buffering in model systems and in whole human saliva. PLoS One 2007, 2 (2), e263. [DOI] [PMC free article] [PubMed] [Google Scholar]
- Shevchenko A.; Wilm M.; Vorm O.; Mann M. Mass spectrometric sequencing of proteins silver-stained polyacrylamide gels. Anal. Chem. 1996, 68 (5), 850–8. [DOI] [PubMed] [Google Scholar]
- Albrecht D.; Kniemeyer O.; Brakhage A. A.; Berth M.; Guthke R.. Integration of transcriptome and proteome data from human pathogenic fungi by using a data warehouse. J. Integr. Bioinform., 2007, 4 (1), doi:10.2390.biecoll-jib-2007-52. [Google Scholar]
- Priebe S.; Linde J.; Albrecht D.; Guthke R.; Brakhage A. A. FungiFun: A web-based application for functional categorization of fungal genes and proteins. Fungal Genet. Biol. 2011, 48 (4), 353–8. [DOI] [PubMed] [Google Scholar]
- Schägger H.; von Jagow G. Blue native electrophoresis for isolation of membrane protein complexes in enzymatically active form. Anal. Biochem. 1991, 199 (2), 223–31. [DOI] [PubMed] [Google Scholar]
- Heinemeyer J.; Lewejohann D.; Braun H. P. Blue-native gel electrophoresis for the characterization of protein complexes in plants. Methods Mol. Biol. 2007, 355, 343–52. [DOI] [PubMed] [Google Scholar]
- Bergmann S.; Schumann J.; Scherlach K.; Lange C.; Brakhage A. A.; Hertweck C. Genomics-driven discovery of PKS-NRPS hybrid metabolites from Aspergillus nidulans. Nat. Chem. Biol. 2007, 3 (4), 213–7. [DOI] [PubMed] [Google Scholar]
- Brock M.; Jouvion G.; Droin-Bergere S.; Dussurget O.; Nicola M. A.; Ibrahim-Granet O. Bioluminescent Aspergillus fumigatus, a new tool for drug efficiency testing and in vivo monitoring of invasive aspergillosis. Appl. Environ. Microbiol. 2008, 74 (22), 7023–35. [DOI] [PMC free article] [PubMed] [Google Scholar]
- Ibrahim-Granet O.; Dubourdeau M.; Latge J. P.; Ave P.; Huerre M.; Brakhage A. A.; Brock M. Methylcitrate synthase from Aspergillus fumigatus is essential for manifestation of invasive aspergillosis. Cell. Microbiol. 2008, 10 (1), 134–48. [DOI] [PubMed] [Google Scholar]
- Hortschansky P.; Eisendle M.; Al-Abdallah Q.; Schmidt A. D.; Bergmann S.; Thon M.; Kniemeyer O.; Abt B.; Seeber B.; Werner E. R.; Kato M.; Brakhage A. A.; Haas H. Interaction of HapX with the CCAAT-binding complex--a novel mechanism of gene regulation by iron. EMBO J. 2007, 26 (13), 3157–68. [DOI] [PMC free article] [PubMed] [Google Scholar]
- Eisendle M.; Schrettl M.; Kragl C.; Muller D.; Illmer P.; Haas H. The intracellular siderophore ferricrocin is involved in iron storage, oxidative-stress resistance, germination, and sexual development in Aspergillus nidulans. Eukaryot. Cell 2006, 5 (10), 1596–603. [DOI] [PMC free article] [PubMed] [Google Scholar]
- Eide D. J.; Clark S.; Nair T. M.; Gehl M.; Gribskov M.; Guerinot M. L.; Harper J. F. Characterization of the yeast ionome: a genome-wide analysis of nutrient mineral and trace element homeostasis in Saccharomyces cerevisiae. Genome Biol. 2005, 6 (9), R77. [DOI] [PMC free article] [PubMed] [Google Scholar]
- Maiya S.; Grundmann A.; Li X.; Li S. M.; Turner G. Identification of a hybrid PKS/NRPS required for pseurotin A biosynthesis in the human pathogen Aspergillus fumigatus. Chembiochem 2007, 8 (14), 1736–43. [DOI] [PubMed] [Google Scholar]
- Ishikawa M.; Ninomiya T.; Akabane H.; Kushida N.; Tsujiuchi G.; Ohyama M.; Gomi S.; Shito K.; Murata T.; Pseurotin A and its analogues as inhibitors of immunoglobulin E production. Bioorg. Med. Chem. Lett. 2009, 19 (5), 1457–60. [DOI] [PubMed] [Google Scholar]
- Zhou S.; Fushinobu S.; Nakanishi Y.; Kim S. W.; Wakagi T.; Shoun H. Cloning and characterization of two flavohemoglobins from Aspergillus oryzae. Biochem. Biophys. Res. Commun. 2009, 381 (1), 7–11. [DOI] [PubMed] [Google Scholar]
- Schinko T.; Berger H.; Lee W.; Gallmetzer A.; Pirker K.; Pachlinger R.; Buchner I.; Reichenauer T.; Guldener U.; Strauss J. Transcriptome analysis of nitrate assimilation in Aspergillus nidulans reveals connections to nitric oxide metabolism. Mol. Microbiol. 2010, 78 (3), 720–38. [DOI] [PMC free article] [PubMed] [Google Scholar]
- Twumasi-Boateng K.; Yu Y.; Chen D.; Gravelat F. N.; Nierman W. C.; Sheppard D. C. Transcriptional profiling identifies a role for BrlA in the response to nitrogen depletion and for StuA in the regulation of secondary metabolite clusters in Aspergillus fumigatus. Eukaryot. Cell 2009, 8 (1), 104–15. [DOI] [PMC free article] [PubMed] [Google Scholar]
- Maiya S.; Grundmann A.; Li S. M.; Turner G. The fumitremorgin gene cluster of Aspergillus fumigatus: identification of a gene encoding brevianamide F synthetase. Chembiochem 2006, 7 (7), 1062–9. [DOI] [PubMed] [Google Scholar]
- Fedorova N. D.; Nierman W. C.; Turner G.; Joardar V.; Maiti R.; Anderson M. J.; Denning D. W.; Wortman J. R.. A Comparative View of the Genome of Aspergillus fumigatus. In The Aspergilli Genomics, Medical Aspects, Biotechnology, and Research Methods; Goldman G. H., Osmani S. A., Eds.; Taylor and Francis Group: Boca Raton, FL, 2008; Vol. 26, pp 25−42. [Google Scholar]
- Brakhage A. A.; Bruns S.; Thywissen A.; Zipfel P. F.; Behnsen J. Interaction of phagocytes with filamentous fungi. Curr. Opin. Microbiol. 2010, 13 (4), 409–15. [DOI] [PubMed] [Google Scholar]
- Shi L.; Sohaskey C. D.; Kana B. D.; Dawes S.; North R. J.; Mizrahi V.; Gennaro M. L. Changes in energy metabolism of Mycobacterium tuberculosis in mouse lung and under in vitro conditions affecting aerobic respiration. Proc. Natl. Acad. Sci. U.S.A. 2005, 102 (43), 15629–34. [DOI] [PMC free article] [PubMed] [Google Scholar]
- Shimizu M.; Fujii T.; Masuo S.; Fujita K.; Takaya N. Proteomic analysis of Aspergillus nidulans cultured under hypoxic conditions. Proteomics 2009, 9 (1), 7–19. [DOI] [PubMed] [Google Scholar]
- Bonaccorsi E. D.; Ferreira A. J.; Chambergo F. S.; Ramos A. S.; Mantovani M. C.; Farah J. P.; Sorio C. S.; Gombert A. K.; Tonso A.; El-Dorry H. Transcriptional response of the obligatory aerobe Trichoderma reesei to hypoxia and transient anoxia: implications for energy production and survival in the absence of oxygen. Biochemistry 2006, 45 (12), 3912–24. [DOI] [PubMed] [Google Scholar]
- de Groot M. J.; Daran-Lapujade P.; van Breukelen B.; Knijnenburg T. A.; de Hulster E. A.; Reinders M. J.; Pronk J. T.; Heck A. J.; Slijper M. Quantitative proteomics and transcriptomics of anaerobic and aerobic yeast cultures reveals post-transcriptional regulation of key cellular processes. Microbiology 2007, 153 (Pt 11), 3864–78. [DOI] [PubMed] [Google Scholar]
- Jouhten P.; Rintala E.; Huuskonen A.; Tamminen A.; Toivari M.; Wiebe M.; Ruohonen L.; Penttila M.; Maaheimo H. Oxygen dependence of metabolic fluxes and energy generation of Saccharomyces cerevisiae CEN.PK113−1A. BMC Syst. Biol. 2008, 2, 60. [DOI] [PMC free article] [PubMed] [Google Scholar]
- Rintala E.; Toivari M.; Pitkanen J. P.; Wiebe M. G.; Ruohonen L.; Penttila M. Low oxygen levels as a trigger for enhancement of respiratory metabolism in Saccharomyces cerevisiae. BMC Genomics 2009, 10, 461. [DOI] [PMC free article] [PubMed] [Google Scholar]
- Masuo S.; Terabayashi Y.; Shimizu M.; Fujii T.; Kitazume T.; Takaya N. Global gene expression analysis of Aspergillus nidulans reveals metabolic shift and transcription suppression under hypoxia. Mol. Genet. Genomics 2010, 284 (6), 415–424. [DOI] [PubMed] [Google Scholar]
- Camarasa C.; Faucet V.; Dequin S. Role in anaerobiosis of the isoenzymes for Saccharomyces cerevisiae fumarate reductase encoded by OSM1 and FRDS1. Yeast 2007, 24 (5), 391–401. [DOI] [PubMed] [Google Scholar]
- Shimizu M.; Fujii T.; Masuo S.; Takaya N. Mechanism of de novo branched-chain amino acid synthesis as an alternative electron sink in hypoxic Aspergillus nidulans cells. Appl. Environ. Microbiol. 2010, 76 (5), 1507–15. [DOI] [PMC free article] [PubMed] [Google Scholar]
- Diano A.; Peeters J.; Dynesen J.; Nielsen J. Physiology of Aspergillus niger in oxygen-limited continuous cultures: Influence of aeration, carbon source concentration and dilution rate. Biotechnol. Bioeng. 2009, 103 (5), 956–65. [DOI] [PubMed] [Google Scholar]
- Vickery L. E.; Cupp-Vickery J. R. Molecular chaperones HscA/Ssq1 and HscB/Jac1 and their roles in iron-sulfur protein maturation. Crit. Rev. Biochem. Mol. Biol. 2007, 42 (2), 95–111. [DOI] [PubMed] [Google Scholar]
- Voos W.; Rottgers K. Molecular chaperones as essential mediators of mitochondrial biogenesis. Biochim. Biophys. Acta 2002, 1592 (1), 51–62. [DOI] [PubMed] [Google Scholar]
- Kowalska E.; Kozik A. The genes and enzymes involved in the biosynthesis of thiamin and thiamin diphosphate in yeasts. Cell. Mol. Biol. Lett. 2008, 13 (2), 271–82. [DOI] [PMC free article] [PubMed] [Google Scholar]
- Jurgenson C. T.; Begley T. P.; Ealick S. E. The structural and biochemical foundations of thiamin biosynthesis. Annu. Rev. Biochem. 2009, 78, 569–603. [DOI] [PMC free article] [PubMed] [Google Scholar]
- Shi Q.; Karuppagounder S. S.; Xu H.; Pechman D.; Chen H.; Gibson G. E. Responses of the mitochondrial alpha-ketoglutarate dehydrogenase complex to thiamine deficiency may contribute to regional selective vulnerability. Neurochem. Int. 2007, 50 (7−8), 921–31. [DOI] [PMC free article] [PubMed] [Google Scholar]
- Castello P. R.; David P. S.; McClure T.; Crook Z.; Poyton R. O. Mitochondrial cytochrome oxidase produces nitric oxide under hypoxic conditions: implications for oxygen sensing and hypoxic signaling in eukaryotes. Cell. Metab. 2006, 3 (4), 277–87. [DOI] [PubMed] [Google Scholar]
- Poyton R. O.; Ball K. A.; Castello P. R. Mitochondrial generation of free radicals and hypoxic signaling. Trends Endocrinol. Metab. 2009, 20 (7), 332–40. [DOI] [PubMed] [Google Scholar]
- Ascenzi P.; di Masi A.; Sciorati C.; Clementi E. Peroxynitrite-An ugly biofactor?. Biofactors 2010, 36 (4), 264–73. [DOI] [PubMed] [Google Scholar]
- Pun P. B.; Lu J.; Kan E. M.; Moochhala S. Gases in the mitochondria. Mitochondrion 2010, 10 (2), 83–93. [DOI] [PubMed] [Google Scholar]
- Taylor C. T.; Moncada S. Nitric oxide, cytochrome C oxidase, and the cellular response to hypoxia. Arterioscler. Thromb. Vasc. Biol. 2010, 30 (4), 643–7. [DOI] [PubMed] [Google Scholar]
- de Jesus-Berrios M.; Liu L.; Nussbaum J. C.; Cox G. M.; Stamler J. S.; Heitman J. Enzymes that counteract nitrosative stress promote fungal virulence. Curr. Biol. 2003, 13 (22), 1963–8. [DOI] [PubMed] [Google Scholar]
- Ullmann B. D.; Myers H.; Chiranand W.; Lazzell A. L.; Zhao Q.; Vega L. A.; Lopez-Ribot J. L.; Gardner P. R.; Gustin M. C. Inducible defense mechanism against nitric oxide in Candida albicans. Eukaryot. Cell 2004, 3 (3), 715–23. [DOI] [PMC free article] [PubMed] [Google Scholar]
- Poyton R. O.; Castello P. R.; Ball K. A.; Woo D. K.; Pan N. Mitochondria and hypoxic signaling: a new view. Ann. N.Y. Acad. Sci. 2009, 1177, 48–56. [DOI] [PubMed] [Google Scholar]
- Willger S. D.; Grahl N.; Cramer R. A. Jr. Aspergillus fumigatus metabolism: clues to mechanisms of in vivo fungal growth and virulence. Med. Mycol. 2009, 47 (Suppl 1), S72–9. [DOI] [PMC free article] [PubMed] [Google Scholar]
- Hayashi A.; Fujioka S.; Nukina M.; Kawano T.; Shimada A.; Kimura Y.; Fumiquinones A and B, nematicidal quinones produced by Aspergillus fumigatus. Biosci. Biotechnol. Biochem. 2007, 71 (7), 1697–702. [DOI] [PubMed] [Google Scholar]
- Schmeda-Hirschmann G.; Hormazabal E.; Rodriguez J. A.; Theoduloz C.; Cycloaspeptide A and pseurotin A from the endophytic fungus Penicillium janczewskii. Z. Naturforsch. C 2008, 63 (5−6), 383–8. [DOI] [PubMed] [Google Scholar]
Associated Data
This section collects any data citations, data availability statements, or supplementary materials included in this article.