

Abstract
Patients receiving hemodialysis have high rates of cardiovascular morbidity and mortality that may be related to the hemodynamic effects of rapid ultrafiltration. Here we tested whether higher dialytic ultrafiltration rates are associated with greater all-cause and cardiovascular mortality, and hospitalization for cardiovascular disease. We used data from the Hemodialysis Study, an almost-7-year randomized clinical trial of 1846 patients receiving thrice-weekly chronic dialysis. The ultrafiltration rates were divided into three categories: up to 10 ml/h/kg, 10–13 ml/h/kg, and over 13 ml/h/kg. Compared to ultrafiltration rates in the lowest group, rates in the highest were significantly associated with increased all-cause and cardiovascular-related mortality with adjusted hazard ratios of 1.59 and 1.71, respectively. Overall, ultrafiltration rates between 10–13 ml/h/kg were not associated with all-cause or cardiovascular mortality; however, they were significantly associated among participants with congestive heart failure. Cubic spline interpolation suggested that the risk of all-cause and cardiovascular mortality began to increase at ultrafiltration rates over 10 ml/h/kg regardless of the status of congestive heart failure. Hence, higher ultrafiltration rates in hemodialysis patients are associated with a greater risk of all-cause and cardiovascular death.
Keywords: cardiovascular death, hemodialysis, mortality, ultrafiltration
The United States is home to more than 350,000 hemodialysis (HD) patients.1 Dialysis patients experience high rates of mortality, driven largely by an exceptionally high rate of cardiovascular (CV)-related mortality, which exceeds that of the general population by 10- to 20-fold.2,3 Dialysis patients have a high prevalence of traditional CV risk factors such as diabetes and hypertension, as well as a number of additional risk factors related to their kidney dysfunction and/or to the dialytic procedure such as autonomic dysfunction, vascular calcification and stiffness, and increased levels of circulating inflammatory mediators.1,4,5 Unfortunately, many of these factors have proven to be either non-modifiable or difficult to modify within the scope of current dialytic practice.
One compelling and potentially modifiable putative CV risk factor is ultrafiltration rate (UFR; the rate at which fluid is removed during the course of dialysis). As native kidney function wanes, ultrafiltration is necessary to maintain volume control (i.e., salt and water balance), but it simultaneously and disadvantageously promotes non-physiological fluid shifts and hemodynamic instability. In turn, these factors contribute to tissue ischemia, maladaptive cardiac structural changes, myocardial stunning, arrhythmia, and cardiac sudden death.6–14 Despite obvious biological plausibility, the association between UFR and CV morbidity and mortality has not been well studied. The only previous study in this regard examined UFR > 10 (versus ≤10) ml/h/kg, showing a small increase in all-cause mortality (adjusted RR = 1.09; P = 0.02) but no increase in cardiopulmonary mortality (adjusted RR = 1.04; P = 0.41).15 Subsequent data suggest that the cut point of 10 ml/h/kg may have been too low to observe a true UFR–CV mortality association,16 and the issue remains unsettled.
Therefore, we undertook this study in order to clarify the associations between UFR and both all-cause and CV-related mortality among patients undergoing chronic, thrice-weekly HD. We hypothesized that higher UFR would be associated with greater CV-related mortality that, in turn, would drive all-cause mortality. We used the data from the Hemodialysis Study (HEMO), as this study is one of very few large-scale prospective studies in chronic dialysis patients in which the CV outcomes were rigorously adjudicated according to standardized criteria.17 Moreover, we sought to leverage these data to identify a threshold at which higher UFR may be detrimental to CV health and survival.
Results
Baseline characteristics of cohort
Demographic, clinical, and biochemical characteristics of the study population are shown in Table 1. Overall, the cohort consisted of 1,846 patients with a mean age of 57.6 ± 14.0 years; 56.2% were women and 62.6% were black. At baseline 39.7% of the patients carried a diagnosis of congestive heart failure, 39.3% had ischemic heart disease and 44.6% were diabetic.
Table 1. Baseline characteristics of the overall study cohort and comparisons across ultrafiltration groupsa.
| Total (N=1846b) | ≤ 10 ml/h/kg (n=644b) | 10–13 ml/h/kg (n=517b) | > 13 ml/h/kg (n=685b) | Pc | |
|---|---|---|---|---|---|
| UFR (ml/h/kg) | 12.1 (4.6) | 7.7 (1.8) | 11.4 (8.6) | 16.8 (3.6) | — |
| Age (years) | 57.6 (14.0) | 60.4 (13.2) | 57.9 (13.5) | 54.8 (14.7) | < 0.001 |
| Female | 1038 (56.2%) | 367 (57.0%) | 272 (52.6%) | 399 (58.3%) | 0.13 |
| Black | 1156 (62.6%) | 405 (62.9%) | 324 (62.7%) | 427 (62.3%) | 0.98 |
| Smoking | 0.28 | ||||
| Never | 926 (50.2%) | 336 (52.3%) | 257 (49.8%) | 333 (48.7%) | — |
| Past | 597 (32.4%) | 205 (31.9%) | 176 (34.1%) | 216 (31.6%) | — |
| Current | 320 (17.4%) (N=1843) | 102 (15.9%) (n=643) | 83 (16.1%) (n=516) | 135 (19.7%) (n=684) | — |
| Vintage (years) | 0.12 | ||||
| < 1 | 490 (26.5%) | 180 (28.0%) | 135 (26.1%) | 175 (25.6%) | — |
| 1–2 | 382 (20.7%) | 147 (22.8%) | 109 (21.1%) | 126 (18.4%) | — |
| 2–4 | 434 (23.5%) | 136 (21.1%) | 134 (25.9%) | 164 (23.9%) | — |
| ≥ 4 | 540 (29.3%) | 181 (28.1%) | 139 (26.9%) | 220 (32.1%) | — |
| Access | 0.57 | ||||
| Graft | 1112 (60.2%) | 391 (60.7%) | 301 (58.2%) | 420 (61.3%) | — |
| Fistula | 612 (33.2%) | 205 (31.8%) | 184 (35.6%) | 223 (32.6%) | — |
| Catheter | 122 (6.6%) | 48 (7.5%) | 32 (6.2%) | 42 (6.1%) | — |
| Oliguricd | 1579 (86.3%) (N=1830) | 524 (82.0%) (n=639) | 444 (86.4%) (n=514) | 611 (90.3%) (n=677) | < 0.001 |
| SBP (mm Hg) | 0.001 | ||||
| < 120 | 99 (5.4%) | 41 (6.4%) | 28 (5.4%) | 30 (4.4%) | — |
| 120–140 | 438 (23.7%) | 162 (25.2%) | 140 (27.1%) | 136 (19.9%) | — |
| 140–160 | 667 (36.1%) | 247 (38.4%) | 181 (35.0%) | 239 (34.9%) | — |
| 160–180 | 490 (26.5%) | 148 (23.0%) | 136 (26.3%) | 206 (30.1%) | — |
| ≥ 180 | 152 (8.2%) | 46 (7.1%) | 32 (6.2%) | 74 (10.8%) | — |
| Diabetes | 823 (44.6%) | 290 (45.0%) | 242 (46.8%) | 291 (42.5%) | 0.32 |
| Congestive heart failure | 733 (39.7%) | 240 (37.3%) | 192 (37.1%) | 301 (43.9%) | 0.02 |
| Ischemic heart disease | 726 (39.3%) | 251 (39.0%) | 212 (41.0%) | 263 (38.4%) | 0.64 |
| Cerebrovascular disease | 360 (19.5%) | 142 (22.1%) | 104 (20.1%) | 114 (16.6%) | 0.04 |
| Peripheral vascular disease | 474 (25.7%) | 165 (25.6%) | 142 (27.5%) | 167 (24.4%) | 0.48 |
| Albumin (g/dl) | 3.6 (0.4) | 3.6 (0.3) | 3.6 (0.4) | 3.6 (0.4) | 0.63 |
| Creatinine (mg/dl) | 10.3 (2.9) (N=1845) | 10.0 (2.7) | 10.6 (2.9) | 10.3 (3.0) (n=684) | 0.005 |
| Hematocrit (%) | 0.001 | ||||
| < 30 | 334 (18.1%) | 84 (13.1%) | 96 (18.6%) | 154 (22.5%) | — |
| 30–33 | 438 (23.8%) | 153 (23.8%) | 115 (22.3%) | 170 (24.8%) | — |
| 33–36 | 545 (29.6%) | 209 (32.6%) | 159 (30.8%) | 177 (25.8%) | — |
| ≥ 36 | 526 (28.5%) (N=1843) | 196 (30.5%) (n=642) | 146 (28.3%) (n=516) | 184 (26.9%) | — |
| Phosphorous (mg/dl) | 5.8 (1.9) (N=1844) | 5.7 (1.8) (n=642) | 5.7 (1.7) | 6.0 (2.0) | 0.001 |
| ACEi/ARB use | 484 (26.2%) | 152 (23.6%) | 124 (24.0%) | 208 (30.4%) | 0.008 |
| α-1 blocker use | 125 (6.8%) | 51 (7.9%) | 33 (6.4%) | 41 (6.0%) | 0.34 |
| β-Blocker use | 553 (30.0%) | 180 (28.0%) | 151 (29.2%) | 222 (32.4%) | 0.19 |
| Calcium channel blocker use | 910 (49.3%) | 292 (45.3%) | 247 (47.8%) | 371 (54.2%) | 0.004 |
| Nitrate use | 317 (17.2%) | 112 (17.4%) | 81 (15.7%) | 124 (18.1%) | 0.53 |
| Other antihypertensive use | 416 (22.5%) | 127 (19.7%) | 121 (23.4%) | 168 (24.5%) | 0.10 |
| IDWG (kg) | 2.9 (1.1) | 2.1 (0.9) | 3.0 (0.9) | 3.6 (1.0) | < 0.001 |
| Session length (min) | 218 (24) | 226 (21) | 220 (23) | 209 (23) | < 0.001 |
| BMI (kg/m2) | < 0.001 | ||||
| < 18.5 | 125 (6.8%) | 20 (3.1%) | 21 (4.1%) | 84 (12.3%) | — |
| 18.5–24.9 | 896 (48.8%) | 233 (36.4%) | 230 (44.8%) | 433 (63.5%) | — |
| 25–29.9 | 519 (28.3%) | 227 (35.4%) | 165 (32.1%) | 127 (18.6%) | — |
| ≥ 30 | 297 (16.2%) (n=1837) | 161 (25.1%) (n=641) | 98 (19.1%) (n=514) | 38 (5.6%) (n=684) | — |
| High Kt/V group | 920 (49.8%) | 323 (50.2%) | 248 (48.0%) | 349 (51.0%) | 0.58 |
| High flux group | 921 (49.9%) | 329 (51.1%) | 246 (47.6%) | 346 (50.5%) | 0.46 |
Abbreviations: ACEi/ARB, angiotensin-converting enzyme inhibitor and/or angiotensin receptor blocker; BMI, body mass index; IDWG, interdialytic weight gain; SBP, systolic blood pressure; UFR, ultrafiltration rate.
Values presented as mean (s.d.) or n (%).
Except where noted.
Across UFR groups, determined by analysis of variance for continuous variables and χ2-testing for categorical variables.
Urine output ≤ 200 ml/day.
The mean UFR for the cohort was 12.1 ± 4.6 ml/h/kg; 644 (34.9%), 517 (28.0%), and 685 (37.1%) patients had UFR ≤ 10, 10–13, and > 13 ml/h/kg, respectively. Overall, UFR groups were similar in terms of sex, race, dialysis vintage, smoking status, access type, treatment group assignment (flux and Kt/V), diabetes, ischemic heart disease, peripheral vascular disease, serum albumin, and use of most classes of antihypertensive agents (Table 1). At baseline, patients with high UFRs were younger, more likely to have congestive heart failure and oliguria, and less likely to have cerebrovascular disease; they tended to have higher systolic blood pressures, serum creatinine and phosphate concentrations, and lower hematocrits. Not surprisingly, high UFR was associated with increased interdialytic weight gain and shorter HD session length.
Associations between UFR and all-cause and CV mortality
Overall, 871 deaths occurred during 5,233 patient-years of at-risk time; 343 of these deaths were due to CV causes. The median survival time was 2.5 years. Compared with UFR ≤ 10 ml/h/kg, UFR > 13 ml/h/kg was significantly associated with all-cause mortality: unadjusted hazard ratio (HR) (95% confidence interval (CI)) 1.20 (1.03–1.41) (Figure 1). When multivariable adjustment was used to account for baseline differences between groups, this association was greatly potentiated: HR (95% CI) 1.59 (1.29–1.96). UFR 10–13 ml/h/kg bore an intermediate association with CV mortality that was not statistically significant: adjusted HR (95% CI) 1.06 (0.87–1.28). Results were similar when UFRs following the long interdialytic break were excluded from consideration, when the referent group was restricted to participants with UFR 8–10 ml/h/kg (data not shown), and when flux and Kt/V treatment group assignments were included as covariates in the statistical model (Supplementary Table SA online).
Figure 1. Unadjusted and adjusted associations between ultrafiltration rate (UFR) and all-cause mortality based on Cox regression models.
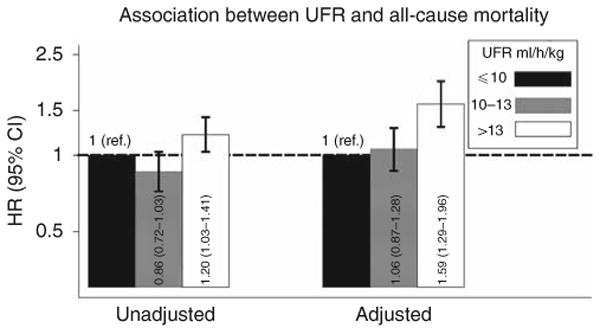
Multivariable models were adjusted for age, sex, interdialytic weight gain, race (black, non-black), smoking status (never, past, current), vintage (< 1, 1–2, 2–4, ≥ 4 years), access type (graft, fistula, catheter), systolic blood pressure (< 120, 120–140, 140–160, 160–180, ≥ 180 mm Hg), residual urine output (≤ versus > 200 ml/day), diabetes, congestive heart failure, peripheral vascular disease, ischemic heart disease, cerebrovascular disease, serum albumin, creatinine, hematocrit (< 30, 30–33, 33–36, ≥ 36%), and phosphorus, and use of α-adrenergic blocker, angiotensin-converting enzyme inhibitor/angiotensin receptor blocker, β-blocker, calcium channel blocker, nitrates, and other antihypertensives. Two-way cross-product terms with time were included for albumin and systolic blood pressure due to non-proportional hazards. Abbreviations: ref., reference; CI, confidence interval; HR, hazard ratio.
Similarly, compared with UFR ≤ 10 ml/h/kg, UFR > 13 ml/h/kg was associated with increased CV mortality: unadjusted HR (95% CI) 1.33 (1.03–1.72) (Figure 2). Upon multivariable adjustment, this association was greatly potentiated: adjusted HR (95% CI) 1.71 (1.23–2.38). UFR 10–13 ml/h/kg bore an intermediate association with CV mortality that was not statistically significant: adjusted HR (95% CI) 1.06 (0.78–1.44). Again, results were similar when UFRs following the long interdialytic break were excluded from consideration, when the referent group was restricted to participants with UFR 8–10 ml/h/kg (data not shown), and when flux and Kt/V treatment group assignments were included as covariates in the statistical model (Supplementary Table SA online).
Figure 2. Unadjusted and adjusted associations between ultrafiltration rate (UFR) and cardiovascular (CV)-related mortality based on Cox regression models.
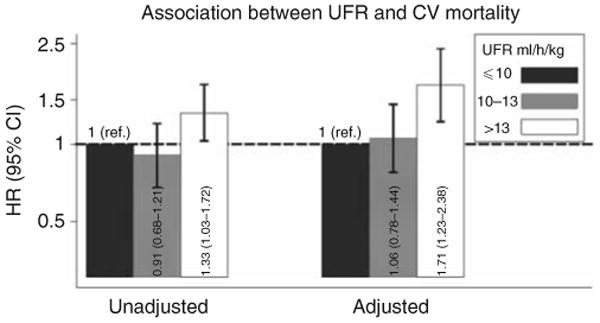
Multivariable models were adjusted for age, sex, interdialytic weight gain, race (black, non-black), smoking status (never, past, current), vintage (< 1, 1–2, 2–4, ≥4 years), access type (graft, fistula, catheter), systolic blood pressure (< 120, 120–140, 140–160, 160–180, ≥ 180 mm Hg), residual urine output (≤ versus > 200 ml/day), diabetes, congestive heart failure, peripheral vascular disease, ischemic heart disease, cerebrovascular disease, serum albumin, creatinine, hematocrit (< 30, 30–33, 33–36, ≥ 36%), and phosphorus, and use of α-adrenergic blocker, angiotensin-converting enzyme inhibitor/angiotensin receptor blocker, β-blocker, calcium channel blocker, nitrates, and other antihypertensives. A two-way cross-product term with time was included for albumin due to non-proportional hazards. Abbreviations: ref., reference; CI, confidence interval; HR, hazard ratio.
The data suggested effect modification of the UFR–mortality and UFR–CV mortality associations on the basis of congestive heart failure. Specifically, UFR between 10 and 13 ml/kg/h was associated with greater all-cause mortality and nearly associated with greater CV mortality among patients with congestive heart failure, but was not among patients without congestive heart failure (Table 2). The estimates for UFR > 13 ml/kg/h did not appear to be materially affected by the presence or absence of congestive heart failure; point estimates of both groups were similar to those from the primary analyses. No effect modification on the basis of oliguria, arterial disease (coronary, cerebral, or peripheral arterial), or HEMO Study treatment group assignment (flux or dose) was detected (data not shown).
Table 2. Effect modification of the association between UFR and all-cause and CV mortality on the basis of congestive heart failure.
| UFR | Congestive heart failure (−) | Congestive heart failure (+) | P-interactionb | ||
|---|---|---|---|---|---|
| Adjusted HR (95% CI)a | P | Adjusted HR (95% CI)a | P | ||
| All-cause mortality | 0.002 | ||||
| ≤ 10 ml/h/kg | 1.00 (ref.) | — | 1.00 (ref.) | — | — |
| 10–13 ml/h/kg | 0.80 (0.64–1.05) | 0.11 | 1.41 (1.09–1.81) | 0.008 | — |
| > 13 ml/h/kg | 1.61 (1.23–2.11) | 0.001 | 1.59 (1.24–2.05) | 0.008 | — |
| CV-related mortalityc | 0.07 | ||||
| ≤ 10 ml/h/kg | 1.00 (ref.) | — | 1.00 (ref.) | — | — |
| 10–13 ml/h/kg | 0.76 (0.48–1.20) | 0.24 | 1.41 (0.94–2.11) | 0.10 | — |
| > 13 ml/h/kg | 1.70 (1.11–2.62) | 0.02 | 1.73 (1.15–2.59) | 0.008 | — |
Abbreviations: CI, confidence interval; CV, cardiovascular; HR, hazard ratio; ref., reference; SBP, systolic blood pressure; UFR, ultrafiltration rate.
Models adjusted for age, sex, interdialytic weight gain, race (black, non-black), smoking status (never, past, current), vintage (< 1, 1–2, 2–4, ≥ 4 years), access type (graft, fistula, catheter), SBP (< 120, 120–140, 140–160, 160–180, ≥ 180 mm Hg), residual urine output (≤versus > 200 ml/day), diabetes, congestive heart failure, peripheral vascular disease, ischemic heart disease, cerebrovascular disease), serum albumin, creatinine, hematocrit (< 30, 30–33, 33–36, ≥ 36%), and phosphorus, and use of α-adrenergic blocker, angiotensin-converting enzyme inhibitor/angiotensin receptor blocker, β-blocker, calcium channel blocker, nitrates, and other antihypertensives. Two-way cross-product terms with time were included for albumin and SBP in analyses of all-cause mortality and for albumin in analyses of CV-related mortality due to non-proportional hazards.
Based on likelihood ratio testing.
CV events were those attributed to ischemic heart disease, congestive heart failure, arrhythmias and conduction problems, sudden cardiac death due to heart conditions other than ischemic heart disease/arrhythmia, valvular defects, hypertensive crisis, or accelerated hypertension, cerebral vascular disease, and vascular disease, including ruptured vascular aneurysm, peripheral vascular disease, mesenteric ischemia, and arterial embolism and thrombosis.
Secondary analyses
In order to more fully examine the threshold(s) at which UFR may become harmful, we conducted analyses in which we examined the association of UFR, represented as a cubic spline, with CV and all-cause mortality. As demonstrated in Figure 3, the HRs for both CV and all-cause mortality rose sharply at values between 10 and 14 ml/h/kg, and to a less pronounced degree at higher values. Consistent with results of the primary analysis, the HR for CV mortality was greater than that for all-cause mortality at all values of UFR.
Figure 3. Cubic spline analysis of the associations between ultrafiltration rate (UFR) and cardiovascular (CV) (solid line) and all-cause (dashed line) mortality.
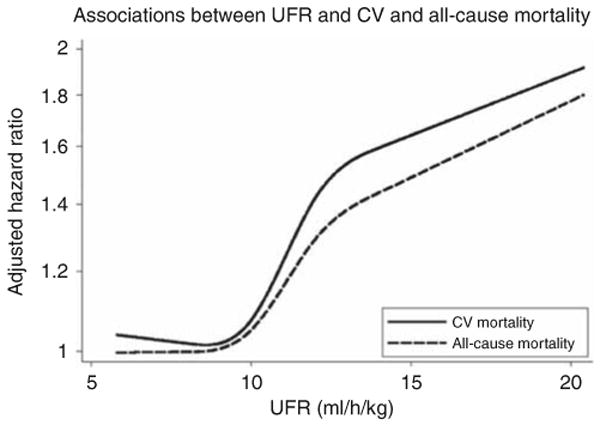
Hazard ratios were adjusted for age, sex, interdialytic weight gain, race (black, non-black), smoking status (never, past, current), vintage (< 1, 1–2, 2–4, ≥4 years), access type (graft, fistula, catheter), systolic blood pressure (< 120, 120–140, 140–160, 160–180, ≥ 180 mm Hg), residual urine output (≤ versus > 200 ml/day), diabetes, congestive heart failure, peripheral vascular disease, ischemic heart disease, cerebrovascular disease, serum albumin, creatinine, hematocrit (< 30, 30–33, 33–36, ≥ 36%), and phosphorus, and use of α-adrenergic blocker, angiotensin-converting enzyme inhibitor/angiotensin receptor blocker, β-blocker, calcium channel blocker, nitrates, and other antihypertensives. Estimates are presented for UFRs between 5.8 ml/h/kg (the 5th percentile of observed UFR in the study sample) and 20.4 ml/h/kg (the 95th percentile).
In order to examine the association between UFR and CV-related morbidity, we conducted time-to-event analyses in which the outcomes of interest were (1) hospitalization for CV disease or all-cause mortality (n = 1081); (2) hospitalization for CV disease or CV mortality (n = 843); and (3) hospitalization for CV disease (n = 742). In total, participants contributed 3762 patient-years of at-risk time with a median survival time of 1.5 years. In each instance, UFR > 13 ml/kg/h was potently and significantly associated with a greater hazard for outcome, whereas UFR 10–13 ml/kg/h was not (Figure 4).
Figure 4. Adjusted association between ultrafiltration rate (UFR) and (1) cardiovascular (CV) hospitalization and all-cause mortality, (2) CV hospitalization and CV-related mortality, and (3) CV hospitalization.
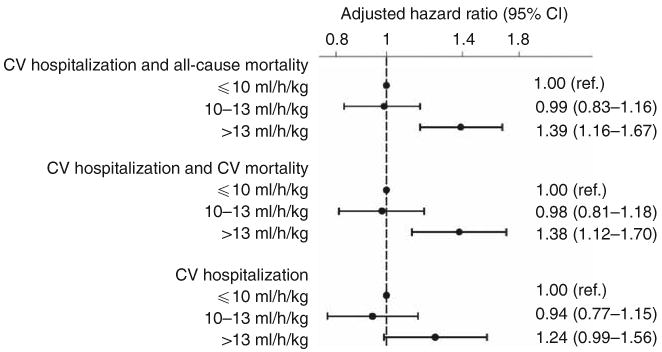
Based on Cox regression models adjusted for age, sex, interdialytic weight gain, race (black, non-black), smoking status (never, past, current), vintage (< 1, 1–2, 2–4, ≥ 4 years), access type (graft, fistula, catheter), systolic blood pressure (< 120, 120–140, 140–160, 160–180, ≥ 180 mm Hg), residual urine output (≤ versus > 200 ml/day), diabetes, congestive heart failure, peripheral vascular disease, ischemic heart disease, cerebrovascular disease, serum albumin, creatinine, hematocrit (< 30, 30–33, 33–36, ≥ 36%), and phosphorus, and use of α-adrenergic blocker, angiotensin-converting enzyme inhibitor/angiotensin receptor blocker, β-blocker, calcium channel blocker, nitrates, and other antihypertensives. Unadjusted estimates (not shown) for the relationship between UFR (10–13 and > 13 ml/h/kg, respectively) and outcomes were: 0.88 (0.76–1.03; P = 0.13) and 1.21 (1.05–1.40; P = 0.01) for CV hospitalization and all-cause mortality; 0.90 (0.76–1.08; P = 0.26) and 1.23 (1.05–1.45; P = 0.01) for CV hospitalization and CV-related mortality; and 0.88 (0.73–1.06; P = 0.18) and 1.14 (0.96–1.36; P = 0.13) for CV hospitalization. Abbreviations: ref., reference; CI, confidence interval.
Discussion
Despite the highly plausible biological link between dialytic ultrafiltration and CV morbidity and mortality, such an association has not been previously described in the literature. In this report we demonstrated for the first time that higher UFRs are associated with greater CV (as well as all-cause) mortality. Risk for CV hospitalization and composite CV hospitalization/mortality end points followed a similar pattern. Cubic spine analysis further substantiated these findings, revealing a steep rise in the risk for all-cause and CV mortality at UFRs > 10 ml/h/kg.
Only one previous study has examined the association between UFR and CV mortality, failing to show a significant difference in risk between participants with UFR ≤ 10 versus > 10 ml/h/kg.15 Subsequent work (which considered all-cause but not CV mortality) suggested that a threshold of 10 ml/h/kg may have been too low to demonstrate a true association.16 Correspondingly, our categorical analysis demonstrated a significant association between CV mortality and UFR > 13 ml/h/kg, but not 10–13 ml/h/kg. However, cubic spline interpolation indicated that the risk of CV death does begin to rise when UFR exceeds ∼ 10 ml/h/kg, suggesting that the absence of association in the 10–13 ml/h/kg stratum derived from the modest effects of those UFRs that were close to 10 and from the modest sample size of this stratum (517 participants, 82 CV-deaths). Interestingly, our data suggest effect modification of the UFR–mortality and UFR–CV mortality associations on the basis of congestive heart failure, suggesting that even modestly elevated UFR (10–13 ml/h/kg) may be disadvantageous in these high-risk patients.
The association between higher UFR and increased CV morbidity and mortality should not be surprising. During dialysis, fluid is removed directly from the vascular space; when dialytic removal outpaces resorption from other compartments, circulating volume is reduced and transient myocardial ischemia can result. This effect is amplified by limitations in cardiac reserve and autonomic dysfunction, both of which are common among HD patients.18–22 Previous research has demonstrated that transient ischemia during dialysis can result in ‘myocardial stunning’ (regional wall motion abnormalities) and associated compromises in cardiac contractility, systolic function, and survival.8,23–25 In Burton's analysis, higher ultrafiltration volumes were associated with the presence of HD-induced regional wall motion abnormalities (P = 0.01),8 providing a plausible mechanism for the strong association between high UFRs and CV mortality demonstrated in our analyses. From animal studies, it is known that repeated myocardial stunning triggers a cascade of events, including myocardial hibernation, fibrosis, and remodeling, which predispose to ventricular dysfunction and arrhythmia.26 Ventricular dysfunction in dialysis patients can be particularly hazardous as it has been linked to greater hemodynamic instability during dialysis, which can result in a vicious cycle of further myocardial stunning and cardiac decline.23
There are two options to minimize UFR in current clinical practice: (1) limit patients' fluid intake and (2) allow more time for fluid removal (i.e., extend dialysis time). Clinical experience and published data demonstrate that interventions aimed at reducing patients' interdialytic fluid intake are often ineffective.27,28 Moreover, in these analyses, we demonstrate that greater UFRs are associated with poor prognosis independent of (i.e., adjusted for) interdialytic weight gain, suggesting that more gradual volume removal is associated with improved outcomes regardless of the magnitude of weight gain itself. In current practice, session length is determined by indices of small molecule (i.e., urea) clearance; UFR is adjusted to allow for necessary removal of intercurrent fluid gains within this fixed time allotment. Our findings suggest that perhaps UFR should factor more prominently into determination of dialytic session length. Such a model might involve session length titration on a (near) session-to-session basis based on observed intradialytic weight gain (with some floor level determined by consideration of urea clearance). In addition, UFR might be minimized by more frequent dialysis (which allows less intervening time for fluid accumulation) or by wearable ultrafiltration technologies that enable fluid removal even during the interdialytic interval; ongoing studies are examining the feasibility and health effects of these approaches.29,30
Strengths of this study include the prospective and rigorous data collection, standardized adjudication of death/hospitalization events, and robust sample size in the HEMO Study. Several limitations of this study bear mention. As with any observational analysis, there exists the potential for residual confounding and bias. To minimize risk for residual confounding, we adjusted estimates for variables plausibly associated with both UFR and mortality, such as age, gender, comorbid conditions, dialysis access type, and antihypertensive medication use; however, we cannot exclude the possibility of residual confounding on the basis of these variables or by other variables not considered. A second weakness may be in our use of observed rather than prescribed UFR as this may have introduced misclassification bias into our UFR calculation (e.g., hypotension-necessitated fluid boluses would decrease pre-to-post session weight change, thus underestimating the rate at which fluid was actually removed during treatment); likewise, changes in UFR within individual participants after baseline may have also resulted in misclassification. Such misclassification, however, would be expected to bias findings toward the null, rendering our estimates conservative. Finally, the HEMO Study excluded the very elderly (> 80 years old), patients with New York Heart Association Class IV heart failure and unstable angina, and most patients > 100 kg (on the basis of inability to achieve target Kt/V), which may limit generalizability to these sub-populations.17 Nonetheless, we believe that our results apply to the vast majority of the overall US HD population.
In conclusion, this study shows that among chronic HD patients, UFRs > 13 ml/h/kg are associated with increased all-cause mortality and even more so with CV mortality. Further prospective studies are needed to confirm and generalize findings and to investigate interventional strategies aimed at mitigating CV risk through minimization of UFR.
Methods
Study design
This study was deemed exempt by the Partners Health Care Institutional Review Board. All study data were derived from the HEMO Study, and were obtained from the National Institute of Diabetes and Digestive and Kidney Diseases (NIDDK) data repository with permission from the NIDDK. The HEMO Study was a 2 × 2 factorial multicenter randomized trial to evaluate the effects of dialysis dose and membrane flux on clinical outcomes. The design and methods have been previously reported.17,31 Briefly, all participants had been on HD for at least 3 months, continued to receive HD thrice-weekly, and were between the ages of 18 and 80 years; they were enrolled between March 1995 and October 2000 at 15 clinical centers; maximum potential follow-up time was 6.6 years.17,31 Notable HEMO exclusion criteria included New York Heart Association class IV heart failure despite maximal therapy, unstable angina pectoris, and failure to achieve an equilibrated Kt/V of 1.3 in <4.5 h during two consecutive dialysis sessions (an exclusion that led to 97% of randomized patients being <100 kg).
Data collection
Per HEMO protocol, all study data were obtained via subject interviews, medical chart reviews, and self-reported questionnaires. Demographics including age, sex, race, and time since the start of dialysis (vintage) were assessed at baseline. Existence of comorbid medical conditions, including diabetes, congestive heart failure, ischemic heart disease, cerebrovascular disease, peripheral vascular disease, and tobacco use, was assessed at baseline, week 5, and then annually. Dialysis treatment parameters (including ultrafiltration volume, treatment duration, vascular access type, and intradialytic symptoms), physiological parameters (including residual urine output and pre-, post-, and intradialytic blood pressures), relevant laboratory measures (including serum albumin, creatinine, phosphate, and hematocrit), and medication use (including angiotensin-converting enzyme inhibitors, angiotensin receptor blockers, β-blockers, calcium channel blockers, nitrates, and other antihypertensive) were measured at baseline and then monthly.
All deaths and all hospitalizations incurred by HEMO participants were investigated in a standardized manner. Death/hospitalization events were reported by the local center to study investigators. For hospitalizations and deaths occurring in hospital, hospital records including the narrative summary, selected physician notes, pertinent laboratory, imaging, and electrocardiogram data were retrieved and abstracted by study personnel according to a standardized procedure. In addition, for all deaths (in or out of hospital), death certificates and autopsy results (where applicable) were retrieved and abstracted.
Designation of exposures and outcomes
Per routine practice, ultrafiltration volume was measured as the change in weight over the course of dialysis (i.e., pre-dialysis weight minus post-dialysis weight). UFR was expressed in terms of ml/h/kg by dividing the ultrafiltration volume by dialysis session length and target weight.15,16 In the primary analysis, UFR was categorized as ≤ 10 ml/h/kg, 10–13 ml/h/kg, and >13 ml/h/kg based on precedent in the literature.15,16 Secondary analysis considered a cubic spline representation of UFR.
A blinded outcome review committee convened by the HEMO investigators adjudicated cause of death (i.e., CV, non-CV). For each death, records (collected as above) were reviewed by two committee members; disagreements were settled by majority vote of the full outcome committee.17 Attribution of cause of hospitalization was adjudicated in an analogous manner. CV events were considered to be those ascribed to ischemic heart disease; congestive heart failure; arrhythmias and conduction problems; sudden cardiac death due to heart conditions other than ischemic heart disease/arrhythmia; valvular defects; hypertensive crisis or accelerated hypertension; cerebral vascular disease; and vascular disease, including ruptured vascular aneurysm, peripheral vascular disease, mesenteric ischemia, and arterial embolism/thrombosis.
Statistical analyses
All analyses were performed using STATA 10.0MP (College Station, TX). Baseline subject characteristics were described as counts and proportions for categorical variables and as means and s.d. for continuous variables. Bivariable comparisons across UFR groups were made using contingency table methods and χ2-testing or analysis of variance, as dictated by data type.
Baseline values of UFR (and covariates) were considered as the mean of values prior to randomization (typically consisting of between 1 and 4 measurements made over 4–6 weeks). Participants were considered at-risk from their date of randomization until death or censoring. Censoring events for analyses of all-cause mortality and CV mortality were receipt of a kidney transplant and the end of the study period (31 December 2001); for analyses of CV mortality, death due to non-CV cause was considered as a censoring criterion as well. For analyses considering hospitalization events, participants were additionally censored at the time of study withdrawal, change in dialytic modality, or transfer of care to a non-participating dialysis center (hospitalization data were not available to investigators in these instances, whereas vital status was followed and complete for all participants irrespective of these events).
Analogous methods were used to investigate the associations between UFR and outcomes of interest: all-cause mortality, CV mortality, CV hospitalization, and composites of these. Likelihood ratio testing was used to assess for effect modification of the association between UFR and outcomes on the basis of treatment group assignment; as no significant interaction was detected, data were pooled across (flux and dose) intervention groups (Supplementary Table SB online). The unadjusted associations between UFR and survival were estimated using Kaplan–Meier methods, logrank testing, and unadjusted Cox proportional hazards models. Adjusted associations between UFR and survival were estimated using multivariable Cox proportional hazards models with inclusion of covariate terms for potential confounders. Covariates were selected as those variables that might plausibly be associated with both UFR and outcomes based on clinical precedent and evidence from the literature. (In addition, we examined for potential confounding on the basis of HEMO Study interventions (i.e., flux and treatment groups); upon inclusion of these variables in the statistical model, estimates of association between UFR and outcomes were unchanged (Supplementary Table SA online), indicating no confounding on this basis. Therefore, treatment group assignments were not included in the final multivariable models.) Specification of continuous covariates (linear versus categorical) was guided by each covariate's observed association with outcome, as assessed by graphical evaluation of regression coefficients, Akaike's Information Criterion, and Martingale residual plots. All models were stratified on clinical center; robust variance estimates were used to account for clustering of observations within unit. The proportionality assumption for each model was tested graphically and by Schoenfeld residual testing; two-way time cross-product terms were included for variables that violated the proportionality assumption (e.g., albumin and systolic blood pressure).
In addition, we constructed a restricted cubic spline representation of UFR, with knots corresponding to 8, 10, 12, and 14 ml/h/kg, measuring the associations with all-cause and CV mortality in a manner otherwise analogous. Cubic splines provide a flexible mechanism by which to model continuous predictors. Splines are created by fitting a series of cubic polynomials between data points to form a smooth curve that assesses change over intervals of the exposure variable (i.e., UFR); thus, providing an alternative to categorical and continuous organization of a predictor, which can more faithfully reflect the observed data.
Effect modification of the UFR–survival association on the basis of residual urine output, arterial disease (coronary, cerebrovascular, or peripheral vascular), and congestive heart failure was explored by introduction of two-way interaction terms (e.g., UFR × congestive heart failure) into the primary multivariable model (separately); significance was assessed using likelihood ratio testing with a nominal two-tailed P-value of 0.10 to account for the relative insensitivity of these tests.
Supplementary Material
Table SA. Adjusted HRs (95% CIs) for the associations between UFR and all-cause and CV mortality with and without the addition of covariate terms to indicate flux and dose treatment group assignments.
Table SB. P values for interaction between UFR and treatment group assignment. Estimates were derived by likelihood ratio testing comparing each model with and without inclusion of two-way UFR-by-treatment group assignment cross product terms (separately for dose and flux interventions).
Acknowledgments
We thank the HEMO Study investigators and the NIDDK data repository for the data used in this study. The HEMO Study was performed by the HEMO Study investigators and supported by the National Institute of Diabetes and Digestive and Kidney Diseases. This paper was not prepared in collaboration with the investigators of the HEMO Study and does not necessarily reflect the opinions or views of the HEMO Study or the NIDDK. This work was supported by an award from the NIH/NIDDK (DK079056 to SMB).
Footnotes
Disclosure: SMB has served on medical advisory boards for Amgen and C.B. Fleet Company; his spouse is an employee at Genzyme. He has received speaking honoraria from Fresenius Medical Care and Genzyme, and is on retainer as an expert witness for C.B. Fleet Company and Proctor and Gamble.
Supplementary material is linked to the online version of the paper at http://www.nature.com/ki
References
- 1.USRDS. Annual Data Report: Atlas of Chronic Kidney Disease and End-Stage Renal Disease in the United States. National Institutes of Health, National Institute of Diabetes and Digestive and Kidney Diseases; Bethesda, MD: 2008. [Google Scholar]
- 2.Foley RN, Parfrey PS, Sarnak MJ. Clinical epidemiology of cardiovascular disease in chronic renal disease. Am J Kidney Dis. 1998;32:S112–S119. doi: 10.1053/ajkd.1998.v32.pm9820470. [DOI] [PubMed] [Google Scholar]
- 3.Weiner DE, Tighiouart H, Amin MG, et al. Chronic kidney disease as a risk factor for cardiovascular disease and all-cause mortality: a pooled analysis of community-based studies. J Am Soc Nephrol. 2004;15:1307–1315. doi: 10.1097/01.asn.0000123691.46138.e2. [DOI] [PubMed] [Google Scholar]
- 4.Shroff RC, McNair R, Figg N, et al. Dialysis accelerates medial vascular calcification in part by triggering smooth muscle cell apoptosis. Circulation. 2008;118:1748–1757. doi: 10.1161/CIRCULATIONAHA.108.783738. [DOI] [PubMed] [Google Scholar]
- 5.Pecoits-Filho R, Heimburger O, Barany P, et al. Associations between circulating inflammatory markers and residual renal function in CRF patients. Am J Kidney Dis. 2003;41:1212–1218. doi: 10.1016/s0272-6386(03)00353-6. [DOI] [PubMed] [Google Scholar]
- 6.Shoji T, Tsubakihara Y, Fujii M, et al. Hemodialysis-associated hypotension as an independent risk factor for two-year mortality in hemodialysis patients. Kidney Int. 2004;66:1212–1220. doi: 10.1111/j.1523-1755.2004.00812.x. [DOI] [PubMed] [Google Scholar]
- 7.John AS, Tuerff SD, Kerstein MD. Nonocclusive mesenteric infarction in hemodialysis patients. J Am Coll Surg. 2000;190:84–88. doi: 10.1016/s1072-7515(99)00226-4. [DOI] [PubMed] [Google Scholar]
- 8.Burton JO, Jefferies HJ, Selby NM, et al. Hemodialysis-induced cardiac injury: determinants and associated outcomes. Clin J Am Soc Nephrol. 2009;4:914–920. doi: 10.2215/CJN.03900808. [DOI] [PMC free article] [PubMed] [Google Scholar]
- 9.Cotter G, Felker GM, Adams KF, et al. The pathophysiology of acute heart failure—is it all about fluid accumulation? Am Heart J. 2008;155:9–18. doi: 10.1016/j.ahj.2006.02.038. [DOI] [PubMed] [Google Scholar]
- 10.Sharpe N. Left ventricular remodeling: pathophysiology and treatment. Heart Fail Monit. 2003;4:55–61. [PubMed] [Google Scholar]
- 11.Martin LC, Franco RJ, Gavras I, et al. Association between hypervolemia and ventricular hypertrophy in hemodialysis patients. Am J Hypertens. 2004;17:1163–1169. doi: 10.1016/j.amjhyper.2004.07.017. [DOI] [PubMed] [Google Scholar]
- 12.Ritz E, Wanner C. The challenge of sudden death in dialysis patients. Clin J Am Soc Nephrol. 2008;3:920–929. doi: 10.2215/CJN.04571007. [DOI] [PubMed] [Google Scholar]
- 13.Zoccali C, Benedetto FA, Tripepi G, et al. Cardiac consequences of hypertension in hemodialysis patients. Semin Dial. 2004;17:299–303. doi: 10.1111/j.0894-0959.2004.17331.x. [DOI] [PubMed] [Google Scholar]
- 14.Glassock RJ, Pecoits-Filho R, Barberato SH. Left ventricular mass in chronic kidney disease and ESRD. Clin J Am Soc Nephrol. 2009;4(Suppl 1):S79–S91. doi: 10.2215/CJN.04860709. [DOI] [PubMed] [Google Scholar]
- 15.Saran R, Bragg-Gresham JL, Levin NW, et al. Longer treatment time and slower ultrafiltration in hemodialysis: associations with reduced mortality in the DOPPS. Kidney Int. 2006;69:1222–1228. doi: 10.1038/sj.ki.5000186. [DOI] [PubMed] [Google Scholar]
- 16.Movilli E, Gaggia P, Zubani R, et al. Association between high ultrafiltration rates and mortality in uraemic patients on regular haemodialysis. A 5-year prospective observational multicentre study. Nephrol Dial Transplant. 2007;22:3547–3552. doi: 10.1093/ndt/gfm466. [DOI] [PubMed] [Google Scholar]
- 17.Greene T, Beck GJ, Gassman JJ, et al. Design and statistical issues of the Hemodialysis (HEMO) Study. Control Clin Trials. 2000;21:502–525. doi: 10.1016/s0197-2456(00)00062-3. [DOI] [PubMed] [Google Scholar]
- 18.Lilley JJ, Golden J, Stone RA. Adrenergic regulation of blood pressure in chronic renal failure. J Clin Invest. 1976;57:1190–1200. doi: 10.1172/JCI108387. [DOI] [PMC free article] [PubMed] [Google Scholar]
- 19.Friess U, Rascher W, Ritz E, et al. Failure of arginine-vasopressin and other pressor hormones to increase in severe recurrent dialysis hypotension. Nephrol Dial Transplant. 1995;10:1421–1427. [PubMed] [Google Scholar]
- 20.Daul AE, Wang XL, Michel MC, et al. Arterial hypotension in chronic hemodialyzed patients. Kidney Int. 1987;32:728–735. doi: 10.1038/ki.1987.267. [DOI] [PubMed] [Google Scholar]
- 21.Converse RL, Jr, Jacobsen TN, Jost CM, et al. Paradoxical withdrawal of reflex vasoconstriction as a cause of hemodialysis-induced hypotension. J Clin Invest. 1992;90:1657–1665. doi: 10.1172/JCI116037. [DOI] [PMC free article] [PubMed] [Google Scholar]
- 22.Nette RW, van den Dorpel MA, Krepel HP, et al. Hypotension during hemodialysis results from an impairment of arteriolar tone and left ventricular function. Clin Nephrol. 2005;63:276–283. doi: 10.5414/cnp63276. [DOI] [PubMed] [Google Scholar]
- 23.Burton JO, Jefferies HJ, Selby NM, et al. Hemodialysis-induced repetitive myocardial injury results in global and segmental reduction in systolic cardiac function. Clin J Am Soc Nephrol. 2009;4:1925–1931. doi: 10.2215/CJN.04470709. [DOI] [PMC free article] [PubMed] [Google Scholar]
- 24.Selby NM, Burton JO, Chesterton LJ, et al. Dialysis-induced regional left ventricular dysfunction is ameliorated by cooling the dialysate. Clin J Am Soc Nephrol. 2006;1:1216–1225. doi: 10.2215/CJN.02010606. [DOI] [PubMed] [Google Scholar]
- 25.Selby NM, Lambie SH, Camici PG, et al. Occurrence of regional left ventricular dysfunction in patients undergoing standard and biofeedback dialysis. Am J Kidney Dis. 2006;47:830–841. doi: 10.1053/j.ajkd.2006.01.012. [DOI] [PubMed] [Google Scholar]
- 26.Shivalkar B, Flameng W, Szilard M, et al. Repeated stunning precedes myocardial hibernation in progressive multiple coronary artery obstruction. J Am Coll Cardiol. 1999;34:2126–2136. doi: 10.1016/s0735-1097(99)00467-2. [DOI] [PubMed] [Google Scholar]
- 27.Sharp J, Wild MR, Gumley AI, et al. A cognitive behavioral group approach to enhance adherence to hemodialysis fluid restrictions: a randomized controlled trial. Am J Kidney Dis. 2005;45:1046–1057. doi: 10.1053/j.ajkd.2005.02.032. [DOI] [PubMed] [Google Scholar]
- 28.Bame SI, Petersen N, Wray NP. Variation in hemodialysis patient compliance according to demographic characteristics. Soc Sci Med. 1993;37:1035–1043. doi: 10.1016/0277-9536(93)90438-a. [DOI] [PubMed] [Google Scholar]
- 29.Suri RS, Garg AX, Chertow GM, et al. Frequent Hemodialysis Network (FHN) randomized trials: study design. Kidney Int. 2007;71:349–359. doi: 10.1038/sj.ki.5002032. [DOI] [PubMed] [Google Scholar]
- 30.Gura V, Macy AS, Beizai M, et al. Technical breakthroughs in the wearable artificial kidney (WAK) Clin J Am Soc Nephrol. 2009;4:1441–1448. doi: 10.2215/CJN.02790409. [DOI] [PMC free article] [PubMed] [Google Scholar]
- 31.Eknoyan G, Beck GJ, Cheung AK, et al. Effect of dialysis dose and membrane flux in maintenance hemodialysis. N Engl J Med. 2002;347:2010–2019. doi: 10.1056/NEJMoa021583. [DOI] [PubMed] [Google Scholar]
Associated Data
This section collects any data citations, data availability statements, or supplementary materials included in this article.
Supplementary Materials
Table SA. Adjusted HRs (95% CIs) for the associations between UFR and all-cause and CV mortality with and without the addition of covariate terms to indicate flux and dose treatment group assignments.
Table SB. P values for interaction between UFR and treatment group assignment. Estimates were derived by likelihood ratio testing comparing each model with and without inclusion of two-way UFR-by-treatment group assignment cross product terms (separately for dose and flux interventions).