

Abstract
Hypertension is associated with increased left ventricular mass (LVM) and carotid intima‐media thickness (cIMT), which predict cardiovascular (CV) events in adults. Whether target organ damage is found in pre‐hypertensive youth is not known. The authors measured body mass index, blood pressure, fasting glucose, insulin, lipids and C‐reactive protein, LVM/height2.7 (LVM index), diastolic function, cIMT, carotid stiffness, augmentation index, brachial artery distensibility, and pulse wave velocity (PWV) in 723 patients aged 10 to 23 years (29% with type 2 diabetes mellitus). Patients were stratified by blood pressure level (normotensive: 531, pre‐hypertensive: 65, hypertensive: 127). Adiposity and CV risk factors worsened across blood pressure group. There was a graded increase in cIMT, arterial stiffness, and LVM index and decrease in diastolic function from normotension to pre‐hypertension to hypertension. In multivariable models adjusted for CV risk factors, status as pre‐hypertension or hypertension remained an independent determinant of target organ damage for LVM, diastolic function, internal cIMT, and carotid and arterial stiffness. Pre‐hypertension is associated with cardiovascular target organ damage in adolescents and young adults.
J Clin Hypertens (Greenwich). 2011;13:332–342. ©2011 Wiley Periodicals, Inc.
Hypertension (HTN) is an established risk factor for target organ damage (TOD) in adults. High blood pressure (BP) is associated with increased left ventricular mass (LVM), 1 carotid intima‐media thickness (cIMT), 2 and arterial stiffness. 3 Since TOD is known to predict hard cardiovascular (CV) events, 4 , 5 , 6 screening for TOD has become an established practice in preventive care for adults at risk for complications related to elevated BP. 7 , 8 Recent data suggest that no safe cutpoint for BP exists as pre‐hypertension (pre‐HTN) (between the 90th and 95th percentile for patients younger than 18 years or between 120/80 mm Hg and 140/90 mm Hg for adults) may progress to HTN 9 and TOD may begin at pre‐hypertensive levels. 10 Studies in youth have documented TOD with sustained HTN, 11 but few data exist showing an increase in left ventricular hypertrophy in pre‐HTN youth 12 and data on arterial abnormalities are lacking. Determining the prevalence of TOD in youth at borderline levels of BP is important since current pediatric guidelines 13 determine treatment levels based on arbitrary cutpoints without reference to hard CV events or intermediate noninvasive outcomes. Therefore, we performed noninvasive imaging in adolescents and young adults to determine whether TOD could be documented in pre‐HTN patients before the onset of clinical HTN.
Methods
Study Population
These analyses were performed on data collected for a study that examined the effects of obesity and type 2 diabetes mellitus (T2DM) on CV structure and function. By design, one third of patients had T2DM (n=258), one third were obese (≥95th percentile for body mass index [BMI]) but nondiabetic (n=234), and one third were lean (n=231 <85th percentile for BMI). 14 First, patients with T2DM (provider‐diagnosed) were recruited from the Cincinnati Children’s Hospital diabetes clinic (average duration of diabetes 3.6±2.6 years). Each diabetic patient was then matched by age, race, and sex to two controls (1 lean and 1 obese). All obese patients underwent a 2‐hour oral glucose tolerance test to rule out subclinical T2DM according to American Diabetes Association guidelines. 15 Pregnant women were excluded from the study. The final study population consisted of 723 patients with a mean age of 18 years, 60% were non‐Caucasian, 34% were men, and 29% had T2DM.
Prior to enrollment in the study, written informed consent was obtained from patients 18 years and older or the parent or guardian for patients younger than 18 years. Written assent was also obtained for patients younger than 18 years according to the guidelines established by the institutional review board at Cincinnati Children’s Hospital.
Data Collection
After a minimum 10‐hour overnight fast, participants had questionnaire, anthropometric, BP, laboratory, and arterial stiffness data collected. Trained personnel obtained two measures of height using a calibrated stadiometer (Veeder‐Rood, Elizabethtown, NC). Each patient’s height was measured with the patient in the standing position wearing socks with heels together and toes apart at a 45° angle and the head in the Frankfort horizontal plane. Two height measurements were obtained with a third measurement taken if the first 2 were >0.5 cm apart. Weight was measured using a Health‐o‐meter electronic scale (Sunbeam Products, Inc, Boca Raton, FL). The scale was calibrated once per month and was used exclusively for this investigation. Two weight measurements were obtained. A third measurement was taken if the first two differed by >0.3 kg. BMI was calculated as kilograms per meters squared.
BPs were measured with mercury sphygmomanometery using a standardized protocol according to the standards of the Fourth Report on the Diagnosis, Evaluation, and Treatment of High Blood Pressure in Children and Adolescents. 13 BP examiners were certified after receiving 16 hours of instruction and evaluation. Examiners were recertified annually. Participants were seated with feet resting flat on a surface and right arm resting at heart level. The appropriate cuff was selected based on arm circumference and placed around the upper arm. Using a standard mercury sphygmomanometer (Baum Desktop Model with V‐Lok cuffs, New York, NY), 3 BPs were measured by rapidly inflating to the maximum inflation level and deflating at a rate of 2 mm Hg/s, with a 60‐second rest between each determination. The first appearance of two consecutive beats determined the first Korotkoff phase (K1), the point at which a sound became muffled determined K4, and the point in which the sound disappeared determined K5. The pulse rate was measured for 30 to 60 seconds between BP determinations. Three BP measurements were obtained. The 3 BP determinations were averaged to calculate the mean systolic and diastolic BPs (K5). If any 2 of the 3 readings varied by >10 mm Hg, a fourth reading was performed and included in the average.
The mean of 3 resting measures was used. Patients were stratified as having normotension (NT=531), pre‐hypertension (pre‐HTN=65), or hypertension (HTN = 127) by BP level according to the Fourth Report on the Diagnosis, Evaluation, and Treatment of High Blood Pressure in Children and Adolescents (based on sex, age, and height) 13 or the Seventh Report of the Joint National Committee on Prevention, Detection, Evaluation, and Treatment of High Blood Pressure (JNC 7) cutpoints 7 if they were 18 years or older.
Physical activity was assessed using an Actical accelerometer (Phillips Respironics, Andover, MA) worn on the waist during waking hours during a 7‐day period. This device is an omnidirectional detector that provides counts of movement in all directions. 16 Counts of activity per minute worn were calculated and averaged during the 7 days.
Fasting plasma glucose was measured using a Hitachi model 704 glucose analyzer (Roche Hitachi, Indianapolis, IL) with intra‐assay and interassay coefficients of variation of 1.2% and 1.6%, respectively. 17 Plasma insulin was measured by radioimmunoassay using an anti‐insulin serum raised in guinea pigs, 125I labeled insulin (Linco Research, St Louis, MO), and a double antibody method to separate bound from free tracer. This assay has a sensitivity of 2 pmol and intra‐assay and interassay coefficients of variation of 5% and 8%. 18 Assays of fasting plasma lipid profiles were carried out in a laboratory that was standardized by the National Heart, Lung, and Blood Institute and Centers for Disease Control and Prevention, with low‐density lipoprotein (LDL) cholesterol concentration calculated using the Friedewald equation. High sensitivity C‐reactive protein (CRP) was measured using a high‐sensitivity enzyme‐linked immunoabsorbent assay. Hemoglobin A1c (HbA1c) was measured in red blood cells using high‐performance liquid chromatography methods.
Echocardiography Technique
Echocardiography was performed with a GE or Philips Sonos 5500 (Andover, MA) system with the patient in the left decubitus position. Parasternal long‐axis, short‐axis, and apical 4‐chamber views were recorded, with 3 cardiac cycles averaged for each variable. Left ventricular end‐diastolic dimension, end‐systolic dimension, end‐diastolic septal thickness, and end‐diastolic and end‐systolic posterior wall thicknesses were measured offline by either of two sonographers using a Cardiology Analysis System (Digisonics, Houston, TX). Left ventricular mass (LVM) was calculated with the formula of Devereaux and colleagues 19 and LVM index (LVMI=LVM/height2.7) by De Simone’s method. 20 Relative wall thickness (RWT) at end‐diastole was also calculated. The cutpoints of 51 g/m2.7 and a RWT of 0.41 were used to define geometry as described previously. 11
For diastolic function, mitral inflow velocities were obtained with pulsed wave Doppler in the apical 4‐chamber view. The Doppler cursor was placed parallel to mitral inflow, and maximal velocity was measured with the sample volume at the mitral valve leaflet tips. The mitral peak E (early filling) and A (inflow with atrial contraction) waves were measured offline and an E/A ratio was calculated. Myocardial flow velocities by tissue Doppler imaging were acquired in the apical 4‐chamber view. The peak (Ea) and late velocities (Aa) of mitral annular flow were recorded at both the septal and lateral annulus and both lateral and septal Ea/Aa ratios and their average were calculated. Other diastolic variables that were calculated included E/Ea lateral and septal average and E over average of Ea/Aa ratio from the lateral and septal aspects of the valve.
Carotid Ultrasonography
Carotid ultrasonography studies were performed by a single registered vascular technologist with high‐resolution B‐mode ultrasonography (GE Vivid7, Milwaukee, WI) with a high‐resolution linear array vascular transducer (7.5 MHz). A 2‐dimensional image of the carotid artery was obtained from the far wall for measurement of intima‐medial thickness (IMT) in the common, bifurcation, and internal carotid segments. Then, images of the common carotid with both the near and far wall visualized were obtained for M‐mode evaluation of peak and minimal diameters for calculation of arterial stiffness. 21 All digital images were read offline using the Camtronic Medical System software (Hartland, WI). Calculations included Peterson’s elastic modulus (PEM) 22 and Young’s elastic modulus (YEM). 23 Due to pulse wave amplification along the arterial tree resulting in overestimation of brachial systolic BP, 24 central BPs obtained with the SphygmoCor device (see arterial stiffness below) were used in the calculations of carotid stiffness. The central BPs were obtained, on average, no more than 30 minutes prior to the carotid ultrasound.
Arterial Stiffness Measurements
The average of 3 measurements of all vascular function measures were used in the analyses. Each measure was conducted after 5 minutes of rest in the supine position. A DynaPulse Pathway instrument (Pulse Metric, Inc, San Diego, CA) collected brachial artery distensibility (BrachD) as described previously. 25 This device derives brachial artery pressure curves from arterial pressure signals obtained from a standard cuff sphygmomanometer assuming a straight tube brachial artery and T‐tube aortic system. 25 Repeat measures in our laboratory show excellent reproducibility with coefficients of variability <9%. 26
A SphygmoCor SCOR‐PVx System (Atcor Medical, Sydney, Australia) was used for measurement of carotid‐femoral pulse wave velocity (PWV) and augmentation index (AIx), an arterial stiffness measure incorporating features related to arterial stiffness and provides additional information concerning wave reflections. 27 This device employs a tonometer applied on the artery of interest to obtain electrocardiographic (ECG)‐gated pressure data. PWV is calculated as the difference in the carotid‐to‐femoral path length (measured directly and entered into the device) divided by the difference in the R wave from the ECG to the foot of the pressure wave taken from the superimposed ECG and pressure tracings. For AIx, the pressure waves are calibrated using mean arterial pressure (MAP) and diastolic BP obtained in the same arm. A validated generalized transfer function is then applied for estimation of the central aortic pressure tracing and calculation of AIx. 28 Since AIx is affected by heart rate (HR), values are adjusted to a HR of 75 beats per minute. Repeat measures in our laboratory show excellent reproducibility with coefficients of variability <7% for PWV and intraclass correlation coefficients between 0.7 and 0.9 for AIx variables. 26
Statistical Analysis
All analyses were performed with Statistical Analyses Software (SAS Institute Inc, version 9.2, Cary, NC). 29 Average values for demographic, anthropometric, and laboratory data were obtained by BP group. Analysis of variance was performed (or chi square analyses for categoric variables) to look for differences by BP group. Variance‐stabilizing measures to transform non‐normally distributed variables were performed as needed. Bivariate correlations were calculated between TOD measures and all covariates overall and by BP group. General linear models were constructed using important covariates from correlation analyses to determine whether BP group was an independent determinate of TOD even after inclusion of CV risk factors in the models.
The full model contained age, demographic (race, sex), anthropometric (waist/height ratio, BMI z score), hemodynamic (MAP to adjust for baseline distending pressure, HR except for the model for AIx, which is already adjusted for HR), laboratory (CRP and fasting LDL‐C, HDL‐C, triglycerides, glucose, insulin), T2DM, and physical activity (average activity counts per non‐zero minute) measures. Total cholesterol was highly collinear with LDL cholesterol and HbA1c with fasting glucose so these covariates were omitted to ensure stability of the models. Height was added to the model for AIx since height directly influences distance of wave reflection sites from the heart. Height is used in the calculations for BrachD and PWV so it was omitted from models for those outcomes. Significance of each covariate in the initial model was assessed and nonsignificant terms were removed by backward elimination until all remaining covariates or their interaction (effect modifier) terms were significant (P<.05).
The authors had full access to the data and take responsibility for their integrity. All authors have read and agree to the manuscript as written.
Results
Patient characteristics are displayed in Table I. NT participants were slightly younger than pre‐HTN and HTN patients. There were no differences in race but there were fewer men in the HTN group. The prevalence of T2DM and measures of adiposity and BP worsened from NT to pre‐HTN to HTN. NT patients tended to have a better lipid profile, metabolic control, and level of inflammation than the other groups. HTN had the lowest activity levels (all P≤.05 for comparisons listed above).
Table I.
Patient Characteristics by Blood Pressure Category
| Variable | NT (n=531) | Pre‐HTN (n=65) | HTN (n=127) | |||
|---|---|---|---|---|---|---|
| Mean | SD | Mean | SD | Mean | SD | |
| Age, ya | 17.4 | 3.1 | 19.3 | 3.5 | 20.0 | 3.1 |
| Race, % non‐Caucasian | 58.0 | 58.5 | 70.9 | |||
| Sex, % maleb | 37.9 | 37.7 | 23.6 | |||
| Presence of T2DM, %c | 21.9 | 40.0 | 55.9 | |||
| Height, cmd | 166.8 | 10.6 | 166.3 | 9.1 | 167.1 | 10.6 |
| Weight, kgd | 82.6 | 28.2 | 94.9 | 28.8 | 108.7 | 31.2 |
| Waist, cmd | 96.1 | 22.3 | 108.0 | 23.3 | 118.6 | 23.0 |
| Waist‐height ratiod | 0.58 | 0.13 | 0.65 | 0.14 | 0.71 | 0.13 |
| BMI, kg/m2d | 29.4 | 9.3 | 34.1 | 9.3 | 38.7 | 9.8 |
| SBP, mm Hgd | 111.3 | 9.9 | 119.3 | 10.6 | 128.8 | 13.1 |
| DBP, mm Hgd | 61.5 | 11.7 | 67.9 | 11.1 | 72.9 | 14.6 |
| MAP, mm Hgd | 80.8 | 7.8 | 85.9 | 8.2 | 91.0 | 10.9 |
| Heart rate, beats per mina | 66.1 | 10.6 | 70.1 | 10.0 | 71.5 | 11.9 |
| TC, mg/dLa | 168.1 | 33.8 | 181.9 | 30.8 | 175.8 | 36.4 |
| LDL‐C, mg/dLe | 98.4 | 28.8 | 109.2 | 28.4 | 103.6 | 29.7 |
| HDL‐C, mg/dLf | 51.1 | 12.7 | 51.7 | 15.8 | 45.1 | 11.2 |
| TG, mg/dLa | 90.2 | 55.5 | 115.5 | 77.9 | 132.6 | 98.3 |
| Glucose, mg/dLg | 103.6 | 46.5 | 112.7 | 50.9 | 129.3 | 70.0 |
| Insulin, μU/mLh | 17.1 | 13.1 | 19.9 | 13.1 | 23.6 | 20.9 |
| CRP, mg/La | 3.33 | 5.25 | 5.10 | 5.72 | 6.24 | 7.07 |
| CPM, counts/non 0 minf | 684 | 255 | 610 | 240 | 560 | 169 |
Abbreviations: BMI, body mass index; CPM, counts per minute; CRP, C‐reactive protein; DBP, diastolic blood pressure; HDL‐C, high‐density lipoprotein cholesterol; HTN, hypertension; LDL‐C, low‐density lipoprotein cholesterol; MAP, mean arterial pressure; NT, normotension; SBP, systolic blood pressure; SD, standard deviation; T2DM, type 2 diabetes mellitus; TC, total cholesterol; TG, triglycerides. P<.05 for aNT<pre‐HTN and HTN; bHTN<NT; cchi‐square P<.0001 for difference in prevalence of type 2 diabetes mellitus by blood pressure group; dNT<pre‐HTN<HTN; eNT<pre‐HTN; fHTN<NT and pre‐HTN; gNT and pre‐HTN<HTN; hNT<HTN.
LVMI increased across the BP groups (Table II and Figure 1). HTN patients demonstrated a higher prevalence of abnormal geometry, 23.6% (for all abnormal patterns combined) compared with 7.7% for NT and pre‐HTN (P≤.05). There were no group differences in systolic function (shortening fraction, velocity of circumferential fiber shortening, or wall stress [data not shown]). NT patients had better diastolic function than HTN patients for all measures. Values for NT patients were also better than those for pre‐HTN patients for mitral E/A ratio, TDI Ea/Aa septal ratio, average septal/lateral Ea/Aa ratios, and E/average Ea/Aa TDI lateral and septal ratios (all P≤.05).
Table II.
Cardiac Structure and Function by Blood Pressure Category
| Variable | Normal (n=531) | Pre‐HTN (n=65) | HTN (n=127) | |||
|---|---|---|---|---|---|---|
| Mean | SD | Mean | SD | Mean | SD | |
| LVMI, g/m2.7a | 32.8 | 8.9 | 35.9 | 9.8 | 40.7 | 11.2 |
| Relative wall thicknessb | 0.30 | 0.06 | 0.31 | 0.05 | 0.33 | 0.07 |
| Geometry, No. (%)c | ||||||
| Normal | 490 (92.3) | 60 (92.3) | 97 (76.4) | |||
| Concentric hypertrophy | 19 (3.4) | 2 (3.1) | 6 (4.7) | |||
| Eccentric hypertrophy | 18 (3.4) | 3 (4.6) | 17 (13.4) | |||
| Concentric remodeling | 4 (0.8) | 0 (0) | 7 (5.5) | |||
| Mitral Doppler E/A ratiod | 2.02 | 0.55 | 1.86 | 0.51 | 1.82 | 0.46 |
| Mitral Doppler E wave/TDI Ea lateral ratiob | 5.71 | 1.44 | 6.01 | 1.65 | 6.70 | 1.51 |
| Mitral Doppler E wave/TDI Ea septal ratioe | 7.33 | 1.68 | 7.84 | 2.04 | 8.30 | 1.61 |
| Mitral TDI lateral velocity Ea/Aa ratiof | 2.74 | 0.87 | 2.56 | 0.77 | 2.36 | 0.69 |
| Mitral TDI septal velocity Ea/Aa ratiod | 2.07 | 0.62 | 1.82 | 0.49 | 1.68 | 0.52 |
| Average Ea/Aa TDI lateral and septal ratiosg | 15.0 | 2.2 | 14.3 | 2.5 | 13.4 | 2.5 |
| Mitral Doppler E wave/average Ea/lateral and Ea/septal tissue Doppler lateral and septal ratiosh | 6.36 | 1.37 | 6.74 | 1.64 | 7.33 | 1.36 |
Abbreviations: HTN, hypertension; LVMI, left ventricular mass index; NT, normotension; SD, standard deviation; TDI, tissue Doppler imaging. P<.05 for aNT<pre‐HTN<HTN; bNT and pre‐HTN<HTN; cchi‐square P≤.0001 for difference in geometry by blood pressure group; dNT<pre‐HTN and HTN; eNT<HTN; fNT>HTN; gNT>pre‐HTN>HTN; hNT>pre‐HTN and HTN.
Figure 1.
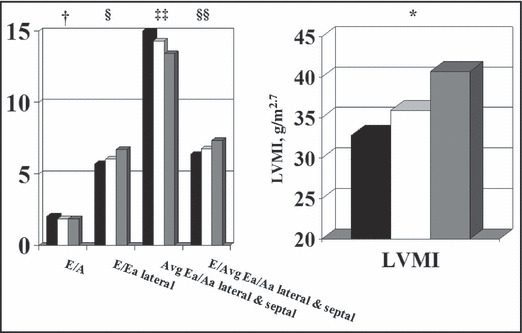
Cardiac structure and function by blood pressure group. LVMI indicates left ventricular mass index. P<.05 for *normotension (NT)<pre‐hypertension (pre‐HTN)<HTN; †NT<pre‐HTN and HTN; §NT and pre‐HTN<HTN; ‡‡NT>pre‐HTN; §§NT>pre‐HTN and HTN.
NT patients had significantly lower IMT than the other BP groups for the bulb and internal carotid artery segments and they had more flexible common carotid arteries as measured by PEM and YEM (Table III, Figure 2, and Figure 3, all P≤.05). There was a graded increase in AIx and femoral PWV with a similar decrease in BrachD among the BP groups (Table III), indicating progressively stiffer vessels across the BP strata.
Table III.
Arterial Structure and Function by Blood Pressure Category
| Variable | NT (n=531) | Pre‐HTN (n=65) | HTN (n=127) | |||
|---|---|---|---|---|---|---|
| Mean | SD | Mean | SD | Mean | SD | |
| Common cIMT, mma | 0.50 | 0.09 | 0.51 | 0.10 | 0.53 | 0.10 |
| Bulb cIMT, mmb | 0.49 | 0.10 | 0.50 | 0.13 | 0.54 | 0.10 |
| Internal cIMT, mmb | 0.40 | 0.09 | 0.44 | 0.10 | 0.44 | 0.10 |
| Peterson, mm Hgb | 184.4 | 55.3 | 202.3 | 57.8 | 221.8 | 81.5 |
| YEM, mm Hg/mmb | 268.5 | 128.2 | 304.9 | 115.5 | 308.5 | 132.7 |
| AIx, %c | 0.69 | 11.52 | 3.89 | 10.21 | 9.35 | 10.62 |
| BrachD, mm Hg, % changed | 6.16 | 1.31 | 5.75 | 1.21 | 5.32 | 1.11 |
| PWVf, m/sc | 5.75 | 0.92 | 6.38 | 1.06 | 7.12 | 1.25 |
Abbreviations: AIx, augmentation index; BrachD, brachial artery distensibility; cIMT, carotid intima‐media thickness; HTN, hypertension; NT, normotension; PWVf, femoral pulse wave velocity; SD, standard deviation; YEM, Young’s elastic modulus. P<.05 for aNT<HTN; bNT<pre‐HTN and HTN; cNT<pre‐HTN<HTN; dHTN<pre‐HTN<NT.
Figure 2.
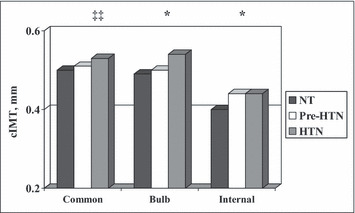
Carotid intima‐media thickness (cIMT) by blood pressure group. P<.05 for ‡‡normotension (NT)<hypertension (HTN); *NT<pre‐HTN and HTN.
Figure 3.
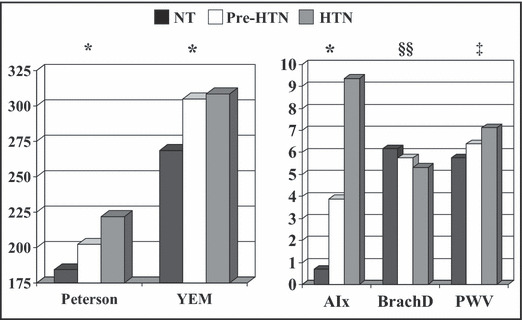
Arterial stiffness by blood pressure group. YEM indicates Young’s elastic modulus; AIx, augmentation index; BrachD, brachial artery distensibility; PWV, pulse wave velocity. P<.05 for mean differences by analysis of variance. *Normotension (NT)<pre‐hypertension (pre‐HTN) and HTN; ‡NT<pre‐HTN<HTN; §§HT<pre‐HTN<HTN.
Multivariable models demonstrated that BP group remained a significant predictor of LVMI, E/Ea lateral ratio and average septal/lateral Ea/As, and E/average Ea/Aa TDI lateral and septal ratios (Table IV). BP group was also an independent predictor of (Table V) vascular damage for the internal cIMT, common carotid stiffness (PEM, YEM), AIx, BrachD, and PWV even after adjusting for CV risk factors and distending pressure (MAP). Plotting the age by BP group interaction for BrachD revealed a steeper decline in BrachD across BP groups for adolescents than young adults (data not shown).
Table IV.
Multivariable Models Indicating Independent Determinants of Cardiac Structure and Function
| Variable | LVMI | RWT | E/A Ratio | E/Ea Lateral Ratio | E/Ea Septal Ratio | Ea/Aa Lateral Ratio | Ea/Aa Septal Ratio | Average Lateral and Septal Ea/Aa Ratios | E/Average Ea Lateral and Septal |
|---|---|---|---|---|---|---|---|---|---|
| Intercept | 3.21 | 0.20 | 5.49 | 4.34 | 6.65 | 10.68 | 7.51 | 35.49 | 5.86 |
| BP category | |||||||||
| NT | −0.06 | −0.45 | −0.46 | ||||||
| Pre‐HTN | −0.063 | −0.38 | −0.29 | ||||||
| HTNa | 0 | 0 | 0 | ||||||
| Age | 0.0047 | −0.026 | −0.044 | ||||||
| Female | −0.1 | −0.010 | |||||||
| Non‐white race | −0.58 | 0.27 | |||||||
| T2DM | −0.16 | 0.44 | 0.64 | −0.68 | 0.52 | ||||
| BMI z score | 0.075 | 0.13 | 0.50 | −1.61 | −0.11 | 0.37 | |||
| Waist/height ratio | 0.88 | 0.12 | −1.08 | 2.95 | −1.81 | ||||
| MAP | −0.54 | −1.25 | −0.81 | −4.27 | |||||
| Heart rate | −0.0033 | −0.010 | −0.017 | −0.011 | |||||
| LDL‐C | −0.008 | ||||||||
| HDL‐C | 0.016 | ||||||||
| TG | 0.010 | ||||||||
| Fasting glucose | |||||||||
| Fasting insulin | −0.108 | ||||||||
| CRP | 0.08 | ||||||||
| R 2 | 0.52 | 0.1 | 0.12 | 0.16 | 0.17 | 0.19 | 0.3 | 0.2 | 0.21 |
Abbreviations: BMI, body mass index; BP, blood pressure; CRP, C‐reactive protein; HDL‐C, high‐density lipoprotein cholesterol; HTN, hypertension; LDL‐C, low‐density lipoprotein cholesterol; LVMI, left ventricular mass index; MAP, mean arterial pressure; NT, normotension; RWT, relative wall thickness; T2DM, type 2 diabetes mellitus; TG, triglycerides. a0 indicates HTN group treated as reference group. All models have P<.0001 except Ea/Aa septal P<.007, and all parameter estimates listed have P<.05.
Table V.
Multivariable Models Indicating Independent Determinants of Arterial Structure and Function
| Variable | Common | Bulb | Internal | PEM | YEM | AIx | BrachD | PWV |
|---|---|---|---|---|---|---|---|---|
| (Higher=Stiffer) | (Lower=Stiffer) | (Higher=Stiffer) | ||||||
| Intercept | −0.84 | −2.05 | −1.39 | 4.83 | 4.60 | −31.29 | 1.89 | −0.77 |
| BP category | ||||||||
| NT | −0.045 | −0.086 | −0.12 | −3.61 | 0.29 | −0.061 | ||
| Pre‐HTN | 0.022 | −0.046 | −0.014 | −3.76 | −0.03 | −0.036 | ||
| HTNa | 0 | 0 | 0 | 0 | 0 | 0 | ||
| Age * BP category | ||||||||
| NT | −0.013 | |||||||
| Pre‐HTN | 0.003 | |||||||
| HTNa | ||||||||
| Age | 0.011 | 0.0093 | 0.016 | 0.022 | 0.0064 | 0.014 | ||
| Female | −0.097 | −0.051 | −0.12 | −0.087 | 0.015 | |||
| Non‐white race | 0.059 | 0.052 | −0.12 | 0.070 | ||||
| T2DM | 0.066 | 0.055 | ||||||
| Height | −0.32 | |||||||
| BMI z score | 0.020 | 0.036 | −0.088 | |||||
| Waist/height ratio | 1.10 | 0.50 | ||||||
| MAP | 0.29 | 0.43 | 27.89 | −0.0025 | 0.37 | |||
| Heart rate | −0.0020 | |||||||
| LDL‐C | 0.00065 | 0.001 | ||||||
| TG | 1.97 | |||||||
| Fasting glucose | 0.055 | −0.25 | 0.065 | |||||
| Fasting Insulin | 0.051 | −0.091 | −0.0025 | |||||
| Counts/non 0 min | −6.42 | |||||||
| R 2 | 0.16 | 0.11 | 0.20 | 0.16 | 0.17 | 0.25 | 0.43 | 0.60 |
Abbreviations: AIx, augmentation index; BMI, body mass index; BP, blood pressure; BrachD, brachial artery distensibility; HTN, hypertension; LDL‐C, low‐density lipoprotein cholesterol; MAP, mean arterial pressure; NT, normotension; PEM, Peterson’s elastic modulus; T2DM, type 2 diabetes mellitus; TG, triglycerides; YEM, Young’s elastic modulus. a0 indicates HTN group treated as reference group. All Models have P<.0001.
Discussion
Our data demonstrate that significant abnormalities in cardiac and vascular measures can be identified in youth with pre‐HTN (increased LVM, carotid thickness, arterial stiffness, and decreased diastolic function). Although a deteriorating risk factor profile was seen across the BP distribution, the adverse cardiac and vascular changes are largely independent of other traditional CV risk factors. This is evident from the observation that classification as pre‐HTN was an independent predictor of many measures of TOD (LVMI, E/Ea, average lateral‐septal Ea/Aa, internal cIMT, PEM, YEM, AIx, BrachD, PWV) even after adjusting for CV risk factors including BMI and presence of T2DM. This suggests that even mild elevation in BP is an important etiology for TOD.
In hypertensive adults, elevated LVM is a well‐described independent risk factor for adverse CV events 30 and is associated with development of depressed left ventricular (LV) systolic function, a precursor of heart failure. 31 Concentric hypertrophy, the geometric pattern most frequently seen in sustained HTN, is also associated with a poor prognosis. 32 However, cardiac abnormalities can be found in pre‐hypertensive adults. Recent studies found depressed diastolic function in pre‐hypertensives 33 , 34 and two large studies found higher LVM in these patients even after adjustment for other CV risk factors. 35 , 36 Pre‐HTN may also lead to more age‐related increases in LVM. 10 Furthermore, progression from pre‐HTN to sustained HTN in the Strong Heart Study was predicted by both baseline systolic BP and also by baseline LVM, 37 with the probability of developing incident HTN increasing 36% for each standard deviation (SD) of LVMI. 38 The finding that development of mild LV thickening may accelerate progression to higher BP levels suggests that pre‐HTN is not a benign condition.
LVH can also be identified in youth with HTN. 39 , 40 Using the adult cutpoint of 51 g/m2.7, Daniels and colleagues found the prevalence for HTN‐related LVH to be 8% in a clinic population, 11 while a multicenter study found the prevalence to be as high as 15.5%. 41 If the pediatric definition of ≥95th percentile of LVM is used, the prevalence may be as high as 30% to 40%. 41 , 42 , 43 Important epidemiologic studies of CV risk factors in youth also confirm a strong association between BP levels and LV thickness in non‐hypertensive patients. The Muscatine Heart Study demonstrated that resting systolic BP exerted an independent influence on LVM in children, 44 while the Bogalusa Heart Study found that the cumulative burden of systolic BP from childhood to adulthood was a significant predictor of LVMI in young adults. 45 Other cross‐sectional studies of healthy children confirm the independent relationship between BP and LVM. 46 , 47 Therefore, it is not surprising that youth diagnosed with pre‐HTN may also exhibit LVH, 12 , 48 with odds for having elevated LVMI increasing by 54% for each incremental increase in the SD score for 24‐hour ambulatory systolic BP. 49 Higher ambulatory BP is also significantly associated with a higher prevalence of abnormal LV geometry in children and adolescents, 50 and BP also relates to left atrial diameter 51 and decreased diastolic function in youth. 52 , 53 Our data confirm the adverse effect of pre‐hypertensive BP levels on LV structure and function in a larger cohort of adolescents and young adults.
As with LVM, carotid structure is also adversely affected by HTN. Among all the metabolic syndrome components, HTN carried the greatest odds ratio (1.43; confidence interval, 1.27–1.60) for presence of carotid plaque, a risk factor for stroke, in a large study of Japanese patients aged 19 to 88 years. 54 However, HTN is also linked to early carotid changes. cIMT increased across BP categories in all race and sex groups in the Atherosclerosis Risk in Communities (ARIC) study, 55 a finding replicated in other large population‐based studies. 56 , 57 Presence of HTN also predicts progression of cIMT, 58 , 59 so it is not surprising that greater carotid thickness can be found in adults with pre‐HTN 35 , 60 and normal adults with multiple CV risk factors, 61 with a 0.058‐mm increase in cIMT seen per 1‐SD (21‐mm Hg) increase in BP in a multi‐ethnic study by Psaty and colleagues. 62
The adverse changes in carotid structure seen in hypertensive adults are accompanied by parallel deterioration in carotid function. The ARIC study found that increased carotid stiffness predicted development of HTN 3 and that HTN was associated with increased carotid stiffness. 63 However, as in earlier studies, 64 the increase in stiffness was dependent on baseline distending pressure. In contrast, other investigators have found the hypertensive‐related increase in carotid stiffness to be independent of baseline pressure but only in younger hypertensives. 65 HTN may have a stronger effect on arterial stiffness in younger individuals, while age and other CV risk factors may be more important at older ages. Data demonstrating that pre‐hypertensive men, if young, have lower carotid distensibility than controls 66 support this hypothesis. It is possible that other age‐related risk factors have a more powerful effect on carotid stiffness than BP at older ages.
Recent studies have demonstrated a relationship between BP and carotid structure and function in youth. Children referred to an HTN clinic were found to have thicker common carotid artery cIMT compared with controls. In two studies, the relationship was not independent of BMI. 67 , 68 However, other investigators have found the relationship between BP and cIMT to be significant even when adolescents are matched by BMI 69 or when statistical adjustment for adiposity is performed. 70 In a large recent study from our group, we found that the obesity‐independent relationship between BP and cIMT also existed for the carotid bulb and internal carotid artery segments. 71 A few studies have related increased carotid stiffness to HTN in youth. 72 However, one investigator found the relationship only when lean controls, rather than obese controls, were compared with the hypertensive youth. 68 Two other studies found the relationship to be obesity‐independent. 71 , 73 Our current paper extends these observations by providing data on all 3 carotid artery segments and examining the effect of both HTN and pre‐HTN on carotid artery thickness and stiffness.
The majority of studies relating BP to arterial stiffness measure PWV. PWV is a robust measure that not only predicts CV events, 74 , 75 but also CV mortality. 76 Indeed, increased arterial stiffness, including faster PWV, 77 has been found with greater CV risk such as in HTN. There are also some limited data relating HTN in adults to higher AIx 78 , 79 and lower BrachD values. 80 Unfortunately, treatment of HTN in adulthood may not normalize PWV, 81 and annual rates of progression of PWV are higher in hypertensives compared with controls even if BP is well‐controlled. 82 Underlying abnormalities in arterial stiffness may be contributing to development of HTN, 83 which then causes further deterioration in arterial elasticity. Higher PWV 84 and AIx 85 values have also been documented in pre‐hypertensive adults. PWV gradually increased as a function of BP classification from normal HTN to pre‐HTN to stage II HTN in one study. 86 Furthermore, studies of normotensive young adults with a positive family history of HTN have demonstrated lower BrachD 80 and higher PWV 87 , 88 and AIx 89 values, suggesting an underlying genetic tendency for vascular dysfunction that may impact risk for developing HTN. Therefore, to prevent development of sustained HTN, it may be useful to assess arterial stiffness in high‐risk individuals.
Arterial stiffness assessment is being performed in increasing numbers of pediatric studies. As in adults, most pediatric studies focus on PWV although normative data remain sparse. A recent study by Reusz and colleagues provided PWV results on 1008 healthy patients (6–20 years) obtained with a similar method as employed in our study. 90 They found a strong correlation between BP and PWV, although no multivariable analyses correcting for other CV risk factors were performed. 90 Our previous data on 670 adolescents and young adults demonstrated that mean arterial pressure remained a predictor of PWV (and AIx and BrachD) even after correcting for adiposity, metabolic abnormalities (glucose, insulin, type 1 91 or type 2 26 diabetes), and inflammation. A few studies have specifically evaluated the relationship between BP classification and PWV including one that found higher PWV in pre‐hypertensive adolescents compared with controls, but only in Caucasians. 92 Our data found higher PWV in pre‐hypertensive non‐Caucasians; however, we measured the standard carotid‐femoral PWV. In the Zhu and colleagues paper, 92 carotid to dorsalis pedis was measured, and it is known that PWV is higher in smaller leg vessels compared with the central aorta. 26 A study examining younger children, mean age of 11.4 years, demonstrated higher PWV in patients with systolic BP ≥90th percentile, the cutpoint for pre‐HTN, compared with normotensives. 93 However, the investigators did not determine whether differences existed between pre‐HTN and true HTN. Our findings confirm the graded increase in PWV from normo‐HTN to pre‐HTN to HTN in youth. We also provide BP level–stratified data for AIx and BrachD, techniques previously employed to investigate other CV risk factors in youth such as diabetes 94 and metabolic syndrome, 95 but not used for pediatric HTN research to date.
Limitations
Our finding of a graded increase in the prevalence of TOD across the BP strata, although cross‐sectional, suggests that progression to higher levels of BP increases CV risk at a young age. However, our cross‐sectional findings need to be confirmed in longitudinal studies. Furthermore, due to our study design, our population had a high prevalence of obesity and T2DM. However, BP classification remained an independent predictor of all the TOD measures even in multivariable models where BMI and presence of diabetes were entered as covariates. Furthermore, the prevalence of both obesity and T2DM are increasing around the globe. Therefore, our data point to the importance of modifying CV risk factors in high‐risk youth even if only at borderline levels.
Some studies have suggested that the relationship between BP and arterial stiffness merely reflects the effect of increased distending pressure on the vessel. 63 Investigations of brachial arterial compliance under isobaric conditions demonstrating impaired vascular function in hypertensives refute this assertion. 96 , 97 Furthermore, our model controlled for MAP and still found an effect of BP group on BrachD, suggesting that the effect was independent of baseline pressure.
There is much controversy on the appropriate method to index LVM to correct for differences in body size. Some studies have shown that fat‐free body mass is more closely related to LVM than other anthropometric measures. 46 , 98 , 99 We chose to index LVM to height2.7 because measurement of fat‐free mass requires specialized equipment not readily available to many physicians and because the de Simone method of indexing LVM 20 has produced a sex‐independent partition value of 51 g/m2.7 that has proven better at predicting incident CV events 4 , 99 compared with other allometric adjustments, including indexing to height1.7 suggested by 4 , 100 Chirinos and colleagues, 101 which was only superior in predicting all‐cause mortality.
Conclusions
Our data provide additional support for the argument that BP has an important effect on the CV system in adolescents and young adults even with only modest elevation in BP (>90th percentile). This supports the concept that pediatricians should be prospectively identifying children and adolescents with BP >90th percentile and should begin lifestyle intervention earlier to prevent cardiac and vascular consequences. This also suggests that it may be necessary to consider implementation of pharmacologic intervention earlier and at a lower BP to prevent progression to sustained HTN as documented in the adult Trial of Preventing Hypertension (TROPHY) study. 102 This is especially important as these target organ changes may well be part of a vicious cycle that leads to further increases in BP and greater target organ disease. Longitudinal trials addressing the issue of earlier treatment based on intermediate noninvasive CV end points rather than using arbitrary cutpoints are needed.
Acknowledgments and disclosures: We would like to acknowledge the work of the entire Cardiovascular Disease in Type 2 Diabetes Study team. We would also like to thank the participants of the Cardiovascular Disease in Type 2 Diabetes Study and their families, without whose support this study would not be possible. The authors have no other conflicts of interest or relationships with industry to disclose. This study was supported by NIH (NHLBI) R01 HL076269 (CV Disease in Adolescents With Type 2 Diabetes) and in part by USPHS Grant no. UL1 RR026314 (National Center for Research Resources, NIH).
References
- 1. Levy D, Anderson KM, Savage DD, et al. Echocardiographically detected left ventricular hypertrophy: prevalence and risk factors. The Framingham Heart Study. Ann Intern Med. 1988;108:7–13. [DOI] [PubMed] [Google Scholar]
- 2. Roman MJ, Saba PS, Pini R, et al. Parallel cardiac and vascular adaptation in hypertension. Circulation. 1992;86:1909–1918. [DOI] [PubMed] [Google Scholar]
- 3. Liao D, Arnett DK, Tyroler HA, et al. Arterial stiffness and the development of hypertension. The ARIC study. Hypertension. 1999;34:201–206. [DOI] [PubMed] [Google Scholar]
- 4. de Simone G, Devereux RB, Daniels SR, et al. Effect of growth on variability of left ventricular mass: assessment of allometric signals in adults and children and their capacity to predict cardiovascular risk. J Am Coll Cardiol. 1995;25:1056–1062. [DOI] [PubMed] [Google Scholar]
- 5. Hodis HN, Mack WJ, LaBree L, et al. The role of carotid arterial intima‐media thickness in predicting clinical coronary events. Ann Intern Med. 1998;128:262–269. [DOI] [PubMed] [Google Scholar]
- 6. Vlachopoulos C, Aznaouridis K, O’Rourke MF, et al. Prediction of cardiovascular events and all‐cause mortality with central haemodynamics: a systematic review and meta‐analysis. Eur Heart J. 2010;31:1865–1871. [DOI] [PubMed] [Google Scholar]
- 7. Chobanian AV, Bakris GL, Black HR, et al. The Seventh Report of the Joint National Committee on prevention, detection, evaluation, and treatment of high blood pressure: the JNC 7 report. JAMA. 2003;289:2560–2572. [DOI] [PubMed] [Google Scholar]
- 8. Rosendorff C, Black HR, Cannon CP, et al. Treatment of hypertension in the prevention and management of ischemic heart disease: a scientific statement from the American Heart Association Council for High Blood Pressure Research and the Councils on Clinical Cardiology and Epidemiology and Prevention. Circulation. 2007;115:2761–2788. [DOI] [PubMed] [Google Scholar]
- 9. Parikh NI, Pencina MJ, Wang TJ, et al. A risk score for predicting near‐term incidence of hypertension: the Framingham Heart Study. Ann Intern Med. 2008;148:102–110. [DOI] [PubMed] [Google Scholar]
- 10. Markus MR, Stritzke J, Lieb W, et al. Implications of persistent prehypertension for ageing‐related changes in left ventricular geometry and function: the MONICA/KORA Augsburg study. J Hypertens. 2008;26:2040–2049. [DOI] [PubMed] [Google Scholar]
- 11. Daniels SR, Loggie JM, Khoury P, et al. Left ventricular geometry and severe left ventricular hypertrophy in children and adolescents with essential hypertension. Circulation. 1998;97:1907–1911. [DOI] [PubMed] [Google Scholar]
- 12. Stabouli S, Kotsis V, Rizos Z, et al. Left ventricular mass in normotensive, prehypertensive and hypertensive children and adolescents. Pediatr Nephrol. 2009;24:1545–1551. [DOI] [PubMed] [Google Scholar]
- 13. National High Blood Pressure Education Program Working Group on High Blood Pressure in Children and Adolescents . The fourth report on the diagnosis, evaluation, and treatment of high blood pressure in children and adolescents. Pediatrics. 2004;114:555–576. [PubMed] [Google Scholar]
- 14. Centers for Disease Control and Prevention. http://www.cdc.gov/. Accessed May 22, 2008.
- 15. ADA . Type 2 diabetes in children and adolescents. American Diabetes Association. Diabetes Care. 2000;23:381–389. [DOI] [PubMed] [Google Scholar]
- 16. Heil DP. Predicting Activity Energy Expenditure Using the Actical® Activity Monitor. Res Q Exerc Sport. 2006;77:64–80. [DOI] [PubMed] [Google Scholar]
- 17. Goodman E, Daniels SR, Morrison JA, et al. Contrasting prevalence of and demographic disparities in the World Health Organization and National Cholesterol Education Program Adult Treatment Panel III definitions of metabolic syndrome among adolescents. J Pediatr. 2004;145:445–451. [DOI] [PubMed] [Google Scholar]
- 18. Martin LJ, Woo JG, Daniels SR, et al. The relationships of adiponectin with insulin and lipids are strengthened with increasing adiposity. J Clin Endocrinol Metab. 2005;90:4255–4259. [DOI] [PMC free article] [PubMed] [Google Scholar]
- 19. Devereux RB, Alonso DR, Lutas EM, et al. Echocardiographic assessment of left ventricular hypertrophy: comparison to necropsy findings. Am J Cardiol. 1986;57:450–458. [DOI] [PubMed] [Google Scholar]
- 20. de Simone G, Daniels SR, Devereux RB, et al. Left ventricular mass and body size in normotensive children and adults: assessment of allometric relations and impact of overweight. J Am Coll Cardiol. 1992;20:1251–1260. [DOI] [PubMed] [Google Scholar]
- 21. Roman MJ, Pickering TG, Schwartz JE, et al. Association of carotid atherosclerosis and left ventricular hypertrophy. JACC. 1995;25:83–90. [DOI] [PubMed] [Google Scholar]
- 22. Roman MJ, Ganau A, Saba PS, et al. Impact of arterial stiffening on left ventricular structure. Hypertension. 2000;36:489–494. [DOI] [PubMed] [Google Scholar]
- 23. Cavallini MC, Roman MJ, Blank SG, et al. Association of the auscultatory gap with vascular disease in hypertensive patients. Ann Intern Med. 1996;124:877–883. [DOI] [PubMed] [Google Scholar]
- 24. Mahmud A, Feely J. Spurious systolic hypertension of youth: fit young men with elastic arteries. Am J Hypertens. 2003;16:229–232. [DOI] [PubMed] [Google Scholar]
- 25. Urbina EM, Brinton TJ, Elkasabany A, et al. Brachial artery distensibility and relation to cardiovascular risk factors in healthy young adults (The Bogalusa Heart Study). Am J Cardiol. 2002;89:946–951. [DOI] [PubMed] [Google Scholar]
- 26. Urbina EM, Kimball TR, Khoury PR, et al. Increased arterial stiffness is found in adolescents with obesity or obesity‐related type 2 diabetes mellitus. J Hypertens. 2010;28:1692–1698. [DOI] [PMC free article] [PubMed] [Google Scholar]
- 27. Laurent S, Cockcroft J, Van Bortel L, et al. Expert consensus document on arterial stiffness: methodological issues and clinical applications. Eur Heart J. 2006;27:2588–2605. [DOI] [PubMed] [Google Scholar]
- 28. O’Rourke MG, Gallagher DE. Pulse wave analysis. J Hypertens Suppl. 1996;14:S147–S157. [PubMed] [Google Scholar]
- 29. Institute S. SAS OnlineDoc, Version 9.1.3. Cary, NC: SAS Institute; 2002. [Google Scholar]
- 30. Verdecchia P, Carini G, Circo A, et al. Left ventricular mass and cardiovascular morbidity in essential hypertension: the MAVI study. J Am Coll Cardiol. 2001;38:1829–1835. [DOI] [PubMed] [Google Scholar]
- 31. Drazner MH, Rame JE, Marino EK, et al. Increased left ventricular mass is a risk factor for the development of a depressed left ventricular ejection fraction within five years: the Cardiovascular Health Study. J Am Coll Cardiol. 2004;43:2207–2215. [DOI] [PubMed] [Google Scholar]
- 32. Krumholz HM, Larson M, Levy D. Prognosis of left ventricular geometric patterns in the Framingham Heart Study. J Am Coll Cardiol. 1995;25:879–884. [DOI] [PubMed] [Google Scholar]
- 33. Martini G, Rabbia F, Gastaldi L, et al. Heart rate variability and left ventricular diastolic function in patients with borderline hypertension with and without left ventricular hypertrophy. Clin Exp Hypertens. 2001;23:77–87. [DOI] [PubMed] [Google Scholar]
- 34. Norton GR, Maseko M, Libhaber E, et al. Is prehypertension an independent predictor of target organ changes in young‐to‐middle‐aged persons of African descent? J Hypertens. 2008;26:2279–2287. [DOI] [PubMed] [Google Scholar]
- 35. Manios E, Tsivgoulis G, Koroboki E, et al. Impact of prehypertension on common carotid artery intima‐media thickness and left ventricular mass. Stroke. 2009;40:1515–1518. [DOI] [PubMed] [Google Scholar]
- 36. Drukteinis JS, Roman MJ, Fabsitz RR, et al. Cardiac and systemic hemodynamic characteristics of hypertension and prehypertension in adolescents and young adults: the Strong Heart Study. Circulation. 2007;115:221–227. [DOI] [PubMed] [Google Scholar]
- 37. De Marco M, de Simone G, Roman MJ, et al. Cardiovascular and metabolic predictors of progression of prehypertension into hypertension: the Strong Heart Study. Hypertension. 2009;54:974–980. [DOI] [PMC free article] [PubMed] [Google Scholar]
- 38. de Simone G, Devereux RB, Chinali M, et al. Left ventricular mass and incident hypertension in individuals with initial optimal blood pressure: the Strong Heart Study. J Hypertens. 2008;26:1868–1874. [DOI] [PMC free article] [PubMed] [Google Scholar]
- 39. Flynn JT, Alderman MH. Characteristics of children with primary hypertension seen at a referral center. Pediatr Nephrol. 2005;20:961–966. [DOI] [PubMed] [Google Scholar]
- 40. Pall D, Settakis G, Katona E, et al. Angiotensin‐converting enzyme gene polymorphism, carotid intima‐media thickness, and left ventricular mass index in adolescent hypertension. J Clin Ultrasound. 2004;32:129–135. [DOI] [PubMed] [Google Scholar]
- 41. Hanevold C, Waller J, Daniels S, et al. The effects of obesity, gender, and ethnic group on left ventricular hypertrophy and geometry in hypertensive children: a collaborative study of the International Pediatric Hypertension Association. Pediatrics. 2004;113:328–333. [DOI] [PubMed] [Google Scholar]
- 42. McNiece KL, Gupta‐Malhotra M, Samuels J, et al. Left ventricular hypertrophy in hypertensive adolescents: analysis of risk by 2004 National High Blood Pressure Education Program Working Group staging criteria. Hypertension. 2007;50:392–395. [DOI] [PMC free article] [PubMed] [Google Scholar]
- 43. Sorof JM, Alexandrov AV, Cardwell G, et al. Carotid artery intimal‐medial thickness and left ventricular hypertrophy in children with elevated blood pressure. Pediatrics. 2003;111:61–66. [DOI] [PubMed] [Google Scholar]
- 44. Malcolm DD, Burns TL, Mahoney LT, et al. Factors affecting left ventricular mass in childhood: the Muscatine Study. Pediatrics. 1993;92:703–709. [PubMed] [Google Scholar]
- 45. Li X, Li S, Ulusoy E, et al. Childhood adiposity as a predictor of cardiac mass in adulthood: the Bogalusa Heart Study. Circulation. 2004;110:3488–3492. [DOI] [PubMed] [Google Scholar]
- 46. Daniels SR, Kimball TR, Morrison JA, et al. Effect of lean body mass, fat mass, blood pressure, and sexual maturation on left ventricular mass in children and adolescents. Statistical, biological, and clinical significance. Circulation. 1995;92:3249–3254. [DOI] [PubMed] [Google Scholar]
- 47. de Simone G, Mureddu GF, Greco R, et al. Relations of left ventricular geometry and function to body composition in children with high casual blood pressure. Hypertension. 1997;30:377–382. [DOI] [PubMed] [Google Scholar]
- 48. Cadnapaphornchai MA, McFann K, Strain JD, et al. Increased left ventricular mass in children with autosomal dominant polycystic kidney disease and borderline hypertension. Kidney Int. 2008;74:1192–1196. [DOI] [PMC free article] [PubMed] [Google Scholar]
- 49. Richey PA, Disessa TG, Hastings MC, et al. Ambulatory blood pressure and increased left ventricular mass in children at risk for hypertension. J Pediatr. 2008;152:343–348. [DOI] [PMC free article] [PubMed] [Google Scholar]
- 50. Richey PA, Disessa TG, Somes GW, et al. Left ventricular geometry in children and adolescents with primary hypertension. Am J Hypertens. 2009;23:24–29. [DOI] [PMC free article] [PubMed] [Google Scholar]
- 51. Daniels SR, Witt SA, Glascock B, et al. Left atrial size in children with hypertension: the influence of obesity, blood pressure, and left ventricular mass. J Pediatr. 2002;141:186–190. [DOI] [PubMed] [Google Scholar]
- 52. Chinali M, de Simone G, Roman MJ, et al. Cardiac markers of pre‐clinical disease in adolescents with the metabolic syndrome: the Strong Heart Study. J Am Coll Cardiol. 2008;52:932–938. [DOI] [PMC free article] [PubMed] [Google Scholar]
- 53. Shah AS, Khoury PR, Dolan LM, et al. The effects of obesity and type 2 diabetes mellitus on cardiac structure and function in adolescents and young adults. Diabetologia. 2011;54:722–730. [DOI] [PMC free article] [PubMed] [Google Scholar]
- 54. Ishizaka N, Ishizaka Y, Toda E‐I, et al. Hypertension is the most common component of metabolic syndrome and the greatest contributor to carotid arteriosclerosis in apparently healthy Japanese individuals. Hypertens Res. 2005;28:27–34. [DOI] [PubMed] [Google Scholar]
- 55. Arnett DK, Tyroler HA, Burke G, et al. Hypertension and subclinical carotid artery atherosclerosis in blacks and whites. The Atherosclerosis Risk in Communities Study. ARIC Investigators. Arch Intern Med. 1996;156:1983–1989. [PubMed] [Google Scholar]
- 56. Cuspidi C, Mancia G, Ambrosioni E, et al. Left ventricular and carotid structure in untreated, uncomplicated essential hypertension: results from the Assessment Prognostic Risk Observational Survey (APROS). J Hum Hypertens. 2004;18:891–896. [DOI] [PubMed] [Google Scholar]
- 57. Zanchetti A, Bond MG, Hennig M, et al. Risk factors associated with alterations in carotid intima‐media thickness in hypertension: baseline data from the European Lacidipine Study on Atherosclerosis. J Hypertens. 1998;16:949–961. [DOI] [PubMed] [Google Scholar]
- 58. Puato M, Palatini P, Zanardo M, et al. Increase in carotid intima‐media thickness in grade I hypertensive subjects: white‐coat versus sustained hypertension. [see comment]. Hypertension. 2008;51:1300–1305. [DOI] [PubMed] [Google Scholar]
- 59. Femia R, Kozakova M, Nannipieri M, et al. Carotid intima‐media thickness in confirmed prehypertensive subjects: predictors and progression. Arterioscler Thromb Vasc Biol. 2007;27:2244–2249. [DOI] [PubMed] [Google Scholar]
- 60. Toprak A, Wang H, Chen W, et al. Prehypertension and black‐white contrasts in cardiovascular risk in young adults: bogalusa Heart Study. J Hypertens. 2009;27:243–250. [DOI] [PubMed] [Google Scholar]
- 61. Urbina EM, Srinivasan SR, Tang R, et al. Impact of multiple coronary risk factors on the intima‐media thickness of different segments of carotid artery in healthy young adults (The Bogalusa Heart Study). Am J Cardiol. 2002;90:953–958. [DOI] [PubMed] [Google Scholar]
- 62. Psaty BM, Arnold AM, Olson J, et al. Association between levels of blood pressure and measures of subclinical disease multi‐ethnic study of atherosclerosis. Am J Hypertens. 2006;19:1110–1117. [DOI] [PubMed] [Google Scholar]
- 63. Arnett DK, Boland LL, Evans GW, et al. Hypertension and arterial stiffness: the Atherosclerosis Risk in Communities Study. ARIC Investigators. Am J Hypertens. 2000;13:317–323. [DOI] [PubMed] [Google Scholar]
- 64. Roman MJ, Pini R, Pickering TG, et al. Non‐invasive measurements of arterial compliance in hypertensive compared with normotensive adults. J Hypertens Suppl. 1992;10:S115–S118. [PubMed] [Google Scholar]
- 65. Bussy C, Boutouyrie P, Lacolley P, et al. Intrinsic stiffness of the carotid arterial wall material in essential hypertensives. Hypertension. 2000;35:1049–1054. [DOI] [PubMed] [Google Scholar]
- 66. Toikka JO, Niemi P, Ahotupa M, et al. Decreased large artery distensibility in borderline hypertension is related to increased in vivo low‐density lipoprotein oxidation. Scand J Clin Lab Invest. 2002;62:301–306. [DOI] [PubMed] [Google Scholar]
- 67. Pall D, Settakis G, Katona E, et al. Increased common carotid artery intima media thickness in adolescent hypertension: results from the Debrecen Hypertension study. Cerebrovasc Dis. 2003; 15:167–172. [DOI] [PubMed] [Google Scholar]
- 68. Litwin M, Trelewicz J, Wawer Z, et al. Intima‐media thickness and arterial elasticity in hypertensive children: controlled study. Pediatr Nephrol. 2004;19:767–774. [DOI] [PubMed] [Google Scholar]
- 69. Lande MB, Carson NL, Roy J, et al. Effects of childhood primary hypertension on carotid intima media thickness: a matched controlled study. Hypertension. 2006;48:40–44. [DOI] [PubMed] [Google Scholar]
- 70. Sorof JM, Alexandrov AV, Garami Z, et al. Carotid ultrasonography for detection of vascular abnormalities in hypertensive children. Pediatr Nephrol. 2003;18:1020–1024. [DOI] [PubMed] [Google Scholar]
- 71. Urbina EM, Kimball TR, McCoy CE, et al. Youth with obesity and obesity‐related type 2 diabetes mellitus demonstrate abnormalities in carotid structure and function. Circulation. 2009;119:2913–2919. [DOI] [PMC free article] [PubMed] [Google Scholar]
- 72. Gil TY, Sung CY, Shim SS, et al. Intima‐media thickness and pulse wave velocity in hypertensive adolescents. J Korean Med Sci. 2008;23:35–40. [DOI] [PMC free article] [PubMed] [Google Scholar]
- 73. Meaney E, Samaniego V, Alva F, et al. Increased arterial stiffness in children with a parental history of hypertension. Pediatr Cardiol. 1999;20:203–205. [DOI] [PubMed] [Google Scholar]
- 74. Blacher J, Asmar R, Diane S, et al. Aortic pulse wave velocity as a marker of cardiovascular risk in hypertensive patients. Hypertension. 1999;33:1111–1117. [DOI] [PubMed] [Google Scholar]
- 75. Boutouyrie P, Tropeano AI, Asmar R, et al. Aortic stiffness is an independent predictor of primary coronary events in hypertensive patients: a longitudinal study. Hypertension. 2002;39:10–15. [DOI] [PubMed] [Google Scholar]
- 76. Laurent S, Boutouyrie P, Asmar R, et al. Aortic stiffness is an independent predictor of all‐cause and cardiovascular mortality in hypertensive patients. Hypertension. 2001;37:1236–1241. [DOI] [PubMed] [Google Scholar]
- 77. Silva JA, Barbosa L, Bertoquini S, et al. Relationship between aortic stiffness and cardiovascular risk factors in a population of normotensives, white‐coat normotensives, white‐coat hypertensives, sustained hypertensives and diabetic patients. Rev Port Cardiol. 2004;23:1533–1547. [PubMed] [Google Scholar]
- 78. Lekakis JP, Zakopoulos NA, Protogerou AD, et al. Arterial stiffness assessed by pulse wave analysis in essential hypertension: relation to 24‐h blood pressure profile. Int J Cardiol. 2005;102:391–395. [DOI] [PubMed] [Google Scholar]
- 79. Plantinga Y, Ghiadoni L, Magagna A, et al. Peripheral wave reflection and endothelial function in untreated essential hypertensive patients with and without the metabolic syndrome. J Hypertens. 2008;26:1216–1222. [DOI] [PubMed] [Google Scholar]
- 80. Brinton TJ, Kailasam MT, Wu RA, et al. Arterial compliance by cuff sphygmomanometer. Application to hypertension and early changes in subjects at genetic risk. Hypertension. 1996;28:599–603. [DOI] [PubMed] [Google Scholar]
- 81. Asmar R, Benetos A, London G, et al. Aortic distensibility in normotensive, untreated and treated hypertensive patients. Blood Press. 1995;4:48–54. [DOI] [PubMed] [Google Scholar]
- 82. Benetos A, Adamopoulos C, Bureau JM, et al. Determinants of accelerated progression of arterial stiffness in normotensive subjects and in treated hypertensive subjects over a 6‐year period. Circulation. 2002;105:1202–1207. [DOI] [PubMed] [Google Scholar]
- 83. Najjar SS, Scuteri A, Shetty V, et al. Pulse wave velocity is an independent predictor of the longitudinal increase in systolic blood pressure and of incident hypertension in the Baltimore Longitudinal Study of Aging. J Am Coll Cardiol. 2008;51:1377–1383. [DOI] [PMC free article] [PubMed] [Google Scholar]
- 84. Girerd X, Chanudet X, Larroque P, et al. Early arterial modifications in young patients with borderline hypertension. J Hypertens Suppl. 1989;7:S45–S47. [DOI] [PubMed] [Google Scholar]
- 85. Gedikli O, Kiris A, Ozturk S, et al. Effects of prehypertension on arterial stiffness and wave reflections. Clin Exp Hypertens. 2010;32:84–89. [DOI] [PubMed] [Google Scholar]
- 86. Safar ME, Blacher J, Protogerou A, et al. Arterial stiffness and central hemodynamics in treated hypertensive subjects according to brachial blood pressure classification. J Hypertens. 2008;26:130–137. [DOI] [PubMed] [Google Scholar]
- 87. Kyvelou S‐MG, Vyssoulis GP, Karpanou EA, et al. Arterial stiffness in offspring of hypertensive parents: a pilot study. Int J Cardiol. 2008;129:438–440. [DOI] [PubMed] [Google Scholar]
- 88. Kucerova J, Filipovsky J, Staessen JA, et al. Arterial characteristics in normotensive offspring of parents with or without a history of hypertension. Am J Hypertens. 2006;19:264–269. [DOI] [PubMed] [Google Scholar]
- 89. Yasmin, Falzone R, Brown MJ. Determinants of arterial stiffness in offspring of families with essential hypertension. Am J Hypertens. 2004;17:292–298. [DOI] [PubMed] [Google Scholar]
- 90. Reusz GS, Cseprekal O, Temmar M, et al. Reference values of pulse wave velocity in healthy children and teenagers. Hypertension. 2010;56:217–224. [DOI] [PubMed] [Google Scholar]
- 91. Urbina EM, Wadwa RP, Davis C, et al. Prevalence of increased arterial stiffness in children with type 1 diabetes mellitus differs by measurement site and sex: the SEARCH for Diabetes in Youth Study. J Pediatr. 2010;156:731–737. [DOI] [PubMed] [Google Scholar]
- 92. Zhu H, Yan W, Ge D, et al. Cardiovascular characteristics in American youth with prehypertension. Am J Hypertens. 2007;20:1051–1057. [DOI] [PubMed] [Google Scholar]
- 93. Simonetti GD, Eisenberger U, Bergmann IP, et al. Pulse contour analysis: a valid assessment of central arterial stiffness in children? Pediatr Nephrol. 2008;23:439–444. [DOI] [PubMed] [Google Scholar]
- 94. Haller MJ, Samyn M, Nichols WW, et al. Radial artery tonometry demonstrates arterial stiffness in children with type 1 diabetes. Diabetes Care. 2004;27:2911–2917. [DOI] [PubMed] [Google Scholar]
- 95. Whincup PH, Gilg JA, Donald AE, et al. Arterial distensibility in adolescents: the influence of adiposity, the metabolic syndrome, and classic risk factors. Circulation. 2005;112:1789–1797. [DOI] [PubMed] [Google Scholar]
- 96. Megnien JL, Simon A, Valensi P, et al. Comparative effects of diabetes mellitus and hypertension on physical properties of human large arteries. J Am Coll Cardiol. 1992;20:1562–1568. [DOI] [PubMed] [Google Scholar]
- 97. Armentano R, Simon A, Levenson J, et al. Mechanical pressure versus intrinsic effects of hypertension on large arteries in humans. Hypertension. 1991;18:657–664. [DOI] [PubMed] [Google Scholar]
- 98. Janz KF, Dawson JD, Mahoney LT. Predicting heart growth during puberty: the Muscatine Study. Pediatrics. 2000;105:E63. [DOI] [PubMed] [Google Scholar]
- 99. Bella JN, Devereux RB, Roman MJ, et al. Relations of left ventricular mass to fat‐free and adipose body mass: the strong heart study. The Strong Heart Study Investigators. Circulation. 1998;98:2538–2544. [DOI] [PubMed] [Google Scholar]
- 100. de Simone G, Greco R, Mureddu G, et al. Relation of left ventricular diastolic properties to systolic function in arterial hypertension. Circulation. 2000;101:152–157. [DOI] [PubMed] [Google Scholar]
- 101. Chirinos JA, Segers P, De Buyzere ML, et al. Left ventricular mass: allometric scaling, normative values, effect of obesity, and prognostic performance. Hypertension. 2010;56:91–98. [DOI] [PMC free article] [PubMed] [Google Scholar]
- 102. Julius S, Nesbitt SD, Egan BM, et al. Feasibility of treating prehypertension with an angiotensin‐receptor blocker. N Engl J Med. 2006;354:1685–1697. [DOI] [PubMed] [Google Scholar]