

Abstract
High mobility group A (HMGA) overexpression plays a critical role in neoplastic transformation. To investigate whether HMGA acts by regulating the expression of microRNAs, we analyzed the microRNA expression profile of human breast adenocarcinoma cells (MCF7) transfected with the HMGA1 gene, which results in a highly malignant phenotype. Among the microRNAs induced by HMGA1, we focused on miR-181b, which was overexpressed in several malignant neoplasias including breast carcinomas. We show that miR-181b regulates CBX7 protein levels, which are down-regulated in cancer, and promotes cell cycle progression. We also demonstrate that CBX7, being negatively regulated by HMGA, is able to negatively regulate miR-181b expression. Finally, there was a direct correlation between HMGA1 and miR-181b expression and an inverse correlation between HMGA1 and CBX7 expression in human breast carcinomas. These data indicate the presence of a novel pathway involving HMGA1, miR-181b, and CBX7, which leads to breast cancer progression.
Keywords: HMGA, miR-181, CBX7, breast carcinoma
Introduction
The high mobility group A (HMGA) family of proteins is encoded by 2 distinct genes: HMGA1 and HMGA2. The HMGA1 gene, located at chromosomal locus 6p21, codes for 3 proteins, HMGA1a, HMGA1b, and HMGA1c, which are produced by translation of alternatively spliced mRNA.1,2 The HMGA2 gene, located on chromosome 12q14-15, codes for a protein that shares a high sequence homology (~55% overall, including 3 conserved DNA-binding domains) with the HMGA1 proteins.3,4 HMGA proteins are able to bind DNA in AT-rich regions and interact with various transcription factors to enhance or inhibit gene transcription by acting as architectural proteins.5,6 HMGA protein expression is abundant during embryogenesis, whereas it is absent or detected at very low levels in normal adult tissues.7 Conversely, HMGA proteins are highly expressed in all malignant neoplasias analyzed so far, namely, pancreas, thyroid, colon, breast, lung, ovary, uterine cervix, prostate, gastric carcinomas, squamous carcinomas of the oral cavity, and head and neck tumors.8 HMGA overexpression is mainly associated with a highly malignant phenotype and is an index of poor prognosis because its overexpression often correlates with metastases and reduced survival.8
HMGA proteins play a key role in neoplastic transformation. In fact, blockage of hmga1 synthesis prevents rat thyroid cell transformation by murine transforming retroviruses,9,10 whereas an adenovirus carrying the HMGA1 gene in the antisense orientation induces apoptotic cell death in anaplastic human thyroid carcinoma cell lines but not in normal thyroid cells.11 The oncogenic role of HMGA has been demonstrated in both in vivo and in vitro studies. In vitro, transgenic mice overexpressing the hmga genes develop several types of neoplasias,12-14 whereas in vivo, human breast epithelial cells harboring a tetracycline-regulated HMGA1 transgene acquire the ability to form primary and metastatic tumors in nude mice only when the transgenes are actively expressed.15 Moreover, it has been demonstrated that hmga1 and 2 overexpression can induce transformation of rat and mouse cells.16
Recently, microRNAs (miRNAs or miRs) have emerged as an important class of short endogenous RNAs that act as posttranscriptional regulators of gene expression. MiRNAs are small RNA molecules 19-22-nt long that derive from double-stranded RNAs (dsRNAs). These tiny fragments of RNA regulate gene expression by hybridizing to complementary sequences in the 3′ untranslated region (3′ UTR) of target mRNA. The majority of miRNAs identified are highly evolutionarily conserved among many distantly related species, which suggests that miRNAs play a very important role in essential biological processes including developmental timing, stem cell differentiation, signaling transduction, and cancer. Currently, miRNAs are one of the most important regulatory molecules that modulate gene expression at the posttranscriptional level by targeting mRNAs for direct cleavage or translation repression.17 Each miRNA is thought to regulate multiple genes, and because hundreds of miRNA genes are predicted to be present in higher eukaryotes,18-20 the potential regulatory circuitry afforded by miRNAs is enormous. A large body of evidence suggests that miRNAs, by targeting oncogenes or tumor suppressor genes, play a role in the etiology and pathogenesis of cancer.21 In fact, miR-15a and miR-16 target the antiapoptotic gene BCl-2,22 whereas miR-372 and miR-373 target the LATS32 tumor suppressor.23 Moreover, miR-21 was shown to directly target the tumor suppressor PTEN in cholangiocarcinoma cells,24 and miR-221/222, which are up-regulated in thyroid and prostate cancer,25 were demonstrated to target the p27 protein.26,27
Therefore, it is feasible that HMGA1 proteins affect cancer pathogenesis by regulating the miRNA expression pattern in a way that promotes cell transformation. To address this hypothesis, we have analyzed the microRNA expression profile of the MCF7 cell line that harbors the HMGA1b transgene.28 In a previous study conducted with HMGA1b-transfected MCF7 cells, we found compelling evidence of the epithelial-mesenchymal transition, that is, a change in morphology characterized by the acquisition of a round shape, an increased growth rate compared to control cells, and an increase of the cell population in S phase with a corresponding reduction of the G0/G1 population.28 Here, we report that HMGA1 is able to regulate the expression of a set of microRNAs, and in particular, it is able to directly up-regulate the expression of miR-181b, which is frequently activated in several malignant neoplasias including breast carcinomas.21 We also show that miR-181b targets CBX7 (chromobox homolog 7), a gene down-regulated during cancer progression and able to negatively regulate the cell cycle at G1 phase.29 Interestingly, experiments using mouse embryonic fibroblasts (MEFs) null for CBX7 indicate the presence of a CBX7/miR-181b loop that may lead to reduced synthesis of the CBX7 protein. Furthermore, we show that HMGA1 is able to negatively regulate CBX7 gene expression. Finally, analysis of human breast carcinomas revealed a direct correlation between HMGA1 and miR-181b expression and an inverse correlation between miR-181b and CBX7 protein levels and between HMGA1 and CBX7 gene expression, which suggests the presence of a novel pathway constituted by HMGA1, CBX7, and miR-181b that may have a critical role in cancer progression.
Results
MiRNA Expression Profile of MCF7 Cells Overexpressing the HMGA1b Protein
Using an LNA-based mirCHIP platform, we analyzed the microRNA expression profile of 3 independent HMGA1b-transfected MCF7 clones and backbone vector-transfected MCF7 clones (Supp. Fig. S1). Statistical and bioinformatic analysis (ANOVA) of microarray data generated a list of microRNAs that were significantly deregulated in MCF7 cells expressing high HMGA1b protein levels. In particular, 31 microRNAs were differentially expressed with a significant fold change (higher than 2) in HMGA1b-transfected cells versus the backbone vector-transfected cells. Among these miRNAs, 13 were up-regulated, and 18 were down-regulated in MCF7/HMGA1b cells in comparison to the backbone vector-transfected cells (Table 1). To verify the microarray results, we evaluated the expression of 5 differentially expressed miRNAs (miR-181b, miR-148b, miR-326, miR-195, and miR-096) by quantitative RT-PCR (qRT-PCR) in different cell clones overexpressing the HMGA1b protein (Supp. Fig. S2). In the case of miR-181b, miR-096, and miR-326, the differences in the expression between MCF7/backbone vector and MCF7/HMGA1b cells were even greater than appeared from microarray studies (Supp. Fig. S2 and Table 1). Subsequently, we focused on miR-181b because it is significantly up-regulated in different neoplasias, that is, acute lymphocytic leukemia30 and thyroid,25 prostate, breast,21 and colorectal carcinomas.31 Moreover, increased miR-181b has been recently associated (as already shown also for the HMGA proteins) with cancer progression in oral squamous cell carcinoma.32 Moreover, it has been demonstrated that miR-181b enhances matrix metallopeptidases (MMP)2 and MMP9 activity and promotes growth, clonogenic survival, migration, and invasion of hepatocellular carcinoma cells.33
Table 1.
miRs Differentially Expressed between MCF7 Cells and MCF7 Expressing High Levels of HMGA1b Protein
| microRNA Name | Chromosome Map | Fold Change | P Value |
|---|---|---|---|
| miR-345 | 14q32.2 | −6.84 | 0.03442 |
| miR-326 | 11q13.4 | −4.57 | 0.00022 |
| miR-323 | 14q32.31 | −4.11 | 0.00447 |
| miR-194-2 | 11q13.1 | −3.96 | 0.00897 |
| miR-198 | 3q13.33 | −3.74 | 0.02766 |
| miR-210 | 11q15.5 | −3.31 | 0.02354 |
| miR-133b | 6p12.2 | −3.20 | 0.00897 |
| miR-342 | 14q32.2 | −3.02 | 0.00076 |
| miR-338 | 17q25.3 | −3.00 | 0.04556 |
| miR-339 | 7q.22.3 | −2.91 | 0.00059 |
| miR-328 | 16q22.1 | −2.90 | 0.00089 |
| miR-096 | 7q32.2 | −2.65 | 0.00004 |
| miR-145 | 5q32 | −2.65 | 0.00676 |
| miR-218 | 4p15.31 | −2.62 | 0.00989 |
| miR-320 | 8p21.3 | −2.44 | 0.00036 |
| miR-197 | 1p13.3 | −2.30 | 0.00504 |
| miR-93 | 7q22.1 | −2.17 | 0.00076 |
| miR-184 | 15q25.1 | −2.06 | 0.00556 |
| miR-26b | 2q35 | 2.09 | 0.00267 |
| miR-192 | 11q13.1 | 2.17 | 0.00090 |
| miR-335 | 7q32.2 | 2.29 | 0.00765 |
| miR-203 | 14q32.2 | 2.31 | 0.00003 |
| miR-30c-2 | 6q13 | 2.34 | 0.00078 |
| miR-196b | 7p15.2 | 2.60 | 0.00065 |
| miR-025 | 7q22.1 | 2.93 | 0.02330 |
| miR-148b | 12q13.13 | 3.90 | 0.00006 |
| miR-206 | 6p12.2 | 4.14 | 0.00067 |
| miR-026a-2 | 12q14.2 | 4.51 | 0.00216 |
| miR-181b-2 | 9q33.3 | 5.20 | 0.00056 |
| miR-181b-1 | 1q31.1 | 6.95 | 0.00004 |
| miR-195 | 17p13.1 | 8.41 | 0.00012 |
miR-181b and miR-181a are part of the same cluster and are transcribed as a single primary transcript. Therefore, we also evaluated the expression of miR-181a in the same cells. As shown in Figure 1A, miR-181a was overexpressed (even more than miR-181b) in HMGA1b-transfected MCF7 cells (Fig. 1A). The same results were obtained in T47D cells, which is another human breast cancer cell line (Fig. 1B). Interestingly, miR-181b and miR-181a were not induced when MCF7 cells were transfected with HMGA2, the other member of the HMGA protein family (data not shown).
Figure 1.
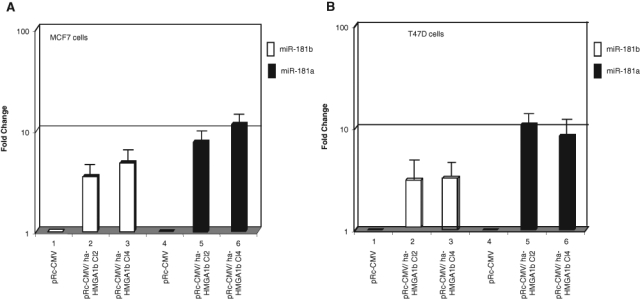
HMGA1 regulates miR-181b and miR-181a expression in breast cancer cell lines. (A) MirVana qRT-PCR analysis of miR-181b and miR-181a expression in MCF7 cells transfected with ha-HMGA1b (bars 2 and 3, 5, and 6) or with empty vector pRc-CMV (bars 1 and 4). (B) MirVana qRT-PCR analysis of miR-181b and miR-181a expression in T47D breast carcinoma cells transfected with HMGA1b (bars 2 and 3, 5, and 6) or pRc-CMV (bars 1 and 4). Relative miR-181b and miR-181a levels were normalized to the U6 RNA using the 2−ΔCt method,25 and the fold-change values indicate the relative change in expression levels between the HMGA1b-transfected cells and the pRc-CMV-transfected cells, assuming that the value of cells transfected with the vector alone is equal to 1. The results are reported as the mean of the expression values with error bars indicating standard deviation (mean ± SD); n = 3.
MiR-181b Expression Correlates with hmga1 Expression in Mouse and Rat Cells
To look for more evidence that miR-181b expression is positively regulated by HMGA1, we evaluated the expression of miR-181b in retrovirally transformed rat thyroid cells expressing or not expressing the hmga1 proteins. MiR-181b expression was higher (Fig. 2A) in rat thyroid cells transformed by the Kirsten murine sarcoma virus (FRTL5-KiMSV) expressing the hmga1 proteins (Fig. 2B) than in normal thyroid cells not expressing the hmga1 proteins (FRTL5) (Fig. 2B). Conversely, miR-181b expression levels were similar in FRTL5 cells and in FRTL5/KIMSV cells previously transfected with a vector carrying the HMGA1 gene in an antisense orientation (FRTL5-KiMSV-HMGA1as) (Fig. 2A) and therefore not expressing the hmga1 proteins (Fig. 2B).9,10 Subsequently, we looked for a correlation between HMGA1 and miR-181b expression in MEFs null for hmga2 or hmga1. While miR-181b expression did not significantly differ between wild-type and hmga2-null MEFs (Fig. 2C), miR-181b expression was significantly reduced in MEFs null for hmga1 (Fig. 2C). These results demonstrate a correlation between miR-181b and HMGA1 expression, which suggests that HMGA1 induces miR-181b expression.
Figure 2.
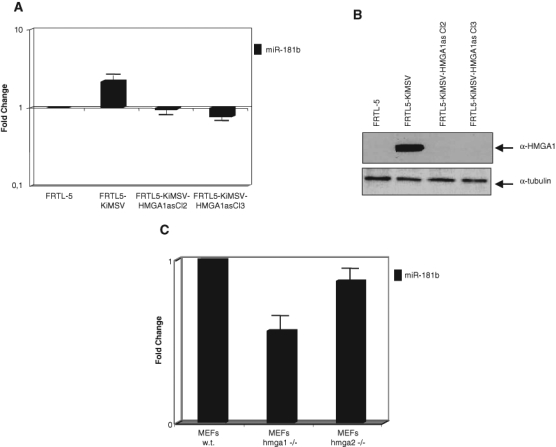
Analysis of miR-181b and miR-181a expression in cells expressing or not the HMGA1 protein. (A) MirVana qRT-PCR analysis of miR-181b expression in normal and retrovirally infected cells. Relative miR-181b levels were normalized to the U6 RNA using the 2−ΔCt method,25 and the fold-change values indicate the relative change in expression levels between normal and retrovirally infected rat thyroid cells, assuming that the value of normal cells is equal to 1. The results are reported as the mean of expression values; error bars indicate standard deviation (mean ± SD); n = 3. (B) Western blot analysis of hmga1 expression in normal and retrovirally infected cells. The Western blot was incubated with antibodies specific for the HMGA1 protein. As control for equal loading, the same blot was incubated with antibodies against α-tubulin. (C) Correlation between hmga1 and miR-181b in murine embryonic fibroblasts (MEFs). MirVana qRT-PCR analysis of miR-181b expression in MEFs null for hmga1 (bar 2) and hmga2 (bar 3). The relative amount of the RNA was normalized to the U6 RNA using the 2−ΔCt method,25 and the fold-change values indicate the relative change in expression levels between the hmga1−/− or hmga2−/− and wild-type cells, assuming that the value of wild-type MEFs is equal to 1. The results are reported as the mean of the expression values, with error bars indicating standard deviation (mean ± SD); n = 3.
HMGA1 Protein Binds to a Region Upstream of the miR-181b Locus
We next investigated whether HMGA1 directly binds to regulatory regions of miR-181b. Because HMGA proteins bind DNA in AT-rich regions through 3 basic domains called “AT-hooks,”5 we looked for putative HMGA1-binding sites in a 10-kb region surrounding the miR-181b cluster on chromosome 1. Four putative binding sites, containing several AT-rich DNA stretches, located in a region within 10 kb upstream of miR-181b, were identified (Fig. 3A). Sequence alignment showed that these predicted HMGA1-binding sequences overlap with the most highly conserved genome regions (Fig. 3A). Subsequently, we performed chromatin immunoprecipitation (ChIP) assays to determine whether the HMGA1 proteins could bind to these sequences. To this aim, the chromatin of MCF7/backbone vector and MCF7/HMGA1b cells was cross-linked and immunoprecipitated with anti-HMGA1 or anti-IgG antibodies. Immunoprecipitated DNA was then analyzed by semiquantitative PCR using primers covering the 4 putative binding sites. Amplification of a region corresponding to genomic position Chr1:197094905-197095305 (region A) (Fig. 3A) was observed in MCF7/HMGA1b cells but not in the backbone vector-transfected MCF7 cells (Fig. 3B). No amplification was observed with anti-IgG precipitates (Fig. 3B) or when primers for the control promoter GAPDH were used (data not shown), which shows that the binding is specific for the region upstream of the miR-181b cluster. These results indicate that the HMGA1b protein is able to bind in vivo a region located upstream of the miR-181 locus that probably has regulatory functions because it is highly evolutionarily conserved.
Figure 3.

HMGA1 binds a region upstream of the miR-181b gene. (A) Schematic representation of the genomic locus of miR-181b and of all putative conserved HMGA1b binding sites (indicated as A, B, C, and D) and analyzed in ChIP experiments. (B) ChIP of a miR-181b upstream genomic region. Semiquantitative PCR of the region flanking the putative HMGA1b binding sites (indicated as A in panel A) in the miR-181b upstream genomic region was performed to evaluate the amount of chromatin obtained by immunoprecipitation relative to the amount in the input samples. (C) Oligonucleotide pull-down assay. Proteins were extracted from MCF7 cells stably transformed with a pRcCMV/HMGA1b vector. The pull-down assay was performed as described in the Materials & Methods section. The samples were denatured and resolved on SDS-PAGE, and blots were probed with HMGA1-specific antibodies. (D) The same oligonucleotide pull-down experiment was performed with nonbiotinylated competitor oligonucleotides. We used a 10-fold excess of oligo 1 nonbiotinylated for nonspecific competition with respect to oligo 5-biotinylated (lane 4) and 10-fold excess of oligo 5-nonbiotinylated for specific competition with respect to oligo 5-biotinylated (lane 3).
To identify the AT-stretch, located within the window sequence identified by ChIP, which binds the HMGA1b protein, we examined proteins extracted from MCF7/HMGA1b cells in a DNA pull-down assay with double-stranded oligonucleotides corresponding to each putative binding site (Materials & Methods). The DNA-protein complexes were recovered using streptavidin-agarose beads, and the bound proteins were subjected to Western blot analysis. As shown in Figure 3C, the HMGA1b protein associates only with oligonucleotide 5, which corresponds to genomic position chr1:197095215-197095253. Consistently, when identical experiments were performed in the presence of nonbiotiotinylated competitor oligonucleotides, no HMGA1b binding was observed (Fig. 3D). These results, together with the ChIP data, demonstrate that HMGA1b directly binds a specific AT-stretch element between nucleotides −381 and −421 upstream of the miR-181b locus.
MiR-181b and HMGA1 Are Overexpressed in Human Breast Carcinomas, and Their Expression Is Positively Correlated
Because protein HMGA1b is overexpressed in human breast carcinomas,34 we measured miR-181b expression in this neoplasia to determine whether miR-181b expression correlated with HMGA1b expression in vivo. As shown in Figure 4A and B, HMGA1 and miR-181b expression was higher in almost all breast carcinoma samples than in normal breast tissue. Moreover, there was a significant positive correlation between HMGA1b and miR-181b expression levels (Fig. 4C). These results suggest that HMGA1b overexpression could induce miR-181b expression also in vivo.
Figure 4.
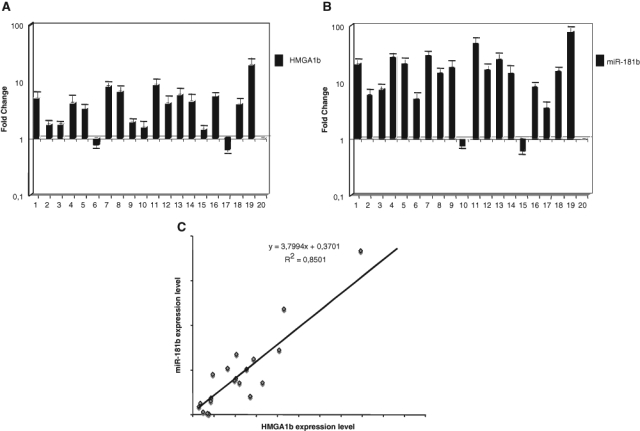
miR-181b expression directly correlates with the expression of the HMGA1 gene in human breast carcinoma tissues. (A) qRT-PCR analysis of HMGA1b mRNA expression. The fold-change values indicate the relative change in the expression levels between normal and carcinoma samples, assuming that the value of each matched normal breast tissue is equal to 1. (B) MirVana qRT-PCR analysis of miR-181b expression in the samples shown in panel A. (C) Plot of the data generated from panels A and B defines the linear relationship between miR-181b and HMGA1b expression by measuring the Pearson coefficient correlation reported in the figure.
CBX7 Is a Target of miR-181b
Because microRNAs modulate the expression of mRNA targets, we used bioinformatic tools (mirGen, Target Scan, Pictar, and miRanda) to search for potential mRNA targets of miR-181b. We identified several genes involved in DNA replication, cell cycle control, and cell death regulation that were potentially targeted by miR-181b. Among them, we selected the CBX7 gene, which encodes a chromobox family protein involved in the compaction of heterochromatin. We selected this gene also because we previously found a strong correlation between down-regulation of CBX7 gene expression and onset of a highly malignant phenotype of thyroid carcinomas.29 Moreover, more recently, we demonstrated that loss of CBX7 expression correlates with reduced E-cadherin expression35 and poor survival in colon and pancreatic carcinomas (Pallante et al., submitted manuscript). Two sites that match the miR-181b seed sequences were predicted in the 3′UTR of the CBX7 gene (Fig. 5A). To validate the influence of miR-181b on the CBX7 target, we transfected the Pre-miR-181b oligonucleotide and searched for changes in CBX7 protein levels by Western blot analysis (Fig. 5B). The introduction of miR-181b significantly decreased (about 50%) CBX7 protein levels in a dose-dependent manner (Fig. 5C). Conversely, CBX7 expression was unchanged when the same cells were transfected with the scrambled oligonucleotides (Fig. 5C). Interestingly, there were no significant changes in CBX7 mRNA levels in cells transfected with the Pre-miR-181b or with the scrambled oligonucleotides (Fig. 5D). These results are consistent with posttranscriptional regulation of the CBX7 protein by miR-181b and exclude its role in CBX7 mRNA degradation.
Figure 5.
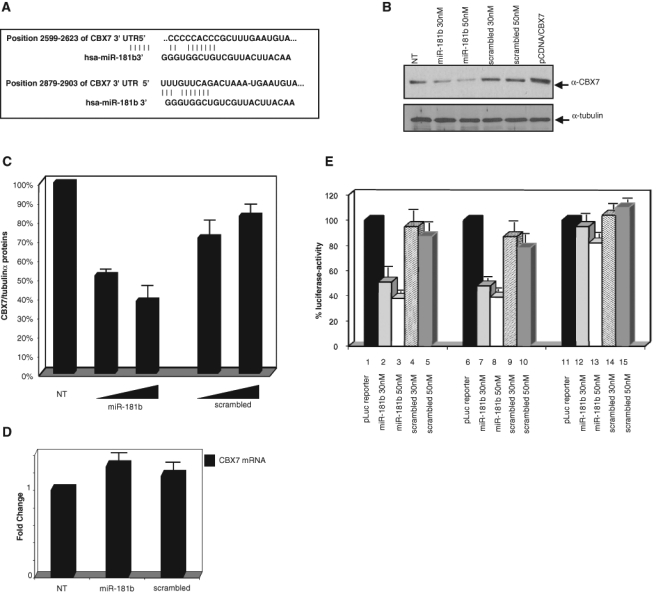
CBX7 is a direct target of miR-181b. (A) Identification of 2 putative miR-181b binding sites in the 3′UTR of CBX7 in human species. (B) The MDA-MB435s cells were transfected with the Pre-miR-181b oligonucleotide or scrambled oligonucleotide at the indicated concentrations. The proteins were extracted from the untransfected (NT) and transfected cells and immunoblotted with antibodies against CBX7 and tubulin as loading control. A representative experiment out of 3 is presented. (C) Densitometric analysis of CBX7 protein levels (shown in panel A) normalized to α-tubulin protein. Percentage expression values are indicated. (D) qRT-PCR analysis of CBX7 mRNA levels in the same samples shown in panel A. The fold-change values indicate the relative change in CBX7 mRNA expression levels between scrambled and miR-181b-treated cells, normalized with GAPDH. The results are reported as the mean of the expression values, with error bars indicating standard deviation (mean ± SD); n = 3. (E) Percentage of luciferase activity in MDA-MB435s cells transfected with pLuc CBX7-3′UTR (bar 1) or pLuc CBX7-3′UTR DEL1 (bar 6) or pLuc CBX7-3′UTR DEL2 (bar 11) in combination with Pre-miR-181b oligonucleotide (bar 2-3, bar 7-8, and bar 12-13) or scrambled oligonucleotide (bar 4-5, bar 9-10, and bar 14-15) to the indicated concentrations. The relative activity of firefly luciferase expression was standardized to a transfection control using Renilla luciferase. The results are reported as the mean of the expression values, with error bars indicating standard deviation (mean ± SD); n = 6.
To determine whether direct interaction between miR-181b and CBX7 mRNA caused the decrease in CBX7 protein expression, we inserted downstream of the luciferase ORF the 836-bp fragment (position 2234-3070) of the 3′UTR of the CBX7 mRNA and cloned it into the pGL3-control vector. This reporter vector was transfected into the MDA-MB435s cells with the Pre-miR-181b and scrambled oligonucleotide, and luciferase activity was measured 48 hours later. As shown in Figure 5E, miR-181b significantly reduced, in a dose-dependent manner, luciferase activity as compared with untreated cells. Conversely, no effect was observed after treatment with the scrambled oligonucleotide. These results indicate that miR-181b interferes with CBX7 mRNA translation by directly interacting with the 3′UTR. This conclusion is supported by similar experiments in which we used a reporter construct carrying target sites modified by introducing a point deletion in one or in both sites (deletion of 8 nucleotides). Only the reporter vector carrying the deletion in both target sites (pLuc CBX7-3′UTR DEL2) was insensitive to the effect of miR-181b (Fig. 4E), which demonstrates that deletion in only one target site of the CBX7-3′ UTR is not sufficient to block miR-181b function.
MiR-181b Expression Promotes the G1-S Transition
We previously showed that HMGA1 increases the growth rate of MCF7/HMGA1b cells, with an increase of the cell population in S phase, and exerts an antiapoptotic effect on these cells.28 We also showed that CBX7 reduces proliferation of human thyroid carcinoma cells by retaining them in the G1 phase of the cell cycle.29 Therefore, we investigated whether miR-181b could be, at least partially, responsible for these effects. To this aim, we used flow cytometric analysis (FACS) to measure the DNA content of MDA-MB435s cells treated with the Pre-miR-181b or a scrambled oligonucleotide. Transition from G1 to S phase was significantly higher in Pre-miR-181b-treated cells han in scrambled-treated cells (Fig. 6A). In fact, 30% of scrambled-treated MDA-MB435s cells were in S phase and 60% in G0/G1 phase, whereas 40% of miR-181b-treated cells were in S phase and 50% in G0/G1 phase (Fig. 6B). FACS analysis also showed fewer cells, including apoptotic cells, in the sub-G1 phase when cells were transfected with Pre-miR-181b than in MDA-MB435s cells transfected with the scrambled oligonucleotide (Fig. 6B). These results indicate that miR-181b overexpression increases the cell proliferation rate, whereas it reduces the number of apoptotic cells.
Figure 6.
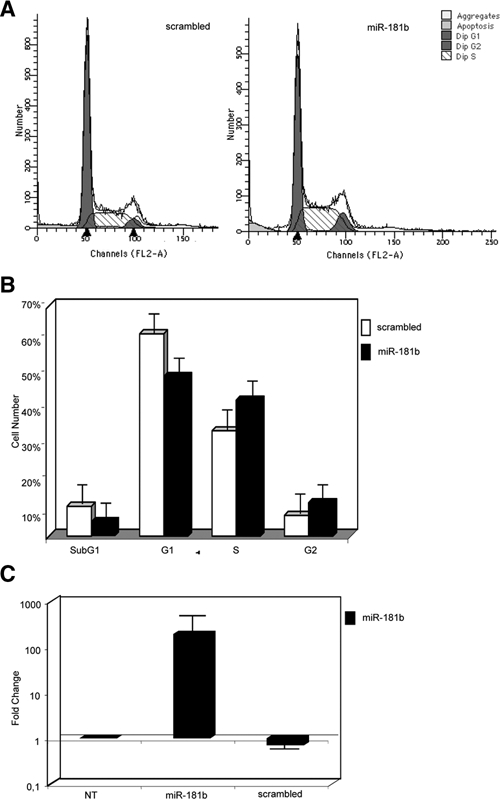
miR-181b expression increases the cell population in S phase of the cell cycle in MDA-MB435s cells. (A and B) Cell-cycle distribution of MDA-MB435s cells, in the exponential phase of growth, transfected with Pre-miR-181b precursor molecules or scrambled control. Forty-eight hours after transfection, the cells were fixed in ethanol and stained with propidium iodide. (A) Primary flow cytometry histograms. (B) Quantification of the cell population in different cell cycle phases with the CELL-FIT program. The error bars represent the standard deviation of the mean of 3 independent experiments. (C) MirVana qRT-PCR analysis of miR-181b expression. The relative amount of miR-181b was normalized to the U6 RNA using the 2−ΔCt method,25 and the fold-change values indicate the relative change in expression levels between the cells transfected with Pre-miR-181b or scrambled oligonucleotide versus untransfected cells (NT), assuming that the value of the NT sample is equal to 1.
CBX7 Negatively Regulates miR-181a and miR-181b Expression
Having recently generated CBX7-null mice in our laboratory, we evaluated miR-181a and miR-181b expression in mouse embryonic fibroblasts from wild-type, CBX7+/−, or CBX7−/− mice. As shown in Figure 7, miR-181a and miR-181b expression was higher in CBX7-minus MEFs than in wild-type MEFs, whereas the level of miR-181a/b expression in CBX7+/− MEFs was intermediate. These results indicate that both miR-181a and miR-181b are negatively regulated by CBX7 in a dose-dependent manner.
Figure 7.
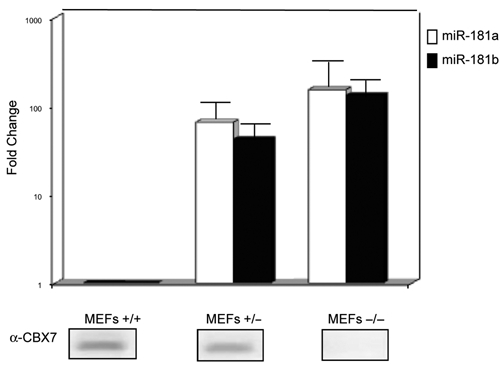
CBX7 modulates the miR-181b expression. MirVana qRT-PCR analysis of miR-181a and miR-181b expression in MEFs−/− or +/− for CBX7 gene. The relative amount of the RNA was normalized to the U6 RNA using the 2−ΔCt method,25 and the fold-change values indicated the relative change in expression levels between the CBX7−/− or CBX7+/− versus wild-type cells, assuming that the value of wild-type MEFs was equal to 1. The results are reported as the mean of the expression values, with error bars indicating standard deviation (mean ± SD); n = 3. In the bottom, we show the Western blot analysis of CBX7 expression in MEFs wild type, MEFs−/−, or +/− for CBX7.
miR-181b and CBX7 Protein Expression in Human Breast Neoplasias
To determine whether miR-181b regulates CBX7 protein levels also in vivo, we analyzed CBX7 and miR-181b levels in a set of human breast carcinomas constituted by benign fibroadenomas and ductal and lobular carcinomas. As shown in Table 2 and Figure 8A, CBX7 expression was lower in all breast carcinomas versus control tissue, and the protein levels were inversely correlated with the degree of malignancy. Conversely, CBX7 expression was similar in fibroadenomas and in normal breast tissues. Equally, miR-181b was not overexpressed in fibroadenomas, whereas it was increased in all breast carcinoma samples (Fig. 8B), particularly in breast carcinomas of the lobular histotype in which CBX7 protein levels were very low or absent. These results could indicate that miR-181b may regulate CBX7 protein levels also in vivo. In Supplementary Table S1, we show the immunohistochemical analysis of CBX7 and HMGA1 proteins in the same neoplastic breast tissues shown in Figure 8B. An inverse significant correlation was observed between HMGA1 and CBX7 protein expression.
Table 2.
CBX7 Protein Expression in Normal and Neoplastic Breast Tissues by Immunohistochemistry
| Histotype | Cases | High Expressorsa |
|---|---|---|
| Normal breast tissue | 5 | 100% |
| Fibroadenomas | 8 | 100% |
| Ductal carcinomas grade 1 (G1) | 10 | 50% |
| Ductal carcinomas grade 2 (G2) | 16 | 40% |
| Ductal carcinomas grade 3 (G3) | 17 | 19% |
| Lobular carcinomas | 15 | 21% |
High expressors: cases with more than 50% of cells showing CBX7 staining.
Figure 8.
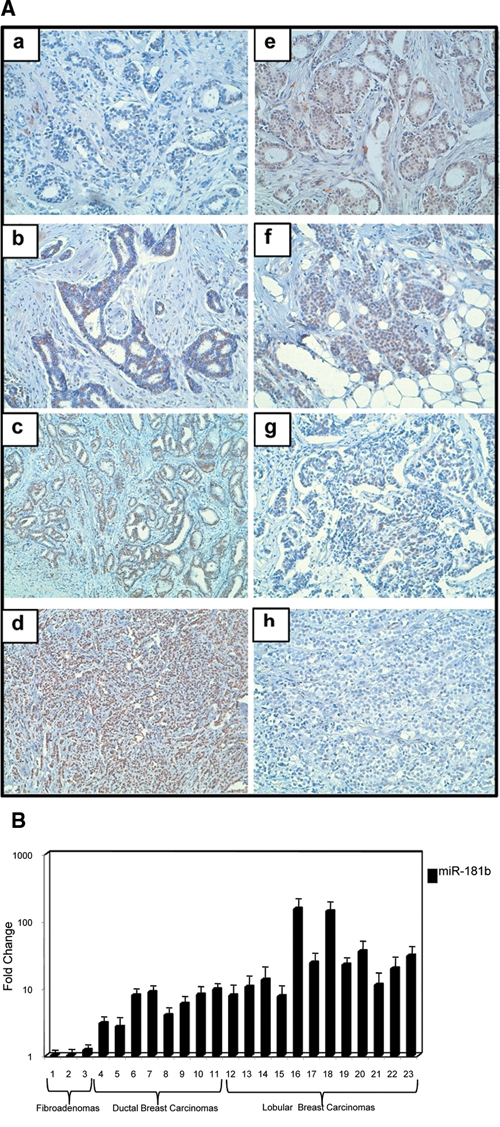
The miR-181b, HMGA1, and CBX7 protein expression in human breast neoplasias. (A) Immunohistochemical analysis of HMGA1 and CBX7 expression in malignant breast neoplasias. Paraffin sections from neoplastic breast tissues were analyzed by immunohistochemistry with antibodies raised against specific antibodies against a specific HMGA1 and CBX7 peptide. No immunoreactivity with HMGA1 antibody appeared in normal tissue (a), while nuclear staining is evident in G1 ductal carcinoma (b), and more intense staining is present in G3 ductal (c) and lobular breast carcinomas (d). CBX7 nuclear staining was intense in normal breast tissue (e), while the decrease of CBX7 in neoplastic lesions was progressive going from well-differentiated cancer, such as from G1 (f) to G3 ductal carcinoma (g), but in particular, no immuoreactivity appeared in lobular breast carcinoma (h). (B) MirVana qRT-PCR analysis of miR-181b expression. The fold-change values indicate the relative change in the expression levels between normal and carcinoma samples, assuming that the value of each matched normal breast tissue is equal to 1.
HMGA1 Proteins Modulate CBX7 Expression
Because CBX7 is down-regulated in cancer progression, whereas HMGA expression is induced at the same step of carcinogenesis (Fig. 8A), we evaluated whether HMGA1 can directly down-regulate CBX7. To this aim, we evaluated the expression of CBX7 in FRTL5, FRTL5-Ki-MSV, and FRTL5-KiMSV-HMGA1as cells using RT-PCR. Interestingly, CBX7, which was normally expressed in FRTL5 cells, was lost in FRTL5-KiMSV cells but not in FRTL5-KiMSV-HMGA1as cells not expressing the HMGA1 proteins (Fig. 9A). The same results were obtained in PC MPSV-HMGA1as cells compared with the PC MPSV cells and in MEFs obtained from hmga1 knockout mice (data not shown).
Figure 9.

HMGA proteins modulate CBX7 expression in vitro and in vivo. (A) RT-PCR analysis of CBX7 mRNA expression in rat thyroid cells expressing or not hmga1 gene. GAPDH gene expression was evaluated as control to normalize the amount of the used RNAs. (B) Soluble chromatin from FRTL5 and FRTL5-KiMSV was immunoprecipitated with anti-HMGA antibody, and the DNAs were amplified by PCR. IgG was used as immunoprecipitation control. (C) qRT-PCR analysis of HMGA1b mRNA expression. The fold-change values indicate the relative change in the expression levels between normal and carcinomas samples, assuming that the value of each matched normal breast tissue is equal to 1. (D) qRT-PCR analysis of CBX7 mRNA expression in the samples shown in panel C. (E) Plot of the data generated from panels C and D defines the linear relationship between HMGA1b and CBX7 expression by measuring the Pearson coefficient correlation reported in the figure. (F) Novel pathway leading to cancer progression. The induction of HMGA1 down-regulates CBX7 expression and up-regulates miR-181b, which in turn would further decrease CBX7 protein level.
Because these results suggest that HMGA1 proteins are able to regulate the expression of CBX7, we investigated whether HMGA1 proteins are directly involved in the regulation of CBX7 transcription. We therefore evaluated whether HMGA1 protein could bind the CBX7 promoter in vivo by performing ChIP assays in FRTL5 and FRTL5-Ki-MSV cells. Immunoprecipitated chromatin with anti-HMGA1-specific antibodies was analyzed by semiquantitative PCR using primers spanning the region of the CBX7 promoter from 530 bp to 346 bp upstream of the transcription start site. Anti-HMGA1 antibodies precipitated this CBX7 promoter region from FRTL5-KiMSV cells, whereas no immunoprecipitation was observed from FRTL5 cells not expressing the HMGA1 proteins (Fig. 9B) or with IgG precipitates (Fig. 9B), which shows that the binding is specific for the CBX7 promoter. These results indicate that HMGA1b protein binds the CBX7 promoter.
To address further the hypothesis that CBX7 expression could be under the control of HMGA1 activity, we suppressed HMGA1 protein synthesis by interference methodology in ARO cells and analyzed CBX7 expression. Transfection of siRNA oligonucleotides targeting HMGA1 drastically reduced HMGA1 protein levels in the ARO cell line, and consistent with our hypothesis, CBX7 expression was restored (Supp. Fig. S3). Subsequently, we analyzed HMGA1 and CBX7 mRNA expression in a panel of breast neoplastic samples. The data reported in Figure 9C and D demonstrate an inverse correlation between HMGA1b and CBX7 gene expression (Fig. 9E). Conversely, as expected from our previous data,34 HMGA1 was not overexpressed in fibroadenomas in which CBX7 expression was normal (data not shown).
Discussion
Through recognition and modulation of DNA and chromatin structure,36,37 HMGA proteins participate in the transcriptional regulation of a number of genes that have critical roles in the process of carcinogenesis.38,39 Therefore, altered expression of HMGA genes could lead to drastic changes in the expression of these genes, thereby contributing significantly to the transformed and/or metastatic phenotype. Indeed, HMGA proteins play a decisive role in the process of carcinogenesis, their overexpression being a feature of malignant neoplasias, and they play a causal role in cell transformation.12,16,40 We previously showed that HMGA1 was overexpressed in 60% of breast ductal carcinomas, and its protein levels were significantly correlated with c-Erb-B2 expression.34 Moreover, HMGA1 protein levels are reported to be directly correlated with the metastatic phenotype of human breast cancer cell lines.41 Lastly, overexpression of HMGA1b protein in MCF7 cells leads to a more aggressive phenotype.28
Given the importance of microRNAs in gene regulation and carcinogenesis, we investigated whether HMGA1 overexpression could contribute to cell transformation by regulating microRNA expression. Therefore, we analyzed the miRNA expression profile of HMGA1b-transfected MCF7 versus the same cells transfected with the backbone vector. We identified 31 miRNAs whose expression was significantly deregulated by HMGA1 protein overexpression. Among the microRNAs induced by HMGA1b, we concentrated on miR-181b because its induction is a constant feature of several malignant neoplasias, namely, human thyroid,25 pancreatic, prostatic, and breast carcinomas.42 Interestingly, among the microRNAs induced by HMGA1, we have found the miR-195: it is up-regulated in breast carcinomas43 and has a critical role in the regulation of human embryonic stem cell division,44 consistent with positive regulation by the HMGA1 proteins, which are known to be particularly abundant during embryogenesis.7
Here, we report evidence that miR-181b expression is dependent on HMGA1b. In fact, miR-181b was induced also in T47D cells carrying the HMGA1b transgene, whereas miR-181b expression was lower in MEFs null for hmga1 than in wild-type MEFs. Moreover, miR-181b was not expressed in rat thyroid cells carrying the v-ras-Ki oncogene in which hmga1 expression was suppressed by antisense methodology, whereas it was abundantly expressed in v-ras-Ki-transformed cells expressing hmga1. Regulation of miR-181b by HMGA1b seems to be direct. In fact, upstream of the miR-181 gene, ChiP revealed a highly interspecies conserved AT-rich region that binds HMGA1b. It is noteworthy that miR-181b expression is not up-regulated by other members of the HMGA family. This result seems to confirm that members of the HMGA family have different transcriptional activities. Interestingly, HMGA1 but not HMGA2 was overexpressed in most of the breast carcinomas analyzed by our group (Chiappetta, unpublished data).
Another aim of our study was to identify the miR-181b target to understand whether its induction might be involved in the epithelial-mesenchymal transition of MCF7 cells and perhaps in the development of human breast carcinomas. We demonstrate that the polycomb CBX7 gene, whose loss of expression correlates with a poor outcome in colon cancer patients (Pallante et al., submitted manuscript) and with the onset of a highly malignant phenotype of thyroid carcinoma,29 is a target of miR-181b. In fact, enforced expression of miR-181b significantly decreased CBX7 protein levels. This effect seems to be due to inhibition of the CBX7 mRNA translation process because no significant changes were observed in mRNA levels after miR-181b treatment. Consistent with this result, we also demonstrate that miR-181b directly regulates CBX7 mRNA translation because it negatively regulated the expression of a CBX7-3′UTR-based reporter construct, and this regulation was dependent on 2 target sites located in the 3′UTR of the CBX7 gene. In fact, mutations in both these sites render the reporter construct insensitive to miR-181b expression.
The decrease in CBX7 protein level may account for an increased proliferation rate and, in particular, for the significant increase in the transition from G1 to S phase observed in miR-181b-treated cells. In fact, we previously demonstrated that the CBX7 protein is able to negatively regulate cell cycle progression, thereby leading to an increased number of cells in the G1 phase.29 However, it cannot be excluded that miR-181b is involved in the regulation of other genes that play a critical role in the control of cellular proliferation and neoplastic transformation. In fact, using prediction bioinformatic programs to identify potential miR-181b targets, we found 3 genes that are involved in the control of cell death, namely, PCDC4 (programmed cell death 4), BCL2L11 (BCL2-like 11), and BCLAF1 (BCL2-associated transcription factor 1). Experiments are underway in our laboratory to validate these targets.
Our finding that miR-181b expression was higher in CBX7-null MEFs than in wild-type MEFs suggests that CBX7 negatively controls miR-181b expression. This indicates a CBX7/miR-181b synergistic loop that leads to decreased CBX7 protein levels. Moreover, because HMGA1 negatively regulates CBX7 expression, we envisage a pathway in which HMGA1 overexpression directly down-regulates CBX7 and up-regulates miR-181b (Fig. 9F). This model is consistent with our finding of a direct correlation between HMGA1 and miR-181b expression, which results in a drastic reduction of CBX7 gene expression in human breast carcinomas probably due to HMGA1 overexpression, associated with impaired protein synthesis, which, in turn, depends on miR-181b induction that further increases miR-181b expression. In conclusion, taken together, our findings indicate that miR-181b is a critical effector of the HMGA1 oncogene in breast carcinogenesis.
Materials & Methods
Plasmids
pRcCMV/HMGA1b, pRcCMV/ha-HMGA1b, and pRcCMV/HMGA2 expression plasmids are described elsewhere.45,46 The PCDNA3.1/CBX7 expression plasmid is also described elsewhere.29
Cell Culture and Transfection Experiments
Breast carcinoma cell lines MDA-MB435s, MCF7, and T47D were obtained from the American Type Culture Collection (ATCC, Manassas, VA). Cells were maintained according to the manufacturer’s instructions. FRTL5, FRTL5-kiMSV, and FRTL5- KiMSV-HMGA1as cells and their culture conditions are reported elsewhere.10 MEFs were obtained from 12.5-day-old embryos. Cells were cultured at 37°C (5% CO2) in Dulbecco’s modified Eagle’s medium containing 10% (v/v) fetal bovine serum (FBS) supplemented with penicillin and streptomycin. For stable transfection experiments, MCF7 cells were transfected using FuGENE 6 (Roche Diagnostic Corporation, Indianapolis, IN), transfections were optimized for 6-well plates, and the cells were selected for neomycin resistance in medium containing G418 (800 µg/mL) and maintained in medium containing G418 (100 µg/mL). For transfection of Pre-miR miRNA molecules, the cells seeded in 6-well plates were transfected with 30 or 50 nmol/mL Pre-miR miRNA precursor molecules (Ambion, Austin, TX) using siPORT neoFX transfection agent (Ambion).
Protein Extraction, Western Blot Analysis, and Antibodies
Protein extraction and Western blotting procedures were carried out as reported previously.45 The antibodies used for Western blotting were as follows: anti-HMGA1 polyclonal antibodies raised against a synthetic peptide located in the NH2-terminal region of the HMGA1 proteins; antibody against CBX7 was from AbCAM (ab31765). Anti-α-tubulin (Santa Cruz Biotechnology, Santa Cruz, CA) was used to equalize the amount of proteins loaded. Bound antibodies were detected by appropriate secondary antibodies and revealed with the Amersham Biosciences Enhanced Chemiluminescence System (Piscataway, NJ).
miRNACHIP Microarray
Microarray experimental procedures were performed as previously described.47
RNA Isolation and Quantitative Reverse Transcription-PCR
Total RNA isolation and reverse transcription-PCR from cancer cell lines and human tissues were performed as previously described.29,48 Stem-loop quantitative reverse transcription-PCR (RT-PCR) for mature microRNA was carried out as instructed in the mirVANA qRT-PCR miRNA detection kit (Ambion). All PCR reactions were run in duplicate, and gene expression was calculated using the 2−ΔCt method.49 The primers used to analyze CBX7 expression by RT-PCR are reported elsewhere29; the primers used to analyze HMGA1b expression were as follows: forward HMGA1: 5′-CAACTCCAGGAAGGAAACCA-3′; reverse HMGA1: 5′-AGGACTCCTGCGAGATGC-3′.
Chromatin Immunoprecipitation Assay
After transfection, chromatin samples were processed for ChIP experiments as reported elsewhere.50 Samples were subjected to immunoprecipitation with the specific α-HMGA1 antibody. The sequences of the primers we used are reported in the Supplementary Materials and Methods, available online (http://ganc.sagepub.com/supplemental).
Biotin-Streptavidin Pull-Down Assay
Six oligonucleotides, containing biotin on the nucleotide at the 5′ position, were used in the pull-down assays. The sequences of these oligonucleotides and the experimental details are reported online in the Supplementary Materials and Methods.
Luciferase Reporter Assay
For luciferase reporter experiments, a CBX7-3′UTR segment of 836 bp was amplified by PCR from human genomic DNA and inserted into the PGL3-control vector (pLuc CBX7-3′UTR) with the simian virus 40 promoter (Promega, Madison, WI) by using the XbaI site immediately downstream from the luciferase stop codon. The primers used to generate the specific fragment and the experimental details to generate the pLuc CBX7-3′UTR DEL1 and pLuc CBX7-3′UTR DEL2 mutants are reported online in the Supplementary Materials and Methods.
Flow Cytometry
After trypsinization, cells were washed once in phosphate-buffered saline and fixed in 70% ethanol overnight. Staining for DNA content was performed with 2 µg/mL propidium iodide and 20 µg/mL RNase A for 30 minutes. We used a FACScan flow cytometer (Becton Dickinson, San Jose, CA) that was interfaced with a Hewlett-Packard computer (Palo Alto, CA). Cell cycle data were analyzed with the CELL-FIT program (Becton Dickinson).
Immunohistochemistry
Immunohistochemical analyses were performed as previously described.29
Supplementary Material
Acknowledgments
The authors thank the Associazione Partenopea per le Ricerche Oncologiche (APRO) for its support. They are grateful to Jean Ann Gilder for editing the text.
Footnotes
The authors declare no potential conflicts of interest with respect to the authorship and/or publication of this article.
This work was supported by grants from the Associazione Italiana Ricerca sul Cancro (AIRC) and the Ministero dell’Università e della Ricerca Scientifica e Tecnologica (MIUR). This work was also supported by the NOGEC-Naples Oncogenomic Center.
Supplementary material for this article is available on the Genes & Cancer Web site at http://ganc.sagepub.com/supplemental.
References
- 1. Johnson KR, Lehn DA, Reeves R. Alternative processing of mRNAs encoding mammalian chromosomal high-mobility-group proteins HMG-I and HMG-Y. Mol Cell Biol 1989;9(5):2114-23 [DOI] [PMC free article] [PubMed] [Google Scholar]
- 2. Nagpal S, Ghosn C, DiSepio D, Molina Y, Sutter M, Klein ES, et al. Retinoid-dependent recruitment of a histone H1 displacement activity by retinoic acid receptor. J Biol Chem 1999;274(32):22563-8 [DOI] [PubMed] [Google Scholar]
- 3. Chau KY, Patel UA, Lee KL, Lam HY, Crane-Robinson C. The gene for the human architectural transcription factor HMGI-C consists of five exons each coding for a distinct functional element. Nucleic Acids Res 1995;23(21):4262-6 [DOI] [PMC free article] [PubMed] [Google Scholar]
- 4. Ashar HR, Cherath L, Przybysz KM, Chada K. Genomic characterization of human HMGIC, a member of the accessory transcription factor family found at translocation breakpoints in lipomas. Genomics 1996;31(2):207-14 [DOI] [PubMed] [Google Scholar]
- 5. Reeves R, Nissen MS. The A.T-DNA-binding domain of mammalian high mobility group I chromosomal proteins: a novel peptide motif for recognizing DNA structure. J Biol Chem 1990;265(15):8573-82 [PubMed] [Google Scholar]
- 6. Thanos D, Du W, Maniatis T. The high mobility group protein HMG I(Y) is an essential structural component of a virus-inducible enhancer complex. Cold Spring Harb Symp Quant Biol 1993;58:73-81 [DOI] [PubMed] [Google Scholar]
- 7. Chiappetta G, Avantaggiato V, Visconti R, Fedele M, Battista S, Trapasso F, et al. High level expression of the HMGI (Y) gene during embryonic development. Oncogene 1996;13(11):2439-46 [PubMed] [Google Scholar]
- 8. Fusco A, Fedele M. Roles of HMGA proteins in cancer. Nat Rev Cancer 2007;7:899-910 [DOI] [PubMed] [Google Scholar]
- 9. Berlingieri MT, Manfioletti G, Santoro M, Bandiera A, Visconti R, Giancotti V, et al. Inhibition of HMGI-C protein synthesis suppresses retrovirally induced neoplastic transformation of rat thyroid cells. Mol Cell Biol 1995;15(3):1545-53 [DOI] [PMC free article] [PubMed] [Google Scholar] [Retracted]
- 10. Berlingieri MT, Pierantoni GM, Giancotti V, Santoro M, Fusco A. Thyroid cell transformation requires the expression of the HMGA1 proteins. Oncogene 2002;21(19):2971-80 [DOI] [PubMed] [Google Scholar]
- 11. Scala S, Portella G, Fedele M, Chiappetta G, Fusco A. Adenovirus-mediated suppression of HMGI(Y) protein synthesis as potential therapy of human malignant neoplasias. Proc Natl Acad Sci U S A 2000;97(8):4256-61 [DOI] [PMC free article] [PubMed] [Google Scholar]
- 12. Battista S, Fidanza V, Fedele M, Klein-Szanto AJ, Outwater E, Brunner H, et al. The expression of a truncated HMGI-C gene induces gigantism associated with lipomatosis. Cancer Res 1999;59(19):4793-7 [PubMed] [Google Scholar]
- 13. Arlotta P, Tai AK, Manfioletti G, Clifford C, Jay G, Ono SJ. Transgenic mice expressing a truncated form of the high mobility group I-C protein develop adiposity and an abnormally high prevalence of lipomas. J Biol Chem 2000;275(19):14394-400 [DOI] [PubMed] [Google Scholar]
- 14. Fedele M, Battista S, Kenyon L, Baldassarre G, Fidanza V, Klein-Szanto AJ, et al. Overexpression of the HMGA2 gene in transgenic mice leads to the onset of pituitary adenomas. Oncogene 2002;20:3190-8 [DOI] [PubMed] [Google Scholar]
- 15. Reeves R, Edberg DD, Li Y. Architectural transcription factor HMGI(Y) promotes tumor progression and mesenchymal transition of human epithelial cells. Mol Cell Biol 2001;21(2):575-94 [DOI] [PMC free article] [PubMed] [Google Scholar]
- 16. Wood LJ, Maher JF, Bunton TE, Resar LM. The oncogenic properties of the HMG-I gene family. Cancer Res 2000;60(15):4256-61 [PubMed] [Google Scholar]
- 17. Bartel DP. MicroRNAs: genomics, biogenesis, mechanism, and function. Cell 2000;116(2):281-97 [DOI] [PubMed] [Google Scholar]
- 18. John B, Enright AJ, Aravin A, Tuschl T, Sander C, Marks DS. Human microRNA targets. PLoS Biol 2005;3(7):e264. [DOI] [PMC free article] [PubMed] [Google Scholar]
- 19. Kiriakidou M, Nelson PT, Kouranov A, Fitziev P, Bouyioukos C, Mourelatos Z, et al. A combined computational-experimental approach predicts human microRNA targets. Genes Dev 2004;18(10):1165-78 [DOI] [PMC free article] [PubMed] [Google Scholar]
- 20. Lewis BP, Shih IH, Jones-Rhoades MW, Bartel DP, Burge CB. Prediction of mammalian microRNA targets. Cell 2003;115(7):787-98 [DOI] [PubMed] [Google Scholar]
- 21. Calin GA, Croce CM. MicroRNA signatures in human cancers. Nat Rev Cancer 2006;6(11):857-66 [DOI] [PubMed] [Google Scholar]
- 22. Cimmino A, Calin GA, Fabbri M, Iorio MV, Ferracin M, Shimizu M, et al. miR-15 and miR-16 induce apoptosis by targeting BCL2. Proc Natl Acad Sci U S A 2006;103(7):2464. [DOI] [PMC free article] [PubMed] [Google Scholar]
- 23. Voorhoeve PM, Le Sage C, Schrier M, Gillis AJ, Stoop H, Nagel R, et al. A genetic screen implicates miRNA-372 and miRNA-373 as oncogenes in testicular germ cell tumors. Cell 2006;124(6):1169-81 [DOI] [PubMed] [Google Scholar]
- 24. Meng F, Henson R, Wehbe-Janek H, Ghoshal K, Jacob ST, Patel T. MicroRNA-21 regulates expression of the PTEN tumor suppressor gene in human hepatocellular cancer. Gastroenterology 2007;133(2):647-58 [DOI] [PMC free article] [PubMed] [Google Scholar]
- 25. Pallante P, Visone R, Ferracin M, Ferraro A, Berlingieri MT, Troncone G, et al. MicroRNA deregulation in human thyroid papillary carcinomas. Endocr Relat Cancer 2006;13(2):497-508 [DOI] [PubMed] [Google Scholar]
- 26. Visone R, Russo L, Pallante P, De Martino I, Ferraro A, Leone V, et al. MicroRNAs (miR)-221 and miR-222, both overexpressed in human thyroid papillary carcinomas, regulate p27Kip1 protein levels and cell cycle. Endocr Relat Cancer 2007;14(3):791-8 [DOI] [PubMed] [Google Scholar]
- 27. Galardi S, Mercatelli N, Giorda E, Massalini S, Frajese GV, Ciafrè SA, et al. miR-221 and miR-222 expression affects the proliferation potential of human prostate carcinoma cell lines by targeting p27Kip1. J Biol Chem 2007;282(32):23716-24 [DOI] [PubMed] [Google Scholar]
- 28. Baldassarre G, Battista S, Belletti B, Thakur S, Pentimalli F, Trapasso F, et al. Negative regulation of BRCA1 gene expression by HMGA1 proteins accounts for the reduced BRCA1 protein levels in sporadic breast carcinoma. Mol Cell Biol 2003;23(7):2225-38 [DOI] [PMC free article] [PubMed] [Google Scholar]
- 29. Pallante P, Federico A, Berlingieri MT, Bianco M, Ferraro A, Forzati F, et al. Loss of the CBX7 gene expression correlates with a highly malignant phenotype in thyroid cancer. Cancer Res 2008;68(16):6770-8 [DOI] [PubMed] [Google Scholar]
- 30. Pekarsky Y, Santanam U, Cimmino A, Palamarchuk A, Efanov A, Maximov V, et al. Tcl1 expression in chronic lymphocytic leukemia is regulated by miR-29 and miR-181. Cancer Res 2006;66:11590-3 [DOI] [PubMed] [Google Scholar]
- 31. Nakajima G, Hayashi K, Xi Y, Kudo K, Uchida K, Takasaki K, et al. Non-coding microRNAs hsa-let-7g and hsa-miR-181b are associated with chemoresponse to S-1 in colon cancer. Cancer Genomics Proteomics 2006;3(5):317-24 [PMC free article] [PubMed] [Google Scholar]
- 32. Cervigne NK, Reis PP, Machado J, Sadikovic B, Bradley G, Galloni NN, et al. Identification of a microRNA signature associated with progression of leukoplakia to oral carcinoma. Hum Mol Genet 2009;18(24):4818-29 [DOI] [PubMed] [Google Scholar]
- 33. Wang B, Hsu SH, Majumder S, Kutay H, Huang W, Jacob ST, Ghoshal K. TGFbeta-mediated upregulation of hepatic miR-181b promotes hepatocarcinogenesis by targeting TIMP3. Oncogene 2009. December 21 Epub ahead of print [DOI] [PMC free article] [PubMed] [Google Scholar]
- 34. Chiappetta G, Botti G, Monaco M, Pasquinelli R, Pentimalli F, Di Bonito M, et al. HMGA1 protein overexpression in human breast carcinomas: correlation with ErbB2 expression. Clin Cancer Res 2004;10(22):7637-44 [DOI] [PubMed] [Google Scholar]
- 35. Federico A, Pallante P, Bianco M, Ferraro A, Esposito F, Monti M, et al. Chromobox protein homologue 7 protein, with decreased expression in human carcinomas, positively regulates E-cadherin expression by interacting with the histone deacetylase 2 protein. Cancer Res 2009;69:7079-87 [DOI] [PubMed] [Google Scholar]
- 36. Bagga R, Michalowski S, Sabnis R, Griffith JD, Emerson BM. HMG I/Y regulates long-range enhancer-dependent transcription on DNA and chromatin by changes in DNA topology. Nucleic Acids Res 2000;28(13):2541-50 [DOI] [PMC free article] [PubMed] [Google Scholar]
- 37. Reeves R. Molecular biology of HMGA proteins: hubs of nuclear function. Gene 2001;277(1-2):63-81 [DOI] [PubMed] [Google Scholar]
- 38. Fedele M, Battista S, Manfioletti G, Croce CM, Giancotti V, Fusco A. Role of the high mobility group A proteins in human lipomas. Carcinogenesis 2001;22(10):1583-91 [DOI] [PubMed] [Google Scholar]
- 39. Cleynen I, Van de Ven WJ. The HMGA proteins: a myriad of functions. Int J Oncol 2008;32(2):289-305 [PubMed] [Google Scholar]
- 40. Fedele M, Pentimalli F, Baldassarre G, Battista S, Klein-Szanto AJP, Kenyon L, et al. Transgenic mice overexpressing the wild-type form of the HMGA1 gene develop mixed growth hormone/prolactin cell pituitary adenomas and natural killer cell lymphomas. Oncogene 2005;24(21):3427-35 [DOI] [PubMed] [Google Scholar]
- 41. Liu WM, Guerra-Vladusic FK, Kurakata S, Lupu R, Kohwi-Shigematsu T. HMG-I(Y) recognizes base-unpairing regions of matrix attachment sequences and its increased expression is directly linked to metastatic breast cancer phenotype. Cancer Res 1999;59(22):5695-703 [PubMed] [Google Scholar]
- 42. Volinia S, Calin GA, Liu CG, Ambs S, Cimmino A, Petrocca F, et al. A microRNA expression signature of human solid tumors defines cancer gene targets. Proc Natl Acad Sci U S A 2006;103(7):2257-61 [DOI] [PMC free article] [PubMed] [Google Scholar]
- 43. Zhang H, Su SB, Zhou QM, Lu YY. Differential expression profiles of microRNAs between breast cancer cells and mammary epithelial cells. Chin J Cancer 2009;28(5):493-9 [PubMed] [Google Scholar]
- 44. Qi J, Yu JY, Shcherbata HR, Mathieu J, Wang AJ, Seal S, et al. MicroRNAs regulate human embryonic stem cell division. Cell Cycle 2009;8(22):3729-41 [DOI] [PMC free article] [PubMed] [Google Scholar]
- 45. Fedele M, Pierantoni GM, Berlingieri MT, Battista S, Baldassarre G, Munshi N, et al. Overexpression of proteins HMGA1 induces cell cycle deregulation and apoptosis in normal rat thyroid cells. Cancer Res 2001;61(11):4583-90 [PubMed] [Google Scholar]
- 46. Fedele M, Berlingieri MT, Scala S, Chiariotti L, Viglietto G, Rippel V, et al. Truncated and chimeric HMGI-C genes induce neoplastic transformation of NIH3T3 murine fibroblasts. Oncogene 1998;17(4):413-8 [DOI] [PubMed] [Google Scholar]
- 47. Liu CG, Calin GA, Meloon B, Gamliel N, Sevignani C, Ferracin M, et al. An oligonucleotide microchip for genome-wide microRNA profiling in human and mouse tissues. Proc Natl Acad Sci U S A 2004;101(26):9740-4 [DOI] [PMC free article] [PubMed] [Google Scholar]
- 48. Fedele M, Fidanza V, Battista S, Pentimalli F, Klein-Szanto AJP, Visone R, et al. Haploinsufficiency of the Hmga1 gene causes cardiac hypertrophy and myelo-lymphoproliferative disorders in mice. Cancer Res 2006;66(5):2536-43 [DOI] [PubMed] [Google Scholar]
- 49. Livak KJ, Schmittgen TD. Analysis of relative gene expression data using real-time quantitative PCR and the 2(-Delta Delta C(T)) method. Methods 2001;25:402-8 [DOI] [PubMed] [Google Scholar]
- 50. Pierantoni GM, Rinaldo C, Esposito F, Mottolese M, Soddu S, Fusco A. High mobility group A1 (HMGA1) proteins interact with p53 and inhibit its apoptotic activity. Cell Death Differ 2006;13(9):1554-63 [DOI] [PubMed] [Google Scholar]
Associated Data
This section collects any data citations, data availability statements, or supplementary materials included in this article.