

Abstract
We show protein kinase C–zeta (PKC-ζ) to be a novel predictive biomarker for survival from prostate cancer (P < 0.001). We also confirm that transcription of the PRKC-ζ gene is crucial to the malignant phenotype of human prostate cancer. Following siRNA silencing of PRKC-ζ in PC3-M prostate cancer cells, stable transfectant cell line si-PRKC-ζ-PC3-MT1-6 is phenotypically nonmalignant in vitro and in vivo. Genome-wide expression analysis identified 373 genes to be differentially expressed in the knockdown cells and 4 key gene networks to be significantly perturbed during phenotype modulation. Functional interconnection between some of the modulated genes is revealed, although these may be within different regulatory pathways, emphasizing the complexity of their mutual interdependence. Genes with altered expression following PRKC-ζ knockdown include HSPB1, RAD51, and ID1 that we have previously described to be critical in prostatic malignancy. Because expression of PRKC-ζ is functionally involved in promoting the malignant phenotype, we propose PKC-ζ as a novel and biologically relevant target for therapeutic intervention in prostate cancer.
Keywords: prostate cancer, PRKC-ζ, siRNA
Introduction
Prostate cancer is the second most common cancer to affect men worldwide. In the United States, in 2008, 186,320 new cases of prostate cancer and 28,660 deaths from this disease were reported.1 Equivalent figures from the United Kingdom reveal that in 2006, 35,515 new cases were diagnosed and that 10,239 men died of this disease in 2007.2 Unlike some human malignancies, prostate cancer is not associated with a specific high-penetrance susceptibility gene3 but with multiple gene loci,4,5 each independently conferring a low but cumulative risk. The clinical potential of an individual prostate cancer may range from relative indolence to highly aggressive with progression occurring rapidly. Hence, there is an urgent requirement to develop reliable biomarkers that accurately stratify prostate cancer at diagnosis and segregate men with aggressive cancers requiring urgent treatment from those who may be managed conservatively.6 Although the extent of disease is more useful than clinical stage at diagnosis and retains a low level of significance in multivariate analysis, neither parameter is of clinical utility, being significantly inferior to Gleason score or PSA (prostate-specific antigen).7
A potential functional relationship between protein kinase C–zeta (PKC-ζ), encoded by the gene PRKCZ located on chromosome 1 at p36.33-p36.2, and prostate cancer was first suggested by our study that showed PKC-ζ expression to be enhanced in prostatic malignancy when compared to morphologically nonmalignant prostatic epithelium.8 These findings were subsequently validated by other studies in cancers of breast,9 lung,10,11 and pancreas.12,13 Reduction in PKC-ζ inhibits cell migration and invasion, confirming the protein to be functionally important to the malignant phenotype.10,11 Although our original data suggested that strong PKC-ζ expression might identify a subset of aggressive prostate cancers, the cohort was too small to provide reliable statistics. This study has now assessed PKC-ζ expression in the largest group of well-characterized and conservatively managed patients yet assembled worldwide.7
Protein kinase C (PKC) isoenzymes together comprise a complex superfamily of 14 serine-threonine kinases characterized by structural similarities in certain gene elements and functional peptide domains.14 Broadly considered as regulators of cellular homeostasis and behavioral phenotype, these enzymes are increasingly identified to be polyfunctional. The genes for all of these enzymes characteristically encode multiple splice variants that are differentially expressed between tissues in a wide range of animal species during tissue morphogenesis,15 especially between malignant tissues and their benign histogenic counterparts.8,12 Different PKC isoforms exhibit opposing cell regulatory actions.16,17 Preliminary studies in prostate cancer demonstrated expression of only the common isoform (NM_002774) of PRKC-ζ in PC3-M cells (S. Yao, A. Bee, C. Beesley, et al., unpublished data, 2010), being the sole isoform of this enzyme described in human nonmalignant epithelial cells.18
Examples of genes selectively modulated in prostate cancer are now relatively frequent.19 Some of these, either up- or down-regulated, have been proposed as robust biomarkers able to segregate different cancer phenotypes according to parameters that include behavior and response to therapy.20 Although altered expression does not confirm, ipso facto, a functional role in malignancy, genes that we have demonstrated to be functionally relevant to the aggressive phenotype of prostate cancer include cFABP,21 RPL19,22 ID1,23 RAD51,24 and HSPB1.25 Studies reported from this laboratory26 and elsewhere27,28 have also established a functional relationship between PKC-ζ voltage-gated ion channels16 and the invasive phenotype of prostate cancer cells.29 Similarly, the behavior of malignant cells is influenced by expression of cell surface complex glycoconjugates, particularly sialic acids.30,31 Therefore, the objectives of this study were (1) to confirm the predictive biomarker potential of PKC-ζ protein expression in a large cohort of untreated human prostate cancers, (2) to test the hypothesis that translation and expression of PRKC-ζ is functionally important in promoting and/or maintaining the aggressive phenotype of prostate cancer and hence a potential drug target, and (3) to elucidate the genes and their associated networks modulated by PRKC-ζ.
Results
PKC-ζ protein expression in prostate tissues and clinical correlations
Information on PKC-ζ staining intensity was available for 2879 cores from 783 patients. Morphological appearances of the distribution of cytoplasmic PKC-ζ expression ranged from benign through malignant (Figure 1). For the 667 patients with positive staining (i.e., ≥1), their demographics and tumor characteristics are presented in Table 1. Figure 2 A and B shows the distribution of PKC-ζ staining and intensity in the 901 morphologically unremarkable cores (10%), 798 hyperplasic cores (36%), 38 PIN cores (76%), and 1142 cancer cores (90%) analyzed in the arrays. The relationship of PKC-ζ expression (binary variables: staining intensity ≤ 2 and = 3) with demographics and tumor characteristics is presented in Table 2. At both levels, PKC-ζ expression was associated with Gleason score (P < 0.001), clinical stage (P < 0.001), and amount of cancer in each specimen (P < 0.001). No association was found with age or baseline PSA. At high intensity (i.e., = 3+), expression of PKC-ζ was associated with worse survival from prostate cancer (Figure 2C) and poor overall survival (Figure 2D). Univariate Cox model analysis (Table 2) revealed PKC-ζ expression to be a significant prognostic factor of cause-specific survival (χ2 = 20.53, P < 0.001) and overall survival (χ2 = 8.54, P = 0.002). However, when added to a model with Gleason score, PKC-ζ expression became a weakly significant prognostic factor for cause-specific survival (hazards ratio [HR] = 1.44, 95% confidence interval [CI] = 1.00-2.07, P = 0.05). Similarly, when added to a multivariate model comprising Gleason score, extent of disease, baseline PSA, and age at diagnosis, PKC-ζ expression was of borderline significance (HR = 1.41, 95% CI = 0.98-2.02, P = 0.06). In each multivariate of these models, there was no association with overall survival. We conclude from these analyses that PKC-ζ expression is highly correlated with existing prognostic markers, including Gleason score and clinical stage, but does not alone represent an independent prognostic marker. However, within poor-prognosis prostate cancers, it might define a phenotypic subset amenable to therapeutic manipulation of PRKC-ζ.
Figure 1.
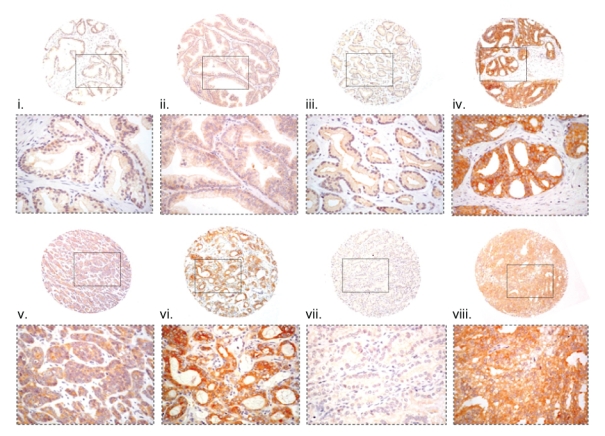
Immunohistochemical expression of PKC-ζ in tissue microarray cores of prostatic tissues. Location of the high magnification regions shown below each of the cores is indicated by a corresponding rectangular field. Stromal expression was not identified in any of the malignant tissues examined. No expression of PKC-ζ was identified in the nuclei, although the amounts may be below the level of immunohistochemical detection. (i, ii, iii) Normal, hyperplastic, and mildly dysplastic prostatic tissue in which neither luminal nor basal epithelial cells express PKC-ζ either within the cytoplasm or in the nuclei. (iv) Dysplastic intraglandular epithelium of cribriforming type strongly expressing PKC-ζ within the cytoplasm. (v) Moderately differentiated prostatic adenocarcinoma (Gleason 3+3) weakly expressing PKC-ζ in the majority of malignant cells. (vi) Prostatic adenocarcinoma of pseudoglandular morphology (Gleason 4+3) strongly expressing PKC-ζ throughout the cytoplasm of all malignant cells. (vii) Moderately differentiated prostatic adenocarcinoma (Gleason 3+3) morphologically similar to that in (v) but negative for PKC-ζ expression. (viii) Poorly differentiated prostatic adenocarcinoma (Gleason 5+5) strongly expressing PKC-ζ in the cytoplasm of the majority of the malignant cells. Magnification: All cores are magnified at x60. The detailed fields within each of the cores are magnified at x200.
Table 1.
Tumor Characteristics and Demographics for the 667 Patients with a PKC-ζ Staining Intensity
| Variable | |
|---|---|
| Median age, years (range) | 70 (49-76) |
| Classes of age, years, n (%) | |
| ≤65 | 87 (17.6) |
| >65-70 | 145 (29.4) |
| >70-73 | 123 (24.9) |
| >73-76 | 138 (28.0) |
| Median follow-up, months (range) | 98 (2-196) |
| Early hormone management, n (%) | 120 (24.3) |
| Gleason score (%) | |
| 4 | 1 (0.2) |
| 5 | 13 (2.6) |
| 6 | 172 (34.9) |
| 7 | 153 (31.0) |
| 8 | 73 (14.8) |
| 9 | 72 (14.6) |
| 10 | 9 (1.8) |
| Clinical stage, n (%) | |
| T1 | 120 (24.3) |
| T2 | 119 (24.1) |
| T3 | 70 (14.2) |
| Unknown | 184 (37.3) |
| Baseline prostate-specific antigen, n (%) | |
| ≤4 | 142 (28.8) |
| >4-10 | 93 (18.9) |
| >10-25 | 106 (21.5) |
| >25-50 | 94 (19.1) |
| >50-100 | 58 (11.8) |
| Cancer in biopsy, n (%) | |
| ≤6 | 86 (17.4) |
| >6-20 | 121 (24.5) |
| >20-40 | 66 (13.4) |
| >40-75 | 85 (17.2) |
| >75-100 | 128 (26.0) |
| Unknown | 7 (1.4) |
Figure 2.
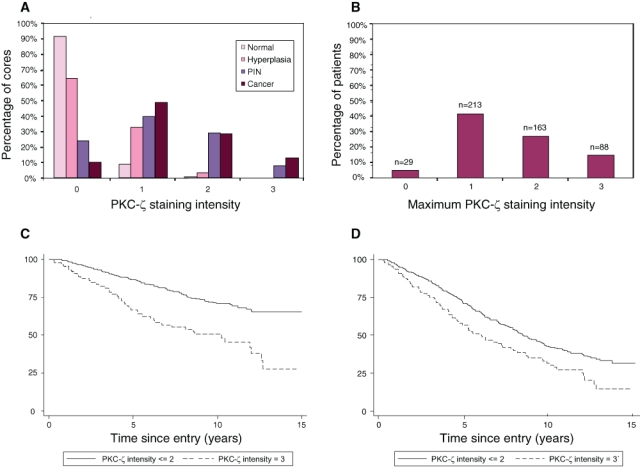
Analysis of PKC-ζ expression with respect to tissue distribution and effect of PKC-ζ on clinical outcome. (A) PKC-ζ expression assessed between normal, hyperplasic, PIN, and cancer cores. Information on PKC-ζ staining intensity was available for 2879 cores (783 patients). The figure presents the distribution of PKC-ζ staining intensity in the 901 normal cores, 798 hyperplasic cores, 38 PIN cores, and 1142 cancer cores. (B) The maximum staining intensity in the 1142 cancer cores was subsequently calculated for each patient. The distribution of this variable is shown in the histogram. (C) Clinical outcome of patients with respect to death from prostate cancer (P < 0.001) according to intensity of PKC-ζ expression (≤ 2 vs. = 3). (D) Clinical outcome of patients with respect to death from all causes (P < 0.002) according to intensity of PKC-ζ expression (≤ 2 vs. = 3).
Table 2.
Relative Risk of Prostate Cancer Progression According to PKC-ζ Expression
| Prostate Cancer Survival | Overall Survival | |||
|---|---|---|---|---|
| Univariate Analyses | HR | 95% CI | HR | 95% CI |
| PKC-ζ staining intensity | ||||
| ≤ 2 | 1a | 1a | ||
| = 3 | 2.4 | 1.68-3.41 | 1.52 | 1.16-1.98 |
| χ2 = 20.53 | χ2 = 8.54 | |||
| Prostate Cancer Survival | Overall Survival | |||
| Multivariate Analyses | χ2 | Δχ2 | χ2 | Δχ2 |
| Gleason model | χ2(1) = 112.30 | — | χ2(1) = 62.91 | — |
| With PKC-ζ staining intensity | ||||
| ≤ 2 vs. = 3 | χ2(2) = 116.08 | 3.78 | χ2(2) = 63.84 | 0.93 |
| Gleason, extent of disease, PSA, and age model | χ2(4) = 143.38 | — | χ2(4) = 96.30 | — |
| With PKC-ζ staining intensity | ||||
| ≤ 2 vs. = 3 | χ2 (5) = 146.71 | 3.33 | χ2(5) = 96.67 | 0.37 |
HR, hazards ratio; CI, confidence interval; PSA, prostate-specific antigen.
Reference category.
PKC-ζ protein and mRNA expression in cell lines in vitro
Western blotting cell line extracts with monoclonal antibody sc-216 identified only a single band at 67 kD corresponding to the PKC-ζ protein encoded by PRKC-ζ (NM_002774) and most strongly expressed in PC3-M cells (Figure 3A) that were thereafter selected as our model system. Quantitative real-time PCR (qRT-PCR; Figure 3B) revealed PRKC-ζ mRNA expression in PC3-M (androgen-independent) cells at ~5-fold (P < 0.01), DU145 at ~5-fold (P < 0.01), and LNCaP (androgen-dependent) at ~3-fold (P < 0.01) higher than that in PNT-2 cells (Figure 3C). We used PRKC-ζ siRNA expressed in pSilencer™ 4.1-CMVneo (Ambion, Warrington, UK) to create 9 PC3-M transfectant cloned cell lines (si-PRKC-ζ-PC3-MT1-1–T1-6 and si-PRKC-ζ-PC3-MT2-1–T2-3). All 9 clones displayed a significant loss of substrate adhesion when compared to untransfected parental PC3-M cells. The transfected cells appeared disparate and nonadhesive and contained multinucleate forms easily identifiable microscopically (Figure 3D), suggesting failure to complete mitosis. Western blotting (Figure 3 E and F) confirmed significant loss of PKC-ζ protein in the si-PRKC-ζ-PC3-MT1-6 knockdown cells relative to si-PC3-Mscramble (P < 0.001), whereas this protein continued to be expressed at high levels in the parental PC3-M cells, in DU145 cells, and in the FABP5 and RPL-19 knockdowns, further confirming specificity of the si-PRKC-ζ knockdown. Analysis of mRNA (Figure 3G) also demonstrated the most consistent effective reduction in colony si-PRKC-ζ-PC3-MT1-6, in which PRKC-ζ was reduced to 37% ± 17% of the si-PC3-Mscramble cells relative to β-actin (P < 0.005). Other cell lines exhibited less reduction, ranging from 43% ± 4% to 54% ± 8% (P < 0.01), or were less consistent in their level of gene knockdown. Cells transfected with empty vector and si-PC3-Mscramble cells exhibited no significant reduction in their level of PRKC-ζ mRNA (P > 0.5).
Figure 3.
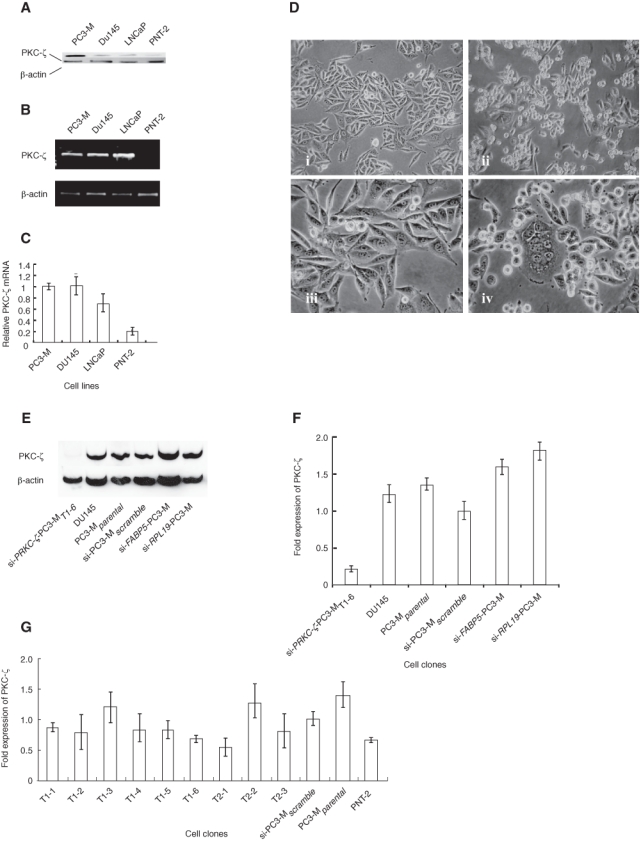
Expression of PRKC-ζ in prostate cell lines and following RNAi. (A) Western blotting the parental cell lines confirmed high expression of PKC-ζ in PC3-M cells and virtually undetectable levels in the nonmalignant PNT-2 cell line. Detection of β-actin protein was used as the standard. (B, C) Northern blot comparison of PRKC-ζ mRNA expression in 4 prostate cell lines following standard 2-step RT-PCR using PC3-M cells as the standard for expression and β-actin as the reference gene. (D) Following stable knockdown of PRKC-ζ using vector-based si-RNA, altered cell morphologies were observed in the subsequent cell clones. Comparison of the low power views of the parental (i) and si-PRKC-ζ-PC3-MT1-6 cells (ii) revealed significant loss of adhesion by the genetically modified cells. On high power, whereas the original (iii) cells were unicellular and compact, the transfected cells (iv) were disparate and nonadhesive and contained many multinucleate forms. (E, F) Western blotting confirmed significant loss of PKC-ζ protein in the si-PRKC-ζ-PC3-MT1-6 knockdown cells relative to si-PC3-Mscramble (P < 0.001), whereas this protein continued to be expressed at high levels in the parental PC3-M cells, DU145 cells, and si-FABP5 and si-RPL-19 knockdowns. (G) Using qPCR, reduced gene expression was confirmed in all 9 cloned knockdown cell lines when compared to the parental cells. In all studies, the data shown are the mean (± SD) of 3 biological replicate experiments. The level of gene expression in the si-PC3-Mscramble cells is set at unity.
Growth characteristics of si-PRKC-ζ-PC3-MT1-6 cells in vitro
Proliferation assay revealed the rate of cell division by the si-PRKC-ζ-PC3-MT1-6 cells was significantly reduced (P < 0.05) when compared to PC3-Mparental and si-PC3-Mscramble (Figure 4A). The levels of endogenous apoptosis, quantified by flow cytometry, within the parental and control cells were similar to those obtained during comparable studies of the RPL19 gene (A. Bee, B. Lane, E. Hunter, et al., unpublished data, 2010). In the transfectants, apoptosis was marginally increased (P < 0.05) in the si-PRKC-ζ-PC3-MT1-6 cells (Figure 4B) but was not significantly affected in the si-PRKC-ζ-PC3-MT1-2 cells (P > 0.05). In the soft agar tumorigenesis assays (Figure 4C), cell colonies formed after 3 weeks. PNT-2 cells yielded no colonies, whereas PC3-Mparental cells and all transfectant cells formed colonies (Figure 4D). Whereas PC3-Mparental cells generated 499 ± 22 colonies and si-PC3-Mscramble cells generated 541 ± 10 colonies, the si-PRKC-ζ-PC3-MT1-6 cells generated 120 ± 11 colonies (P < 0.005). In the Matrigel invasion assay, all knockdown cell lines revealed reduced cell migration (P < 0.01) when compared to the PC3-Mparental cells (1775 ± 65 cells). The si-PRKC-ζ-PC3-MT1-1 cells scored 106 ± 26 cells migrating, whereas si-PRKC-ζ-PC3-MT1-2 cells scored 129 ± 26 cells (Figure 4 E and F). Thus, the effect of selectively inhibiting PRKC-ζ was to severely reduce the ability of all transfected cells to invade a semisolid collagenous stroma.
Figure 4.
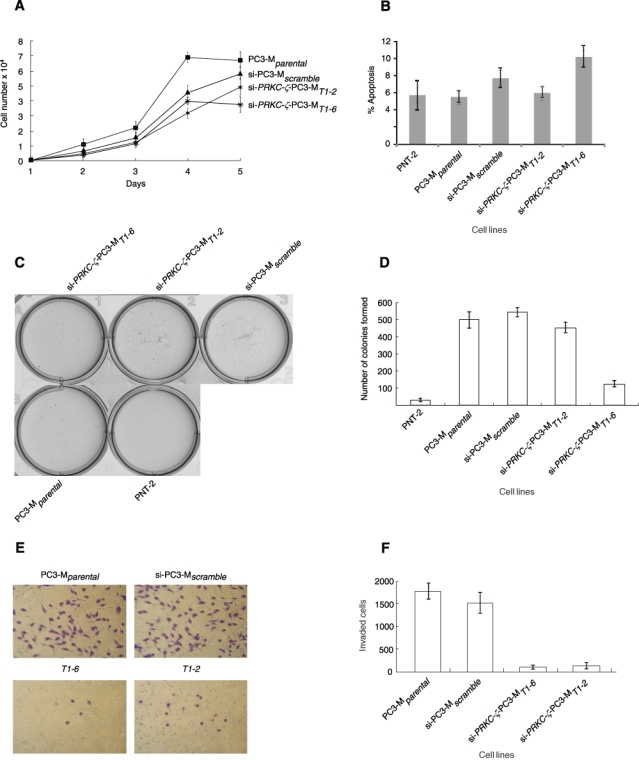
Growth and migration of cells in vitro. (A) Comparison of cell proliferation in monolayer cultures. PRKC-ζ gene knockdown reduced proliferation of the si-PRKC-ζ-PC3-MT1-6 cells relative to si-PC3-Mscramble (P < 0.05). The effect of transfecting scrambled RNA was not statistically significant. (B) Apoptosis was marginally enhanced in the knockdown si-PRKC-ζ-PC3-MT1-6 cells when compared to si-PC3-Mscramble and to comparator clone si-PRKC-ζ-PC3-MT1-2. (C, D) Down-regulation of PRKC-ζ gene expression impaired the ability of cells to form colonies in soft agar. Cells from clones T1-6 and T1-2, si-PC3-Mscramble control, PC3-Mparental, and PNT-2 were cultured 5 days. Measurements were taken each day. Significant differences were found between different cell clones, with the most pronounced down-regulation of colony formation occurring in the si-PRKC-ζ-PC3-MT1-6 cells relative to si-PC3-Mscramble (P < 0.001). Quantitative assessment of tumorigenesis of different clones was determined by counting the number of colonies. (E, F) RNAi-induced down-regulation of PRKC-ζ impaired the ability of PC3-M transfectant cells to migrate in a Matrigel invasion assay. After 5 days in culture, invasion probabilities in the gene knockdown clones T1-2 and T1-6 were calculated as the ratio of number of cells invading through the Matrigel insert membrane relative to the mean number of si-PC3-Mscramble cells (P < 0.001). The data shown are the mean (± SD) of 3 biological replicate experiments.
Tumorigenic behavior of si-PRKC-ζ-PC3-MT1-6 cells in vivo
Statistically significant reductions in tumor volume and weight occurred for PRKC-ζ-PC3-MT1-6 cells. Comparison of mean tumor volumes (Figure 5A) revealed the following: PC3-Mparental (272 ± 213 mm3), si-PC3-Mscramble (81 ± 70 mm3), si-PRKC-ζ-PC3-MT1-2 (9 ± 8 mm3), and si-PRKC-ζ-PC3-MT1-6 (36 ± 38 mm3). Significant differences were observed between the si-PRKC-ζ-PC3-MT1-6 cells and the si-PC3-Mscramble group (P < 0.005, Mann-Whitney U test). At autopsy (Figure 5B), the average tumor weight generated by PC3-Mparental cells (337 ± 249 mg) was 4.7-fold and 21-fold, respectively, higher than that of siRNA transfectant cells si-PRKC-ζ-PC3-MT1-2 (16 ± 11 mg) and si-PRKC-ζ-PC3-MT1-6 (71 ± 80 mg). The mean tumor weight generated by si-PC3-Mscramble cells was 7.5-fold higher than that in the group si-PRKC-ζ-PC3-MT1-2 (P < 0.005) and in si-PRKC-ζ-PC3-MT1-6, although no significant difference was observed between si-PC3-Mscramble and si-PRKC-ζ-PC3-MT1-6. However, the trend in tumor weight between the parental groups and the transfectant gene knockdown groups decreased dramatically (Figure 5C). Although the mean weight of the si-PRKC-ζ-PC3-MT1-6 tumors was higher than that in the si-PRKC-ζ-PC3-MT1-2 group, the difference was not significant.
Figure 5.
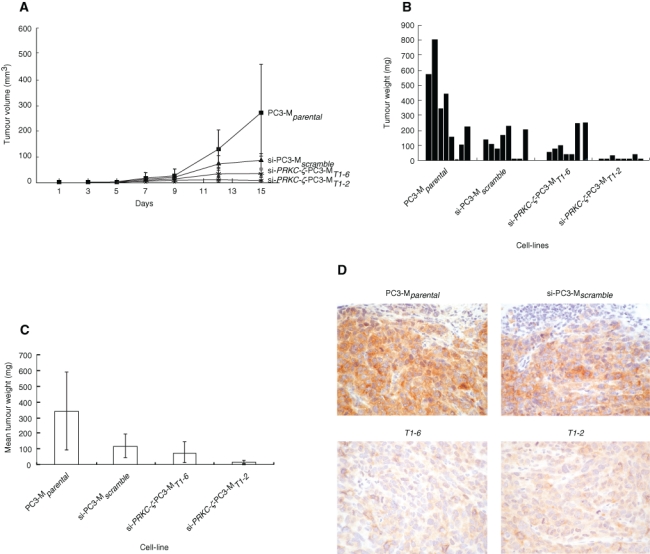
Growth of cells in vivo. (A) Inoculation of 2 × 10⁶ cells was performed subcutaneously into the shoulder fat pad of each animal in 4 groups of 8 male immunocompromised CD/1 nude mice. The groups comprised the transfectant clones si-PRKC-ζ-PC3-MT1-6 and si-PRKC-ζ-PC3-MT1-2, PC3-Mparental, and si-PC3-Mscramble cells. Tumor size was measured every 3 days for 15 days after the inoculation. Tumor volumes were calculated using the formula V = L × H × W × 0.5237. The data are the mean tumor volumes (± SD) of 8 animals in each group. The difference between the size of the PC3-Mparental cells and the si-PRKC-ζ-PC3-MT1-6 knockdown cells was significant (P < 0.005). (B, C) The histogram shows the occurrence and weight of tumor present in each animal on day 15 when all animals were sacrificed. When the data in each group were combined, the histogram shows the mean tumor volume (± SD) of the 8 animals in each group. (D) Immunohistochemistry of the tumor xenografts revealed strong expression of PKC-ζ protein in the PC3-Mparental and si-PC3-Mscramble cells. However, knockdown cell lines si-PRKC-ζ-PC3-MT1-6 and si-PRKC-ζ-PC3-MT1-2 exhibited comparatively little staining, indicating continued suppression of the PRKCZ gene in the majority of the tumor cells.
PKC-ζ protein expression in cell lines in vivo
Immunohistochemistry of tumor xenografts revealed only the human cells to exhibit staining. Strong expression of PKC-ζ protein was detected in both the PC3-Mparental and si-PC3-Mscramble cells (Figure 5D). However, knockdown cell lines si-PRKC-ζ-PC3-MT1-2 and si-PRKC-ζ-PC3-MT1-6 exhibited comparatively little staining, indicating continued suppression of the PRKCZ gene in the majority of the tumor cells. Detection of small amounts of PKC-ζ in some tumor cells is considered to represent clonal variation resulting from continued low-level expression of the gene rather than its total inhibition, as identified by qPCR of the cells in vitro (Figure 3).
Hsp-27 expression and phosphorylation status
Western blotting confirmed the level of Hsp-27 expression identified by the generic antibody to be lower in the PNT-2 cells than in the PC3-Mparental, si-PC3-Mscramble, and the si-PRKC-ζ-PC3-MT1-6 lines, where expression was comparable (Figure 6A). Although no differences were apparent in the site-specific phosphorylation of PC3-Mparental and si-PC3-Mscramble, phosphorylation of Ser82 was significantly enhanced in the si-PRKC-ζ-PC3-MT1-6 cells. Phosphorylation at Ser15 and Ser78 was similarly low in PC3-Mparental and si-PC3-Mscramble when compared to the benign PNT-2. Thus, unlike the effect of knocking down the genes FABP5 or RPL19, reducing PRKC-ζ expression did not alter the overall level of Hsp-27 protein but selectively increased Hsp-27 phosphorylation at Ser82, although not at Ser15 or Ser78.
Figure 6.
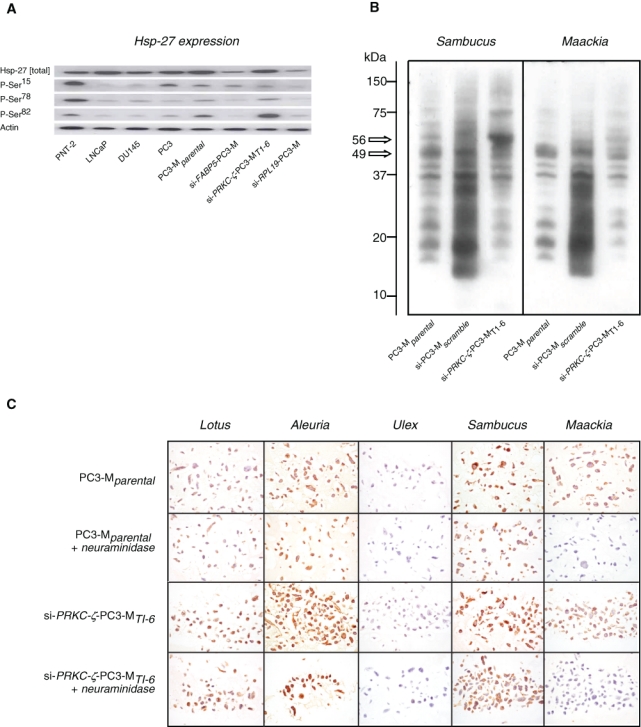
Effect of PRKC-ζ knockdown on Hsp-27 and glycoconjugate expression. (A) Western blotting of Hsp-27 protein and of phosphorylation-specific sites P-Ser15, P-Ser78, and P-Ser82 following si-RNA reduction of PRKC-ζ in the si-PRKC-ζ-PC3-MT1-6 cells did not affect expression of the generic protein, although this was reduced in comparable experiments to knock down genes FABP5 and RPL19. Conversely, phosphorylation of P-Ser82 was specifically enhanced when compared to the PC3 and PC3-Mparental cells and to the FABP5 and RPL19 knockdown cells. (B) Western blotting using Sambucus nigra and Maackia amurensis revealed differences in sialylated glycoproteins expressed by the si-RPKC-ζ-PC3-MT1-6 cells when compared to the PC3-Mparental and si-PC3-Mscramble cells, confirming specificity of the role of the gene PRKC-ζ in modulating expression of the proteins, or the level of their sialylation, at 56 kD and 49 kD. (C) Parental cell line PC3-M and gene knockdown cell line si-PRKC-ζ-PC3-MT1-6 expressed terminal fucose residues identified by Lotus and Aleuria lectins but not by Ulex. The latter was not affected by removal of sialic acid residues using neuraminidase. Sialic acid–linked 2→3Gal- and 2→6Gal- were identified using the lectins from S. nigra and M. amurensis, respectively. These were differentially expressed by the parental and knockdown cell lines because staining by Maackia was abrogated by neuraminidase. However, no global difference in expression of these glycoconjugates was identified following PRKC-ζ knockdown.
Glycoconjugate expression
Western blotting to detect sialylated glycoproteins revealed subtle differences in binding patterns between the parental and knockdown cells, particularly gain of Neu5Acα2,6Gal- structures identified by Sambucus (Figure 6B), indicating significant changes to specific proteins. These might be caused by modulated levels of individual proteins or changes in the structure of their oligosaccharides consequent upon alterations to the level of certain glycosyltransferases. Intact PC3-Mparental and si-PRKC-ζ-PC3-MT1-6 cells expressed identical patterns of complex oligosaccharides identified by the 5 lectins (Table 3). The expression of sialic acids linked either by Neu5Acα2,6Gal- (Sambucus) or Neu5Acα2,3Gal- (Maackia) was confirmed following neuraminidase digestion of the intact cell preparations but revealed no gross differences (Figure 6C). The biotinylated lectins from Ulex europaeus, Lotus tetragonolobus, and Aleuria aurantia were employed to detect subtle differences in terminal fucosyl linkages recognized to modulate metastatic behavior of a range of malignancies, especially in prostate cancer cell trafficking.32 No differences were revealed in terminal fucose linked l-Fucα1,6GlcNAc-/l-Fucα1,2Glc- (Lotus) or l-Fucα1,6GlcNAc-/l-Fucα1,3NLac- (Aleuria), although l-Fucα1,2Galβ1- (Ulex) was not identified in the parental or knockdown cells.
Table 3.
Comparative Expression of Terminal Sialyl and Fucosyl Residues by PC3-Mparental, si-PC3-Mscramble, and si-PRKC-ζ-PC3-MT1-6 Cells
| No Neuraminidase | After Neuraminidase | ||||||
|---|---|---|---|---|---|---|---|
| Lectin | Sugar-Binding Specificity | PC3-Mparental | si-PC3-Mscramble | si-PRKC-ζ-PC3-MT1-6 | PC3-Mparental | si-PC3-Mscramble | si-PRKC-ζ-PC3-MT1-6 |
| Maackia amurensis | Neu5Acα2,6Gal- | ++ | ++ | ++ | − | − | − |
| Sambucus nigra | Neu5Acα2,3Gal- | +++ | +++ | +++ | ++ | ++ | + |
| Ulex europaeus | L-Fucα1,2Galβ1- | − | − | − | − | − | − |
| Lotus tetragonolobus | L-Fucα1,6GlcNAc-/ L-Fucα1,2Glc- | + | + | ++ | + | + | +++ |
| Aleuria aurantia | L-Fucα1,6GlcNAc-/ L-Fucα1,3NLac- | ++ | ++ | ++ | +++ | +++ | +++ |
Comparative DNA oligonucleotide expression profiling of si-PRKC-ζ-PC3-MT1-6 cells
No statistically significant (adjusted P ≥ 0.05) differences were found between PC3-Mparental and si-PC3-Mscramble cell lines, confirming that the transfection technique was not responsible for off-target effects to bias the experimental data. The hybridization data revealed 549 DNA sequences representing 373 genes to be differentially expressed (P ≤ 0.05; Benjamini and Hochberg multiple testing correction applied) following RNAi knockdown of PRKC-ζ. Of these, 85 genes were enhanced and 288 down-regulated, with 188 different genes being modulated at least 4-fold, 31 up-regulated (Supplemental Table S1) and 157 down-regulated (Supplemental Table S2). Frequently, multiple sequences for an individual gene were ranked in close proximity, confirming the quality of this data set. For 3 up-regulated genes (PLAT, CDKN2C, and HSPB1) and 1 down-regulated gene (FOXA2), the alterations were validated in qRT-PCR experiments (data not shown). According to current databases (Gene Cards http://www.genecards.org and AceView NCBI http://www.ncbi.nlm.nih.gov/IEB/Research/Acembly/), these genes reflected a wide range of biological functions, with Gene Ontology (GO) term enrichment analysis identifying some 40 biological process and 13 molecular function GO terms (Supplemental Tables S3 and S4) to be significantly associated (P < 0.001) different. A heat map generated from the 100 genes most affected (Figure 7) showed the knockdown phenotype to be distinct and further shifted from the parental PC3-M cells than the nonmalignant PNT-2 cells, thus confirming modulation of the malignant phenotype through down-regulation of PRKCZ-ζ. Ingenuity pathway analysis identified the top 4 ranked interlinked pathways and biological networks (Supplemental Table S5) containing genes expressed differentially following PRKC-ζ knockdown to be highly significant (P ≤ 10−28) and to include 2 networks with genes regulated by NFκB, networks centralized around p53, and networks around KDMSB, MCM6, and DDIT3 (Figure 8). This analysis further revealed that some of the genes modulated by down-regulated expression of PRKC-ζ are neither discrete nor independent but are functionally interconnected. This high level of cross-talk between apparently different biological processes provides the possibility for strategic manipulation of a single gene (demonstrated by modulation of PRKCZ-ζ) to profoundly affect the phenotype of target cancer cells.
Figure 7.
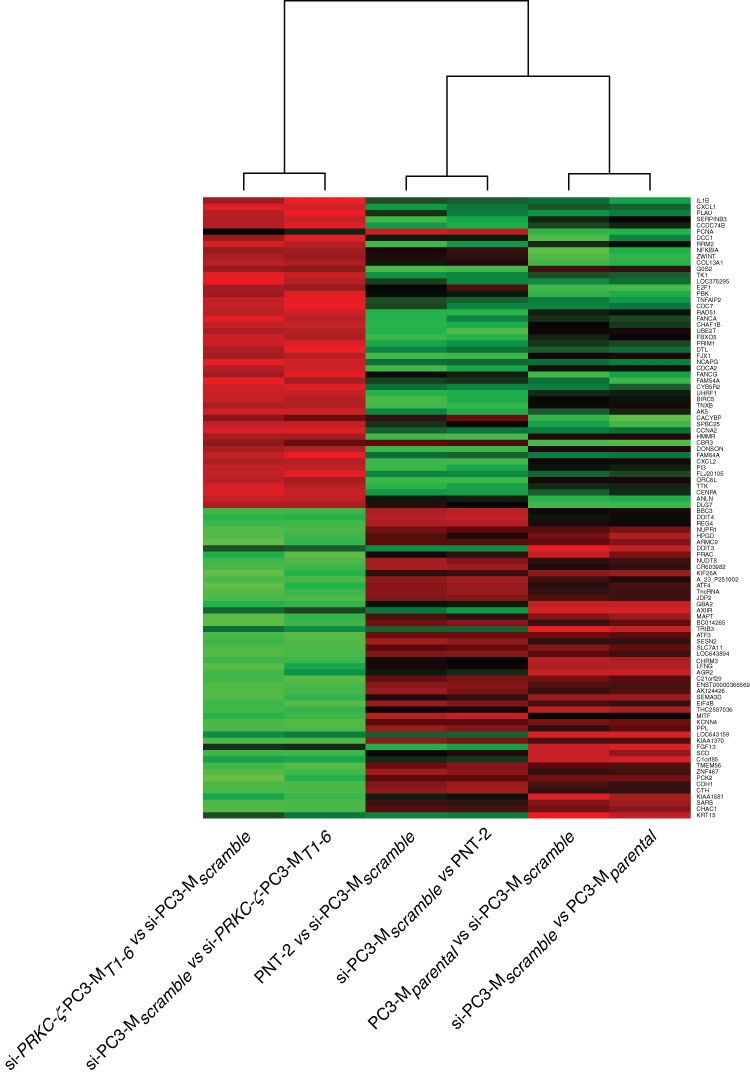
Differential expression of genes following si-PRKCZ-ζ knockdown: heat map of gene expression profiles from mRNA expressed by the top 50 up-regulated and top 50 down-regulated genes (Suppl. Tables S2 and S3) in the cloned prostate cell line si-RPKC-ζ-PC3-MT1-6 when compared to nonmalignant PNT-2 cells and to si-PC3-Mscramble cells. Hierarchical clustering is shown. Green indicates genes overexpressed, and red indicates genes down-regulated in each sample when compared to scramble transfected cells.
Figure 8.
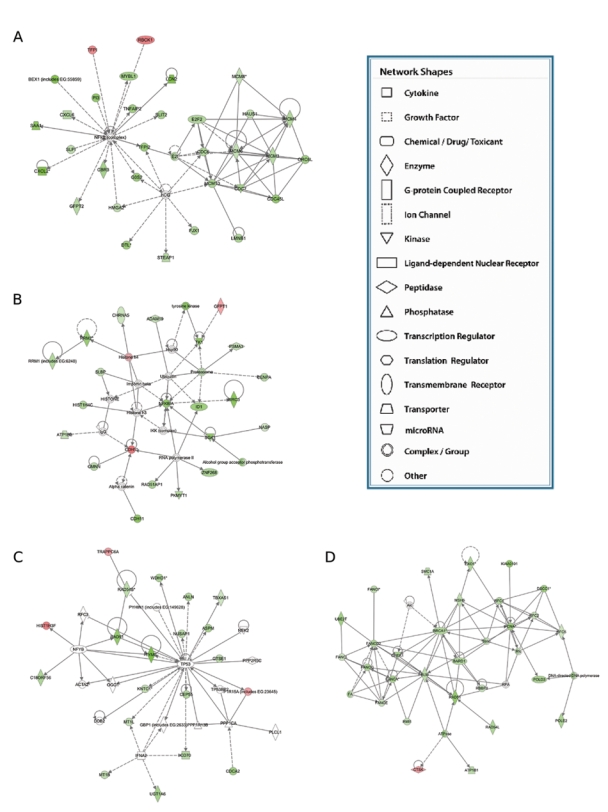
Gene Ontology (GO) enrichment pathway analysis. Analysis of genes modulated following PRKCZ-ζ knockdown identified 4 pathways principally affected: (A, B) genes known to be regulated by NFKB and almost universally down-regulated and (C, D) gene networks linked to KDMSB, MCM6, and DDIT3. This analysis revealed that some of the genes modulated by down-regulated expression of PRKC-ζ are interconnected, emphasizing the numerous pathways for cross-talk between apparently distinct biological processes.
Glycosyltransferase genes modulated in si-PRKC-ζ-PC3-MT1-6 cells
Interrogation of the gene expression array data confirmed down-regulation of glycosyltransferase enzyme genes GALNTL4 (~1.5-fold, P < 0.01) and GCNT3 (~1.5-fold, P < 0.01). Potentially, their change in expression would significantly alter the terminal antennary structure of glycoprotein oligosaccharides, thus affecting the substrates available for subsequent fucosyl- and sialyl-transferase activity.33 This possible mechanism is supported by the elevated expression (~1.6-fold, P < 0.01) of the sialyl-transferase gene ST6GALNAC2 (N-acetyl-GalNAc2,6sialyl- transferase) responsible for the Neu5Acα2,6Gal- structure identified by Sambucus and found to be increased in the PRKCZ-ζ knockdown cells (Figure 6B).
Ion channel genes modulated in si-PRKC-ζ-PC3-MT1-6 cells
Because we have previously demonstrated a functional relationship between voltage-gated ion channels and the invasive phenotype of prostate cancer cells,26,34,35 the oligonucleotide expression arrays were interrogated to determine whether genes encoding ion channels were modulated following PRKC-ζ knockdown. Two groups affected were voltage-gated K+ channel genes KCNN4 (up-regulated ~2.4-fold, P < 0.005), KCNK10 (down-regulated ~1.8-fold, P < 0.01), and KCNMA1 (down-regulated ~1.5-fold, P < 0.01) together with the Na+/K+ transporting ATPases β1 and β3 polypeptide genes ATP1B1 (down-regulated ~1.6-fold, P < 0.01) and ATP1B3 (down-regulated ~1.5-fold, P < 0.01). Although specific functions of these channels are complex, they are all involved in cellular homeostasis, including maintenance of cell polarity. These expression array data reveal in human prostatic epithelial cells a possible functional interaction between glycosyltransferase genes and ion channel genes such that they together contribute to modulating PC3-Mparental cells from a malignant toward a benign phenotype.
Discussion
At diagnosis, PKC-ζ protein expression is confirmed as a powerful predictive biomarker for survival from prostate cancer (P < 0.001) and for overall survival (P < 0.001). Furthermore, PKC-ζ expression accurately segregates men with poor-prognosis prostate cancer that requires active treatment from those with relatively indolent disease that should be managed conservatively. PKC-ζ expression also correlates strongly with Gleason grade (P = 0.001) but not with baseline PSA values (P > 0.2) despite PSA being an independent predictive variable in the original cohort of patients.7 In multivariate analysis, diminished significance (P < 0.05) of this variable suggests that it defines a biologically distinct group within the overall population of aggressive prostate cancers. Although most benign tissues did not express PKC-ζ, a small proportion of hyperplasias and PIN (Figure 2 A and B) were stained, indicating that early up-regulation of the protein may be a biomarker of epithelial pre-neoplasia in situ, one of the precursors of invasive prostate cancer.36
These RNAi studies, the first to be reported in human prostate cancer (Supplemental Table S6), support the original hypothesis by establishing functionality of PRKC-ζ in the malignant phenotype of human prostate cancer cells. Knockdown of the gene results in a significant reduction in malignancy, confirmed both in vitro and in vivo. Although proliferation was reduced (P < 0.05), apoptosis was not significantly affected (P > 0.05), the small differences detected being considered to reflect clonal variation in the knockdown cell lines. The subsequent gene expression array data also showed that PRKC-ζ is pleiotropic and regulates a variety of genes involved in several distinct but interactive networks. Hence, there is no single mechanism by which PRKC-ζ knockdown ameliorates the malignant phenotype. Nevertheless, one of the critical mechanisms revealed by this study is consistent with modulation of the genes for ion channels KCNK10 and KCNMA1. Cellular proliferation of prostate cancer cells is controlled by a variety of K+ channels, including voltage-, Ca2+-, adenosine triphosphate (ATP)–gated and 2-pore K+, and maxi-KCa channels37 encoded by KCNK10 and KCNMA1 through a regulatory network with PRKC-ζ. Conversely, down-regulation of voltage-gated K+ channel activity can be associated with invasive behavior.37 Such behavior could be subserved by KCNN4 coding for small/intermediate-conductance KCa channels found earlier in the metastatic PC-3 but not in nonmetastatic LNCaP cells.34 These data, together with the finding that enhanced KCNMA1 expression is functionally involved in breast cancer invasion and metastasis to the brain,38 not only exemplify the biological relevance of these channels but support a reciprocal interaction between ion channels, alterations in glycosyltransferase expression, and malignancy. The cellular distribution and role of the ion channels modulated following PRKC-ζ knockdown are directly dependent on their appropriate patterns of N-linked glycosylation such that any alteration inhibits their functionality, causing impaired cell polarization.39,40 Similarly, changes in ion channels disturb intracellular pH gradients with the consequence that certain proteins undergo alternative patterns of glycosylation, as evidenced by the glycoconjugate expression data (Figure 6), potentially resulting in their modulated distribution and/or functionality.41
The importance of PRKC-ζ in prostate cancer cell motility is supported by reduced colony formation in soft agar and impaired tumor cell invasion through a collagen matrix (Figure 4C-F) following gene knockdown. A similar role for PKC-ζ has been proposed in pancreatic cancer cells13 after inhibition of PRKC-ζ either chemically42 or genetically.43 To develop the mechanical forces necessary for cell migration, as well as interacting with actin,44,45 direct phosphorylation of myosin II protein by PKC-ζ occurs in TSU-pr1 prostatic adenocarcinoma cells in an epidermal growth factor (EGF)–dependent manner when complexed with p21-activated kinase-1 (PAK-1). In this pathway, PKC-ζ is phosphorylated and activated by PAK-1, promoting phosphorylation of myosin II.46
In addition to a functionally competent locomotor assembly, maintenance of cell polarity and loss of cell-cell adhesion are essential for cell migration.47 For a cell to migrate, generation of a forward-rear polarity axis occurs principally through the PAR-PKC-ζ system.48 A complex established between PAR6-Akt2 and PKC-ζ is activated by Cdc42.49 Upstream, the interaction between PKC-ζ and Akt2 is regulated directly by EGF50 and indirectly by TGFbeta controlling the integrity of intracellular tight junctions through the interaction of PAR6 with TGFbeta receptors.51 During locomotion, stabilization of lamellipodia required for cell migration and invasion52 involves formation of the Cdc42/PAR6/Akt2/Rac1 polarity complex that, following activation by PKC-ζ, recruits Smurf1 to regulate the local level of RhoA.45 Within these lamellipodia, phosphorylation of Hsp-27 simultaneously modulates transformation of G→F actin53 in the presence of fascin to generate the mechanical forces required for cell motility to occur through organization of cytoskeletal components54 that we have previously shown to characterize the aggressive phenotype of human prostate cancer.25 Our current studies clearly demonstrate enhanced site-specific phosphorylation of Hsp-27 Ser82 in si-PRKC-ζ-PC3-MT1-6 cells when PKC-ζ is reduced (Figure 6A). Thus, human prostate cancer cells depend on the presence and integrity of both PKC-ζ and Hsp-27 to develop a malignant phenotype that is biologically competent to invade and metastasize. Presently, these are regarded as simultaneous and independent processes because there is no evidence that Hsp-27 Ser82 is a substrate for PKC-ζ phosphorylation or that PRKC-ζ transactively regulates transcription of HSPB1 and hence the level of Hsp-27, despite increasing evidence that PKC-ζ is an essential transcriptional regulator for other genes.10,55,56
Identification of gene interaction networks is a powerful approach to segregating prostatic malignancies into biologically defined groups amenable to different types of therapeutic intervention.57,58 However, there is a caveat that application of the types of data reported herein depends on the integrity and expression of key genes that determine the genotype of each individual prostatic malignancy. In PC3-M prostate cancer cells, the gene TP53 is point-mutated in exon 5, in common with approximately 60% of primary prostate cancers, and supporting the proposition that down-regulation of PRKC-ζ would be effective in this group. Such cells are potentially able to regulate DNA replication through GINS complex members,59 an essential component of the human replisome. In the current study, down-regulation of GINS2 (~7-fold, P < 0.05) was associated with a concomitant reduction in PCNA (~8-fold, P < 0.01), CDC2 (~7-fold, P < 0.05), CCDC74B (~8-fold, P < 0.01), and CDC45L (~10-fold, P < 0.05), indicating altered regulation of mitosis during initiation as well as S-phase and G2-M progression60 to occur as a consequence of PRKC-ζ knockdown. This method has revealed the members of several different networks to be reduced following knockdown of PRKC-ζ (Supplemental Table S2). These included the gene ID1 (~8-fold, P < 0.05) and RAD51 (~10-fold, P < 0.01) that we have already shown to be associated (P < 0.001) with aggressive prostate cancer.23,24 In this study, members of the NFκB pathway were principally reduced, particularly NFKBIA (~10-fold, P < 0.01). The NFκB complex is recognized to be inhibited by IκB proteins (NFκBIA or NFκBIB) that trap and inactivate NFκB.61 Phosphorylation of serine residues within the IκB proteins by a range of kinases marks them for destruction following ubiquitination, thereby allowing activation of the NFκB complex. Simultaneous up-regulation of phosphoenolpyruvate carboxykinase 2 (PKC2, ~4-fold, P < 0.05, Supplemental Table S1) provides evidence of a more complex pathway modulated by PRKC-ζ knockdown. Other genes down-regulated in this extensive network include BEX1 (~15-fold, P < 0.05), CLX1 (~70-fold, P < 0.01), and CLX2 (~20-fold, P < 0.05). BEX1 knockdown accelerates cell differentiation and potentiates NFκB in response to NGF, whereas reduction of CXCL1 and CXCL2 expression is NFκB dependent, requiring intact IκκB.
This study has revealed how suppression of a single key pleiotropic gene in an established cancer cell can perturb the interactive balance between members of the cell’s genome so that a shift occurs from a malignant to a benign phenotype. Interpolation of the current data suggests that such an effect may be the converse of the network imbalance now believed to be generated by the combined small effects of a number of different genes acting together to promote emergence of the malignant phenotype.3,62 Although RNAi is effective in vivo against established prostate cancers,63 small-molecule inhibitors would provide a more flexible therapeutic approach. Novel protein kinase C inhibitors64 already exhibit both tissue and tumor specificity against different PKC isoforms.65 Presently, the most effective agents are the PKC-β inhibitors briostatin-1 and enzastaurin, the latter being trialed against human lung cancer,66 whereas in human non–small cell lung carcinoma (NSCLC), aurothiomalate and aurothioglucose are selective and effective inhibitors of PKC-ι, the homologue of PKC-ζ.67 Recently, spheciosterol sulfates extracted from Philippine sponges68 and a novel class of small molecules (the 3-hydroxy-2-(3-hydroxyphenyl)-4H-1 enzopyran-4-ones) have been described as isoform-selective PKC-ζ inhibitors.69 Therapeutically employed for psychostimulant abuse, the potential value of these latter agents has yet to be assessed in treating epithelial malignancies. With reference to their inhibitory effects on prostate cancer metastases, bisphosphonates (e.g., pamidronate) specifically inhibit PKC-α and PKC-ζ, possibly through a network effect on urokinase-type plasminogen activator.70 It is anticipated that the emerging PKC isoform selectivity of new small-molecule inhibitors,71 together with the identification of tissue-specific PKC variants (S. Yao, A. Bee, C. Beesley, et al., unpublished data, 2010),72 will provide a high level of tumor specificity for therapeutic intervention in the management of malignant diseases.
Herein, we provide robust evidence that PKC-ζ is not only functionally involved in promoting and maintaining prostate cancer but that the gene PRKC-ζ is a biologically effective target for control of this malignancy. Furthermore, the consequences of reducing PKC-ζ through PRKC-ζ gene knockdown, particularly identification of other potential targets such as the voltage-gated K+ channels,73 allows development of a comprehensive therapeutic strategy based on detailed knowledge of biological pathways active in subsets of human prostate cancer. Understanding the potential impact of such approaches is not possible without a robust and validated database of molecular interactions. For cancer therapeutics, there are two corollaries: first is that mathematical modeling of genes expressed by an individual cancer will allow accurate prediction of susceptibilities and weaknesses that might be exploited to treat each malignant disease in a biologically appropriate manner.74 Second is the concept of phenotypic modulation to treat cancers.75 Through phenotypic modulation, prevention of metastases while maintaining the general health of a patient with early cancer would provide additional time to introduce second-line therapies to target specific networks such as NFκB76,77 in the knowledge that these would be biologically appropriate to accommodate the phenotypic changes induced in malignant cells by a first-line therapy.
Materials and Methods
Patient cohort and tissue microarrays (TMAs) for PKC-ζ analysis
The study analyzed a panel of TMAs constructed from a retrospective cohort of >2000 men with prostate cancer assembled from the records held by UK cancer registries and managed only conservatively.7,78
Ethical approval
National approval for the collection of the cohort was obtained from the Northern Multi-Research Ethics Committee followed by local ethics committee approval at each of the collaborating hospital trusts. This work was approved by the Clinical Research and Ethics Committee at the Royal Marsden Hospital and The Institute of Cancer Research.
PKC-ζ immunohistochemistry
Rabbit polyclonal antiserum sc-216 to PKC-ζ (Insight Biotechnology Ltd., Wembley, Middlesex, UK) recognizes a unique 20-peptide sequence located in the –COOH terminal domain of the protein (NM_002774) encoded by exon 90 (AceView nomenclature) of the PRKCZ gene 18. TMA sections of human prostate tissues were processed, stained, and analyzed as previously described.8,25 Immunohistochemical staining of PKC-ζ in human prostate epithelial cells grown as xenografts in nude mice was performed using antiserum sc-216 diluted to 1:1000 in REAL antibody diluent (cat. no. S2022; Dako, Glostrup, Denmark). Prior to staining, antigen retrieval employed PT-Link with EnVision FLEX, high pH target retrieval solution. Staining was performed on a Dako Autostainer using a labeled polymer–horseradish peroxidase (HRP) detection system (Dako, EnVision FLEX, K8000). Immunostained sections were counterstained with hematoxylin, dehydrated, and mounted in resinous mountant. Negative controls comprised duplicate tissue sections processed identically but with replacement of the primary antibody by a 1% (w/v) solution of bovine serum albumin.
Analysis of PKC-ζ expression
Specimens were considered positive only when at least 5% of the epithelial cells (either normal or malignant) unequivocally expressed PKC-ζ staining.79 This cutoff was the same as that used to distinguish positive and negative immunohistochemical staining in our previous studies.8,25 Staining was assessed as negative, weakly positive or only focally positive (low-level expression), or strongly positive (high-level expression) and scored as 0, 1, 2, or 3, respectively.
Statistical analysis of TMA immunohistochemistry
The primary endpoint for this study was time to death from prostate cancer. Time to death from any cause was the secondary endpoint. Univariate and multivariate analysis was performed by proportional hazard (Cox) regression analysis.25,80 Correlation of PKC-ζ staining (3+ vs. 2+ or less) with other known prognostic factors was done by 2-sample trend tests.
Cell lines
Human prostate cell lines PNT-2 (benign) and PC3-Mparental (highly malignant) were grown as monolayer cultures in RPMI 1640 (Invitrogen, Paisley, UK) supplemented with 10% (v/v) fetal calf serum (FCS; Invitrogen), penicillin (1000 U/mL), streptomycin (100 µg/mL), and L-glutamine (2 mM). Media for the culture of all subsequent transfected cell lines were also supplemented with 1 µg/µL Geneticin (Sigma-Aldrich, St. Louis, MO).
RNAi molecule designed to knock down PRKC-ζ
A unique 21-nt sequence (GTGAGAGACATGTGTCGTCTT) located at the 5′ end of PRKC-ζ was selected as the target site beginning with the AA dinucleotide downstream of the start codon according to the siRNA user guide (http://www.rockefeller.edu/labheads/tuschl/project.html) using siRNA Target Finder (http://www.ambion.com/techlib/misc/siRNA_finder.html). The target site was a unique sequence within an exonic coding region of the human PRKCZ gene.
Top strand:
5′-GATCCGTGAGAGACATGTGTCGTCTTCAAGAGAGACGACACATGTCTCTCACTTA-3′
Bottom strand:
5′-CTAGGCACTCTCTGTACACATCAGAAGTTCTCTCTGCTGTGTACAGAGAGTGAAT-3′
The default Ambion loop sequence, TTCAAGAGA, was used to complete the hairpin structure. The siRNA expression vector kit used was pSilencer™ 4.1-CMV neo (Ambion). Top and bottom strands of the siRNA hairpin oligonucleotide were diluted to 1 µg/µL in TE buffer and annealed in 50 µL solution according to the manufacturer’s instructions. The annealed siRNA template was ligated into the pSilencer™ 4.1-CMV vector using T4 DNA ligase (5 U/µL) and the products cloned into DH5α cells (Invitrogen). Transformed cells were grown for 16 hours on LB plates containing 100 µg/mL ampicillin at 37°C. A negative control of nontransformed competent cells was also included. Clones were picked and the DNA plasmid isolated using a Qiaprep spin Miniprep Kit (Qiagen, Crawley, UK). Isolated plasmids were digested with BamHI and HindIII (New England Biolabs, Hitchin, UK), and the presence of the siRNA 55-bp insert was confirmed by sequencing prior to the siRNA expression vector being used to transfect recipient prostate cancer cell lines. Orientation of the insert was confirmed by DNA sequencing (Lark Technologies, Essex, UK) using internal sequence primers.
Transfection of siRNA PRKC-ζ silencing construct and control
Of the PC3-Mparental cells, 1.5 × 10⁵ were transfected with pSilencer™ 4.1 CMV PRKC-ζ siRNA (1 µg) using SiPORT XP-1 (3 µL) reagent (Ambion) in 6-well plates (35-mm diameter). Twenty-four hours after transfection, 500 ng/mL of G418 was added to medium RPMI1640 for selection. After 9 to 10 days’ selection, individual colonies from single cells containing stable clones were isolated using ring cloning and transferred into 24-well plates with medium containing G418 at 500 ng/mL. Simultaneously, 1.5 × 10⁵ PC3-Mparental cells were transfected with pSilencer™ 4.1 CMV-scramble-insert (1 µg). Thereafter, these cells were cultured, cloned, and employed as the controls to assess changes in expression of genes and proteins by the knockdown cells.
RNA extraction and cDNA synthesis
Total RNA was extracted with RNeasy Mini Kits (Qiagen). Total RNA concentration was measured using a NanoDrop (Labtech, Ringmer, UK) and RNA integrity assessed with a 2100 Bioanalyzer (Agilent, Santa Clara, CA). The RNA integrity number (RIN) for all RNA used exceeded 9.0. First-strand cDNA was synthesized from 0.5 µg total RNA using AffinityScript™ Multiple Temperature cDNA synthesis kits (Stratagene, La Jolla, CA) according to the manufacturer’s protocol.
Quantitative real-time PCR (qPCR)
PRKC-ζ mRNA expression levels were quantified by qPCR and normalized relative to human β-actin mRNA expression. Primer sequences employed are shown in Table 4. Reaction volumes were in 25 µL comprising 12.5 µL Stratagene’s Brilliant® SYB® Green Master Mix (2x), 0.5 µM of both forward and reverse primers, 1 µL cDNA, and 11.5 µL water. Primers for qPCR were designed to span exon/exon boundaries within the mRNA to avoid amplification of genomic DNA.
Table 4.
Amplification Sequences Employed for qPCR Validation of Gene Expression
| Gene | Sequences 5′ → 3′ | Gene Bank Accession No. | Product Size (bp) | Amplification Temp (°C) |
|---|---|---|---|---|
| PRKC-ζ (Forward-1) | CCA TGT CCG GGA GAA GAC | NM_002744 | 288 | 60 |
| PRKC-ζ (Reverse-1) | TTG GGA AGG CAT ACA GAA TC | |||
| PRKC-ζ (Forward-2) | ACA TGT GTC GTC TGC ACC AG | NM_002744 | 150 | 60 |
| PRKC-ζ (Reverse-2) | GTG CTC GGG AAA ACA TGA AT | |||
| β-actin (Forward) | AGC ACG GCA TCG TCA CCA ACT | BC004251 | 180 | 58 |
| β-actin (Reverse) | TGG CTG GGG TGT TGA AGG TCT | |||
| CDKN2C (Forward) | CCG GAG TCA TTA ACC AGG AA | NM_001262 | 127 | 59 |
| CDKN2C (Reverse) | TCA GCA AAA CTG AGC CAT TG | |||
| PLAT (Forward) | CCA CTC AGT GCC TGT CAA AA | NM_000930 | 147 | 59 |
| PLAT (Reverse) | CAC GTG GCC CTG GTA TCT AT | |||
| FOXA2 (Forward) | TTT AAA CTG CCA TGC ACT CG | NM_153675 | 119 | 60 |
| FOXA2 (Reverse) | GTT GCT CAC GGA GGA GTA GC | |||
| HSPB1 (Forward) | GTC CCT GGA TGT CAA CCA CT | NM_001540 | 148 | 59 |
| HSPB1 (Reverse) | GAC TGG GAT GGT GAT CTC GT |
Cycling conditions for the reaction were as follows: 95°C for 15 minutes, then 40 cycles at 94°C for 15 seconds, 63°C for 30 seconds, plate read and 72°C for 30 seconds, with a final extension at 72°C for 10 minutes. Melting curves were generated to detect primer-dimer formation and to confirm gene-specific peaks for targets.
Proliferation assay of cell lines
An assay to identify the effect of PRKC-ζ suppression on cellular proliferation assessed cell lines PNT-2, PC3-Mparental, si-PC3-Mscramble, and 2 si-PRKC-ζ-PC3-M clones. Exponentially growing cells were seeded in triplicate sets at a density of 1 × 10³ cells/mL/well in 24-well plates. Over 6 days at 24-hour intervals, cell proliferation was calculated by measuring the increase in cell numbers in each replicate using a conventional MTT assay.81
Apoptotic properties of cell lines
Apoptosis was quantified using flow cytometry. Cells were seeded at 2 × 10⁵ cells/mL in 75-cm2 tissue culture flasks and the assay conducted during their linear growth phase prior to reaching confluence. Cells were harvested by trypsinization, washed twice with phosphate-buffered saline (PBS), and resuspended in buffer from the BioVision Annexin V-FITC kit (BioVision, Mountain View, CA) in a 5-mL flow cytometry tube. Annexin V-FITC (5 µL) and propidium iodide (10 ng in 5 µL aqueous solution) were added and the tubes incubated for 10 minutes in darkness at 4°C. Quantitative analyses of apoptotic cell levels were performed using an Epics Flow Cytometer (Beckman Coulter, Fullerton, CA). The procedure was performed 3 times using biological replicates.
Soft agar tumorgenicity assay
Cells were grown under standard environmental conditions as suspension cultures at a concentration of 2.5 × 10³ cells/mL in 0.3% (w/v) agarose at 37°C, 100% humidity, and 5% CO2 in air. After a 3-week incubation, cell colonies were counted and photographed using a GelCount™ (Oxford Optronix, Oxford, UK) instrument. Any colonies of diameter <30 µm or >100 µm were excluded, the latter probably signifying that these were not derived from single cells.
In vitro invasion
Invasiveness of the si-PRKC-ζ transfectants was assessed in vitro.35 At 24-hour intervals, following fixation and staining with Crystal Violet (Sigma-Aldrich), invasion was measured by counting the number of cells transmigrating the membrane to its undersurface.
In vivo growth
Tumorigenicity and metastatic ability in vivo were measured.82 A deposit of 2 × 10⁶ cells in 200 µL PBS of each cell line was injected into a single subcutaneous site in the right shoulder of 8-week-old male Nu/nu mice (Harlan Ltd., Oxon, UK). Four groups of cells were assessed: PC3-Mparental, si-PC3-Mscramble, si-PRKC-ζ-PC3-MT1-6, and si-PRKC-ζ-PC3-MT1-2. Tumor growth was monitored twice weekly and the volume calculated.83 When any tumor reached the maximum size allowed under the conditions of the Home Office Project Licence PPL 40/2270, all mice were sacrificed. Each animal was autopsied. All tissues were processed, embedded in paraffin wax, and histological sections cut at 4 µm before staining with Gill’s hematoxylin. All animal experiments were conducted under United Kingdom Coordinating Committee on Cancer Research (UKCCR) guidelines.
Hsp-27 expression and phosphorylation status
Hsp-27 is an independent biomarker of the aggressive malignant phenotype of human prostate cancer.25 Although no functional relationship has been reported between Hsp-27 and PKC-ζ, it was hypothesized that amelioration of malignancy following PRKC-ζ knockdown would be accompanied by a reduction in the level of Hsp-27 expression. Therefore, Western blotting was performed on the proteins extracted from ~1 × 10⁷ cells from each line to identify total Hsp-27 as well as the differential phosphorylation of this protein at Ser15, Ser78, and Ser82. Each cell pellet was suspended in 1 mL of CelLytic-M lysis buffer (C2978, Sigma) containing 10 µL protease inhibitor cocktail (P8340, Sigma), 10 µL PMSF (0.1 mg/mL), Na3VO4 (1 mM), and NaF (1 mM). Protein concentrations were determined by Bradford assay (Bio-Rad kit 500-0006; Bio-Rad, Hercules, CA). Aliquots containing ~10 µg cell lysate proteins were separated electrophoretically in 12.5% (w/v) polyacrylamide Protogel quick-cast separating gels (EC-895; National Diagnostics, Atlanta, GA). After separation, proteins were transferred onto PVDF membranes (RPN303F; GE Healthcare, Piscataway, NJ), blocked with a suspension of powdered dried milk in PBS (100 mM, pH 7.6) and incubated overnight with monoclonal antibodies to generic Hsp-27 or to each of the phosphorylated serine sites (06-478, 07-388, 04-447, and 04-448, respectively; Upstate [Millipore], Watford, UK). After washing and incubation with HRP-labeled secondary antibodies, membranes were incubated in ECL-Plus reagent (RPN 2133; GE Healthcare) before exposure to Amersham Hyperfilm (28906839; GE Healthcare).
Glycoconjugate expression
The behavior of malignant epithelial cells is influenced by expression of cell surface complex glycoconjugates, particularly sialic acids.30,31,41,84 In mouse, PKC enzymes promote integrin expression following glycosyltransferase gene deletion.85 To confirm this functional relationship and test the hypothesis that PRKC-ζ knockdown would modulate the profile of sialylated glycoconjugates, lectin histochemistry was performed on intact cells and on Western blots of their protein extracts. Cell blocks were prepared from cell lines PNT-2, PC3-Mparental, si-PC3-Mscramble, and si-PRKC-ζ-PC3-MT1-6.86 Sections cut at 5 µm were stained for Neu5Acα2→3Gal- and Neu5Acα2→6Gal- using the biotinylated lectins (Vector Laboratories, Peterborough, UK) from Sambucus nigra and Maackia amurensis, respectively.87 Negative controls included the absence of staining when the lectins were not included in the staining protocol and removal of sialic acids with subsequent abolition of staining following pretreatment of the slides with neuraminidase88 prior to incubation with either of these lectins. Lectin binding was confirmed using avidin-fluorochrome conjugates visualized with an Olympus BX61 fluorescent microscope and x100 objective. To identify global changes in glycoprotein expression following siRNA knockdown of PRKC-ζ, Western blotting of cell lysates using each lectin was performed as described for the detection of Hsp-27 (above) with the exception that nonspecific binding of protein to the PVDF membranes was blocked with BSA (1.5%, w/v) rather than milk. Before use, the optimal dilution of each lectin in PBS (100 mM, pH 7.6) containing BSA (1.5%, w/v) was determined by titration against separated PC3-Mparental cell lysates.
Gene microarray and expression analysis
The effect of suppressing PRKC-ζ by gene knockdown on whole-genome expression profiles was investigated using 2-color Agilent Human genome 44K microarrays. Each hybridization was a distinct biological replicate. The design incorporated 5 cell lines treated as fixed biological factors: PNT-2, PC3-Mparental, si-PC3-Mscramble, PC3-Mpool, and si-PRKC-ζ-PC3-MT1-6 (PRKC-ζ knockdown). The si-PC3-Mscramble cell line was employed as the common control comparator to identify differences in gene expression between these cells and all other cell types in these experiments. Hybridizations and data acquisition were performed according to the Agilent Human Genome Microarray (MA) 44K protocol. Spatial representations of the hybridization signals were examined to ensure that there were no artifacts. The distribution of background and foreground signals and prenormalization MA plots were examined to measure the quality of the hybridization. Low-quality spots identified by the Agilent image-processing software were not used in the subsequent analyses. Expression signal estimates were derived from the red (cy3) and green (cy5) Agilent Processed Signal data by normalizing using the LOESS algorithm and background correction using a fitted convolution of normal and exponential distributions.89,90 An Aquantile normalization between arrays was also performed. Expression analysis of log2 transformed normalized data was performed in the R statistical programming language (R version 2.8.0) using the BioConductor framework.91 Gene expression was modeled with a fixed effects linear model with a term representing residual dye effects and 4 cell line–specific contrasts in which the gene expression values of the control si-PC3-Mscramble cell lines were subtracted from the expression values of the PNT-2, PC3-Mparental, PC3-Mpool, and si-PRKC-ζ-PC3-MT1-6 cell lines. A channel-specific design matrix was constructed using the si-PC3-Mscramble cells as the common reference, and this was incorporated into a linear model using BioConductor limma.92 For each cell line contrast, a moderated t statistic was computed for each probe with the resulting P values adjusted for multiple testing using Benjamini and Hochberg’s method to control the false discovery rate.93 Those sequences with an adjusted P value <0.05 were considered significantly differentially expressed between the two groups being compared. GO term enrichment analysis was performed separately with lists of significantly up- and down-regulated genes to find significant functional terms (FatiGO, http://babelomics.bioinfo.cipf.es/). GO terms and KEGG networks that were significantly associated with the genes expressed differentially between si-PRKC-ζ-PC3-MT1-6 and PC3-Mparental cell lines were assessed using hypergeometric tests (P < 0.001).94 The list of genes expressed differentially between si-PRKC-ζ-PC3-MT1-6 and PC3-Mparental cell lines was uploaded into the Ingenuity pathway analysis application (Ingenuity Systems, www.ingenuity.com). A score was computed for each network according to the fit of the original set of significant genes. This score reflects the negative logarithm of the P value, which indicates the likelihood of the focus genes in a network being found together as a result of random chance.
Microarray validation
In addition to NFKB1A, TNFSR6, MMP3, and MMP10 (A. Bee, B. Lane, E. Hunter, et al., unpublished data, 2010), gene profiles were validated in the si-PRKC-ζ-PC3-MT1-6 cells using qPCR to confirm the expression of PLAT, HSPB1, CDKN2C, and FOXA2 with respect to si-PC3-Mscramble cells, when normalized against human β-actin.
Supplementary Material
Footnotes
The author(s) declared no potential conflicts of interest with respect to the authorship and/or publication of this article.
This work was funded by the North West Cancer Research Fund (UK), Cancer Research–UK, the National Cancer Research Institute (MRC-UK), a Specialized Program of Research Excellence (SPORE) grant from the US National Cancer Institute (USA), Grand Charity of Freemasons, Rosetrees Trust, The Bob Champion Cancer Trust, The Orchid Appeal, and David Koch Foundation. Funding bodies had no involvement in the design and conduct of the study; in collection management, analysis, and interpretation of the data; or in preparation, review, and approval of the paper. We are extremely grateful to Mrs. Jill Gosney for her invaluable assistance in preparing this manuscript.
Supplementary material for this article is available on the Genes & Cancer Web site at http://ganc.sagepub.com/supplemental.
References
- 1. Jemal A, Siegel R, Ward E, et al. Cancer statistics 2008. CA Cancer J Clin 2008;58:71-96 [DOI] [PubMed] [Google Scholar]
- 2. Cancer Research UK Cancer stats, key facts on prostate cancer—November 2008. Available from: http://www.cancerresearchuk.org/cancerstats/types/prostatecancer Accessed April 2009
- 3. Easton DF, Eeles RA. Genome-wide association studies in cancer. Hum Mol Genet 2008;17:R109-R15 [DOI] [PubMed] [Google Scholar]
- 4. Al Olama AA, Kote-Jarai Z, Giles GG, et al. Multiple loci on 8q24 associated with prostate cancer susceptibility. Nat Genet 2009;41:1058-60 [DOI] [PubMed] [Google Scholar]
- 5. Eeles RA, Kote-Jarai Z, Al-Olama AA, et al. Identification of seven new prostate cancer susceptibility loci through a genome-wide association study. Nat Genet 2009;41:1116-21 [DOI] [PMC free article] [PubMed] [Google Scholar]
- 6. Foster CS, Cooper CS. Urgent need to develop independent biomarkers for functional, diagnostic and prognostic application in oncology research. Biomarkers Med 2009;3:329-33 [DOI] [PubMed] [Google Scholar]
- 7. Cuzick J, Fisher G, Kattan MW, et al. Long-term outcome among men with conservatively treated localised prostate cancer. Br J Cancer 2006;95:1186-94 [DOI] [PMC free article] [PubMed] [Google Scholar]
- 8. Cornford P, Evans J, Dodson AR, et al. Protein kinase C isoenzyme patterns characteristically modulated in early prostate cancer. Am J Pathol 1999;154:137-44 [DOI] [PMC free article] [PubMed] [Google Scholar]
- 9. Sun R, Gao P, Chen L, et al. Protein kinase C zeta is required for epidermal growth factor-induced chemotaxis of human breast cancer cells. Cancer Res 2005;65:1433-41 [DOI] [PubMed] [Google Scholar]
- 10. Galvez AS, Duran A, Linares JF, et al. Protein kinase C ζ represses the interleukin-6 promoter and impairs tumorigenesis in vivo. Mol Cell Biol 2009;29:104-15 [DOI] [PMC free article] [PubMed] [Google Scholar]
- 11. Liu Y, Wang B, Wang J, et al. Down-regulation of PKC zeta expression inhibits chemotaxis signal transduction in human lung cancer cells. Lung Cancer 2009;63:210-8 [DOI] [PubMed] [Google Scholar]
- 12. Evans JD, Cornford PA, Dodson A, Neoptolemos JP, Foster CS. Expression patterns of protein kinase C isoenzymes are characteristically modulated in chronic pancreatitis and pancreatic cancer. Am J Clin Pathol 2003;119:392-402 [DOI] [PubMed] [Google Scholar]
- 13. Laudanna C, Sorio C, Tecchio C, et al. Motility analysis of pancreatic adenocarcinoma cells reveals a role for the atypical zeta isoform of protein kinase C in cancer cell movement. Lab Invest 2003;83:1155-63 [DOI] [PubMed] [Google Scholar]
- 14. Pearson M, Hurley JH. Structure, function and membrane interactions of C1 domains. In: Protein kinase C. 2nd ed Kluwer Academic; /Plenum: 2004. p. 9-15 [Google Scholar]
- 15. Masso-Welch PA, Verstovsek G, Ip MM. Alterations in the expression and localization of protein kinase C isoforms during mammary gland differentiation. Eur J Cell Biol 1999;78:497-510 [DOI] [PubMed] [Google Scholar]
- 16. Muscella A, Storelli C, Marsigliante S. Atypical PKC-zeta and PKC-iota mediate opposing effects on MCF-7 Na+/K+ ATPase activity. J Cell Physiol 2005;205:278-85 [DOI] [PubMed] [Google Scholar]
- 17. Park JW, Kim HP, Lee SJ, et al. Protein kinase C alpha and zeta differentially regulate death-inducing signaling complex formation in cigarette smoke extract-induced apoptosis. J Immunol 2008;180:4668-78 [DOI] [PubMed] [Google Scholar]
- 18. Guo H, Gu F, Li W, et al. Reduction of protein kinase C ζ inhibits migration and invasion of human glioblastoma cells. J Neurochem 2009;109:203-13 [DOI] [PubMed] [Google Scholar]
- 19. Kela I, Harmelin A, Waks T, Orr-Urtreger A, Domany E, Eshhar Z. Interspecies comparison of prostate cancer gene-expression profiles reveals genes associated with aggressive tumors. Prostate 2009;69:1034-44 [DOI] [PubMed] [Google Scholar]
- 20. Cooper CS, Foster CS. Concepts of epigenetics in prostate cancer development. Br J Cancer 2009;100:240-5 [DOI] [PMC free article] [PubMed] [Google Scholar]
- 21. Morgan EA, Forootan SS, Adamson J, et al. Expression of cutaneous fatty acid-binding protein (C-FABP) in prostate cancer: potential prognostic marker and target for tumourigenicity-suppression. Int J Oncol 2008;32:767-75 [PubMed] [Google Scholar]
- 22. Bee A, Ke Y, Forootan S, et al. Ribosomal protein L19 is a prognostic marker for human prostate cancer. Clin Cancer Res 2006;12:2061-5 [DOI] [PubMed] [Google Scholar]
- 23. Forootan SS, Wong Y-C, Dodson A, et al. Increased Id-1 expression is significantly associated with poor survival of patients with prostate cancer. Hum Pathol 2007;38:1321-9 [DOI] [PubMed] [Google Scholar]
- 24. Mitra A, Jameson C, Barbachano Y, et al. Over-expression of RAD51 occurs in aggressive prostate cancer. Histopathology 2009;55:696-704 [DOI] [PMC free article] [PubMed] [Google Scholar]
- 25. Foster CS, Dodson AR, Ambroisine L, et al. Hsp-27 expression at diagnosis predicts poor clinical outcome in prostate cancer independent of ETS-gene rearrangement. Br J Cancer 2009;101:1137-44 [DOI] [PMC free article] [PubMed] [Google Scholar]
- 26. Smith P, Rhodes NP, Shortland AP, et al. Sodium channel protein expression enhances the invasiveness of rat and human prostate cancer cells. FEBS Lett 1998;423:19-24 [DOI] [PubMed] [Google Scholar]
- 27. Diss JK, Stewart D, Pani F, et al. A potential novel marker for human prostate cancer: voltage-gated sodium channel expression in vivo. Pros Cancer Pros Dis 2005;8:266-73 [DOI] [PubMed] [Google Scholar]
- 28. Grimes JA, Fraser SP, Stephens GJ, et al. Differential expression of voltage-activated Na+ currents in two prostatic tumour cell lines: contribution to invasiveness in vitro. FEBS Lett 1995;369:290-4 [DOI] [PubMed] [Google Scholar]
- 29. Fraser SP, Ding Y, Liu A, Foster CS, Djamgoz MBA. Tetrodotoxin suppresses morphological enhancement of the metastatic MAT-LyLu rat prostate cancer cell line. Cell Tissue Res 1999;295:505-12 [DOI] [PubMed] [Google Scholar]
- 30. de Albuquerque Garcia Redondo P, Nakamura CV, de Souza W, Morgado-Diaz JA. Differential expression of sialic acid and N-acetylgalactosamine residues on the cell surface of intestinal epithelial cells according to normal or metastatic potential. J Histochem Cytochem 2004;52:629-40 [DOI] [PubMed] [Google Scholar]
- 31. Wang FL, Cui SX, Sun LP, et al. High expression of alpha 2, 3-linked sialic acid residues is associated with the metastatic potential of human gastric cancer. Cancer Detect Prev 2009;32:437-43 [DOI] [PubMed] [Google Scholar]
- 32. Barthel SR, Wiese GK, Cho J, et al. Alpha 1,3 fucosyltransferases are master regulators of prostate cancer cell trafficking. Proc Nat Acad Sci U S A 2009;106:19491-6 [DOI] [PMC free article] [PubMed] [Google Scholar]
- 33. Liu S, Meng L, Moremen KW, Prestegard JH. Nuclear magnetic resonance structural characterization of substrates bound to the alpha-2,6-sialyltransferase, ST7Gal-I. Biochemistry (Mosc) 2009;48:11211-9 [DOI] [PMC free article] [PubMed] [Google Scholar]
- 34. Laniado ME, Fraser SP, Djamgoz MB. Voltage-gated K+ channel activity in human prostate cancer cell lines of markedly different metastatic potential: distinguishing characteristics of PC-3 and LNCaP cells. Prostate 2001;46:262-74 [DOI] [PubMed] [Google Scholar]
- 35. Smith P, Rhodes NP, Shortland AP, et al. Upregulation of sodium channel protein expression correlates with increase in invasiveness of rat and human prostate cancer cell lines. FEBS Lett 1998;423:19-24 [DOI] [PubMed] [Google Scholar]
- 36. Foster CS, Dodson A, Karavana V, Smith PH, Ke Y. Prostatic stem cells. J Pathol 2002;197:551-65 [DOI] [PubMed] [Google Scholar]
- 37. Fraser S, Grimes JA, Djamgoz MBA. Effects of voltage-gated ion channel modulators on rat prostatic cancer cell proliferation: comparison of strongly and weakly metastatic cell lines. Prostate 2000;44:61-76 [DOI] [PubMed] [Google Scholar]
- 38. Khaitan D, Sankpal UT, Weksler B, et al. Role of KCNMA1 gene in breast cancer invasion and metastasis to brain. BMC Cancer 2009;9:258. [DOI] [PMC free article] [PubMed] [Google Scholar]
- 39. Lian WN, Wu TW, Dao Rl, Chen YJ, Lin CH. Deglycosylation of Na+/K+-ATPase causes the basolateral protein to undergo apical targeting in polarized hepatic cells. J Cell Sci 2006;119:11-22 [DOI] [PubMed] [Google Scholar]
- 40. Vagin O, Turdikulova S, Tokhtaeva E. Polarized membrane distribution of potassium-dependent ion pumps in epithelial cells: different roles of the N-glycans of their beta subunits. Cell Biochem Biophys 2007;47:376-91 [DOI] [PubMed] [Google Scholar]
- 41. Foster CS. Functional aspects of glycoprotein N-linked oligosaccharide processing by human tumors. Br J Cancer 1990;62:57-63 [PMC free article] [PubMed] [Google Scholar]
- 42. Wu J, Zhang B, Wu M, et al. Screening of a PKC zeta-specific kinase inhibitor PKCz1257.3 which inhibits EGF-induced breast cancer cell chemotaxis. Invest New Drugs March 27 2009. [Epub ahead of print] [DOI] [PubMed] [Google Scholar]
- 43. Coghlan MP, Chou MM, Carpenter CL. Atypical protein kinases Cλ and -ζ associate with the GTP-binding protein Cdc42 and mediate stress fiber loss. Mol Cell Biol 2000;20:2880-9 [DOI] [PMC free article] [PubMed] [Google Scholar]
- 44. Liu XJ, Yang C, Gupta N, Zuo J, Chang YS, Fang FD. Protein kinase C–zeta regulation of GLUT4 translocation through actin remodelling in CHO cells. J Mol Med 2007;85:851-61 [DOI] [PubMed] [Google Scholar]
- 45. Wang HR, Zhang Y, Ozdamar B, et al. Regulation of cell polarity and protrusion formation by targeting RhoA for degradation. Science 2003;302:1775-9 [DOI] [PubMed] [Google Scholar]
- 46. Even-Faitelson L, Ravid S. PAK1 and a PKCzeta regulate myosin II-B phosphorylation: a novel signaling pathway regulating filament assembly. Mol Biol Cell 2006;17:2869-81 [DOI] [PMC free article] [PubMed] [Google Scholar]
- 47. Etienne-Manneville S. Polarity proteins in migration and invasion. Oncogene 2008;27:6970-80 [DOI] [PubMed] [Google Scholar]
- 48. Suzuki A, Ohno S. The PAR-aPKC system: lessons in polarity. J Cell Sci 2006;119:979-87 [DOI] [PubMed] [Google Scholar]
- 49. Etienne-Manneville S, Manneville JB, Nicholls S, Ferenczi MA, Hall A. Cdc42 and Par6-PKCzeta regulate the spatially localized association of Dig1 and APC to control cell polarization. J Cell Biol 2005;170:895-901 [DOI] [PMC free article] [PubMed] [Google Scholar]
- 50. Wang J, Wan W, Sun R, et al. Reduction of Akt2 expression inhibits chemotaxis signal transduction in human breast cancer cells. Cell Signal 2008;20:1025-34 [DOI] [PubMed] [Google Scholar]
- 51. Ozdamar B, Bose R, Barrios-Rodiles M, Wang HR, Zhang Y, Wrana JL. Regulation of the polarity protein Par6 by TGFbeta receptors controls epithelial cell plasticity. Science 2005;307:1603-9 [DOI] [PubMed] [Google Scholar]
- 52. Rodriguez EM, Dunham EE, Martin GS. Atypical protein kinase C activity is required for extracellular matrix degradation and invasion by Src-transformed cells. J Cell Physiol 2009;221:171-82 [DOI] [PMC free article] [PubMed] [Google Scholar]
- 53. Tak H, Jang E, Kim SB, et al. 14-3-3epsilon inhibits MK5-mediated cell migration by disturbing F-actin polymerization. Cell Signal 2007;19:2379-87 [DOI] [PubMed] [Google Scholar]
- 54. Doshi BM, Hightower LE, Lee J. The role of Hsp27 and actin in the regulation of movement in human cancer cells responding to heat shock. Cell Stress Chaperones 2009;14:445-57 [DOI] [PMC free article] [PubMed] [Google Scholar]
- 55. Gomez-Casero E, San-Antonio B, Iniquez MA, Fresno M. Cot/Tpl2 and PKCzeta cooperate in the regulation of the transcriptional activity of NFATc2 through the phosphorylation of its amino-terminal domain. Cell Signal 2007;19:1652-61 [DOI] [PubMed] [Google Scholar]
- 56. Teusch N, Lombardo E, Eddleston J, Knaus UG. The low molecular weight GTPase RhoA and atypical protein kinase Czeta are required for TLR2-mediated gene transcription. J Immunol 2004;173:507-14 [DOI] [PubMed] [Google Scholar]
- 57. Singh AP, Bafna S, Chaudhary K, et al. Genome-wide expression profiling reveals transcriptomic variation and perturbed gene networks in androgen-dependent and androgen-independent prostate cancer cells. Cancer Lett 2008;259:28-38 [DOI] [PMC free article] [PubMed] [Google Scholar]
- 58. Wang L, Tang H, Thayanithy V, et al. Gene networks and microRNAs implicated in aggressive prostate cancer. Cancer Res 2009;69:9490-7 [DOI] [PMC free article] [PubMed] [Google Scholar]
- 59. Boskovic J, Coloma J, Aparicio T, et al. Molecular architecture of the human GINS complex. EMBO Rep 2007;8:678-84 [DOI] [PMC free article] [PubMed] [Google Scholar]
- 60. Barkley LR, Song IY, Zou Y, Vaziri C. Reduced expression of GINS complex members induces hallmarks of pre-malignancy in primary untransformed human cells. Cell Cycle 2009;8:1577-88 [DOI] [PMC free article] [PubMed] [Google Scholar]
- 61. Truhlar SM, Torpey JW, Komives EA. Regions of IkappaBalpha that are critical for its inhibition of NF-kappaB. DNA interaction fold upon binding to NF-kappaB. Proc Nat Acad Sci U S A 2006;103:18951-6 [DOI] [PMC free article] [PubMed] [Google Scholar]
- 62. Guy M, Kote-Jarai Z, Giles GG, et al. Identification of new genetic risk factors for prostate cancer. Asian J Androl 2009;11:49-55 [DOI] [PMC free article] [PubMed] [Google Scholar]
- 63. Forootan SS, Bao ZZ, Forootan FS, et al. Atelocollagen-delivered siRNA targeting the FABP5 gene as an experimental therapy for prostate cancer in mouse xenografts. Int J Oncol 2009;36:69-76 [PubMed] [Google Scholar]
- 64. Goekjian PG, Jirousek MR. Protein kinase C inhibitors as novel anticancer drugs. Expert Opin Investig Drugs 2001;10:2117-40 [DOI] [PubMed] [Google Scholar]
- 65. Gonelli A, Mischiati C, Guerrini R, Voltan R, Salvadori S, Zauli G. Perspectives of protein kinase C (PKC) inhibitors as anti-cancer agents. Mini Rev Med Chem 2009;9:498-509 [DOI] [PubMed] [Google Scholar]
- 66. Herbst R, Oh Y, Wagle A, Lahn M. Enzastaurin, a protein kinase Cβ-selective inhibitor, and its potential application as an anticancer agent in lung cancer. Clin Cancer Res 2007;13:4641s-6s [DOI] [PubMed] [Google Scholar]
- 67. Fields AP, Frederick LA, Regala RP. Targeting the oncogenic protein kinase C iota signalling pathway for the treatment of cancer. Biochem Soc Trans 2007;35:996-1000 [DOI] [PubMed] [Google Scholar]
- 68. Whitson EL, Bugni TS, Chockalingam PS, et al. Spheciosterol sulfates, PKCzeta inhibitors from a Philippine sponge Spheciospongia sp. J Nat Prod 2008;71:1213-7 [DOI] [PMC free article] [PubMed] [Google Scholar]
- 69. Yuan L, Seo JS, Kang NS, et al. Identification of 3-hydroxy-2-(3-hydroxyphenyl)-4H-1-benzopyran-4-ones as isoform-selective PKC-zeta inhibitors and potential therapeutics for psychostimulant abuse. Mol Biosyst 2009;5:927-30 [DOI] [PMC free article] [PubMed] [Google Scholar]
- 70. Tatsuda Y, Iguchi K, Usui S, Suzui M, Hirano K. Protein kinase C is inhibited by bisphosphonates in prostate cancer PC-3 cells. Eur J Pharmacol 2010;627:348-53 [DOI] [PubMed] [Google Scholar]
- 71. Roffey J, Rosse C, Linch M, Hibbert A, McDonald NQ, Parker PJ. Protein kinase C intervention: the state of play. Curr Opin Cell Biol 2009;21:268-79 [DOI] [PubMed] [Google Scholar]
- 72. Spurdle AB, Couch FJ, Hogervorst FB, Radice P, Sinilnikova OM; IARC Unclassified Genetic Variants Working Group Prediction and assessment of splicing alterations: implications for clinical testing. Hum Mutat 2008;29:1304-13 [DOI] [PMC free article] [PubMed] [Google Scholar]
- 73. Wulff H, Castle NA, Pardo LA. Voltage-gated potassium channels as therapeutic targets. Nat Rev Drug Discov 2009;8:982-1001 [DOI] [PMC free article] [PubMed] [Google Scholar]
- 74. Faratian D, Langdon SP, Harrison DJ. How can systems pathology help us personalize cancer therapy? Discov Med 2009;8:81-6 [PubMed] [Google Scholar]
- 75. Honma Y, Akimoto M. Therapeutic strategy using phenotypic modulation of cancer cells by differentiation-inducing agents. Cancer Sci 2007;98:1643-51 [DOI] [PMC free article] [PubMed] [Google Scholar]
- 76. Monks NR, Pardee AB. Targeting the NF-kappa B pathway in estrogen receptor negative MDA-MB-231 breast cancer cells using small inhibitory RNAs. J Cell Biochem 2006;98:221-33 [DOI] [PubMed] [Google Scholar]
- 77. Nadiminty N, Dutt S, Tepper C, Gao AC. Microarray analysis reveals potential target genes of NF-kappaB2/p52 in LNCaP prostate cancer cells. Prostate 2010;70:276-87 [DOI] [PubMed] [Google Scholar]
- 78. Eastham MA, Kattan MW, Fearn P, et al. Local progression among men with conservatively treated localized prostate cancer: results from the Transatlantic Prostate Group. Eur Urol 2008;53:347-54 [DOI] [PMC free article] [PubMed] [Google Scholar]
- 79. van Diest PJ, van Dam P, Henzen-Logmans SC, et al. A scoring system for immunohistochemical staining: consensus report of the task force for basic research of the EORTC-GCCG. J Clin Pathol 1997;50:801-4 [DOI] [PMC free article] [PubMed] [Google Scholar]
- 80. Berney DM, Gopalan A, Kudahetti S, et al. Ki-67 and outcome in clinically localised prostate cancer: analysis of conservatively treated prostate cancer patients from the Trans-Atlantic Prostate Group study. Br J Cancer 2009;100:888-93 [DOI] [PMC free article] [PubMed] [Google Scholar]
- 81. Smith P, Rhodes NP, Beesley C, Ke Y, Foster CS. Prostatic stromal cell phenotype is directly modulated by norepinephrine. Urology 1998;51:663-70 [DOI] [PubMed] [Google Scholar]
- 82. Jing C, Beesley C, Foster CS, et al. Identification of the messenger RNA for human cutaneous fatty acid-binding protein as a metastasis-inducer. Cancer Res 2000;60:2390-8 [PubMed] [Google Scholar]
- 83. Olsen MW, Ley CD, Junker N, Hansen AJ, Lund EL, Kristiansen PE. Angiopoietin-4 inhibits angiogenesis and reduces interstitial fluid pressure. Neoplasia 2006;8:364-72 [DOI] [PMC free article] [PubMed] [Google Scholar]
- 84. Steck PA, Nicolson GL. Cell surface properties of spontaneously metastasizing rat mammary adenocarcinoma cell clones. Transplant Proc 1984;16:355-60 [PubMed] [Google Scholar]
- 85. Guo HB, Lee I, Bryan BT, Pierce M. Deletion of mouse embryo fibroblast N-acetylglucosaminyltransferase V stimulates alpha5beta1 integrin expression mediated by the protein kinase C signaling pathway. J Biol Chem 2005;280:8332-42 [DOI] [PubMed] [Google Scholar]
- 86. Shaaban AM, O’Neill PA, Davies MPA, et al. Declining estrogen receptor beta expression defines malignant progression of human breast neoplasia. Am J Surg Pathol 2003;27:1502-12 [DOI] [PubMed] [Google Scholar]
- 87. Bashir I, Sikora K, Foster CS. Cell-surface oligosaccharides expressed by phenotypically distinct sublines of the Dunning 3327 rat prostate cancer. Biochem Soc Trans 1990;18:968-9 [DOI] [PubMed] [Google Scholar]
- 88. Sharpe JC, Abel PD, Gilbertson JA, Brawn P, Foster CS. Modulated expression of human leukocyte antigen class I and class II determinants in hyperplastic and malignant human prostatic epithelium. Br J Urol 1994;74:609-16 [DOI] [PubMed] [Google Scholar]
- 89. Ritchie ME, Silver J, Oshlack A, et al. A comparison of background correction methods for two-colour microarrays. Bioinformatics 2007;23:2700-7 [DOI] [PubMed] [Google Scholar]
- 90. Smyth GK, Speed T. Normalization of cDNA microarray data. Methods 2003;31:265-73 [DOI] [PubMed] [Google Scholar]
- 91. Gentleman RC, Carey VJ, Bates DM, et al. Bioconductor: open software development for computational biology and bioinformatics. Genome Biol 2004;5:R80. [DOI] [PMC free article] [PubMed] [Google Scholar]
- 92. Smyth G. Linear models and empirical Bayes methods for assessing differential expression in microarray experiments. Stat Appl Genet Mol Biol 2004;3:Article 3 [DOI] [PubMed] [Google Scholar]
- 93. Benjamini Y, Hochberg Y. Controlling the false discovery rate: a practical and powerful approach to multiple testing. J Stat Soc Ser B 1995;57:289-300 [Google Scholar]
- 94. Falcon S, Gentleman RC. Using GOstats to test gene lists for GO term association. Bioinformatics 2007;23:257-8 [DOI] [PubMed] [Google Scholar]
Associated Data
This section collects any data citations, data availability statements, or supplementary materials included in this article.