

Abstract
The transverse relaxation times (T2) and concentrations of Ascorbate (Asc) and glutathione (GSH) were measured from a single dataset of double-edited spectra that were acquired at several TEs at 4 T in the human brain. Six TEs between 102 and 152 ms were utilized to calculate T2 for the group of 12 subjects scanned five times each. Spectra measured at all six TEs were summed to quantify the concentration in each individual scan. LCModel fitting was optimized for the quantification of the Asc and GSH double-edited spectra. When the fitted baseline was constrained to be flat, T2 was found to be 67 ms (95% confidence interval, 50–83 ms) for GSH and ≤115 ms for Asc using the sum of spectra measured over 60 scans. The Asc and GSH concentrations quantified in each of the 60 scans were 0.62 ± 0.08 and 0.81 ± 0.11 μmol/g [mean ± standard deviation (SD), n = 60], respectively, using 10 μmol/g N-acetylaspartate as an internal reference and assuming a constant influence of N-acetylaspartate and antioxidant T2 relaxation in the reference solution and in vivo. The T2 value of GSH was measured for the first time in the human brain. The data are consistent with short T2 for both antioxidants. These T2 values are essential for the absolute quantification of Asc and GSH concentrations measured at long TE, and provide a critical step towards addressing assumptions about T2, and therefore towards the quantification of concentrations without the possibility of systematic bias.
Keywords: ascorbate, glutathione, brain, human, MRS, LCModel, T2
INTRODUCTION
1H MRS provides a noninvasive means to quantify metabolite concentrations in the human brain (1). However, the reliability of quantification for a given metabolite is limited when its concentration is low or its resonances are overlapped by strong resonances from other compounds (2). Spectral editing can be used to uncover weakly represented, overlapped resonances in the human brain in vivo (1). To selectively edit out undesirable resonances whilst retaining the resonance of interest, selective pulses and/or delays are introduced into the radiofrequency (RF) train that generates the 1H MRS signal (3), which lengthens TE. Thus, the intensity of an edited 1H MRS resonance is influenced not only by the concentration of the metabolite, but also by its transverse relaxation rate (T2) (4). Typically, T2 is assumed to be equivalent across experimental conditions, such that transverse relaxation should have a negligible influence on the measured differences in concentration (5). However, a knowledge of T2 is necessary for the accurate quantification of metabolite concentrations measured at long TE, and helps to confirm that differences in resonance intensities measured under different experimental conditions truly arise from differences in concentration.
Resonances from the two most concentrated nonenzymatic antioxidants in the human central nervous system, ascorbate (vitamin C, Asc) and glutathione (GSH), can be resolved from overlapping contributions, yet retained in the same double-edited 1H MR spectrum measured from the human brain in vivo (6). Previously reported Asc and GSH concentrations measured via LCModel analysis of MEGA-PRESS-edited spectra (MEGA-PRESS, MEGA-point-resolved spectroscopy) are in good agreement with those measured from short-TE 1H MRS in the human brain in vivo (6–9) and from high-performance liquid chromatography in the rat brain ex vivo (10–12), suggesting that the methodology and stated assumptions about T2 (7) facilitate reliable quantification.
The goals of this study were to determine both the T2 values and concentrations of Asc and GSH in the human brain from a single dataset. Double editing with (DEW) MEGA-PRESS was extended for the detection of Asc and GSH at six TEs spanning 102–152 ms. Spectra measured at each separate TE were summed over all subjects to calculate T2, and spectra measured at all TEs in a given individual were summed to quantify the concentration. Double-edited spectra were quantified using LCModel with optimized input parameters for estimation of a flat baseline.
METHODS
Protocol
All double-edited spectra were measured using a 4-T, 90-cm bore magnet (Oxford Magnet Technology, Oxford, UK) interfaced to a Varian INOVA spectrometer (Varian, Palo Alto, CA, USA) and using a surface 1H quadrature transceiver (13). Eleven healthy volunteers (eight females and three males; average age, 23 years) gave informed consent for this study, which was conducted according to the procedures approved by the human subjects’ protection committee at the University of Minnesota. Each subject was scanned between four and five scanning sessions over 24 h, except for one subject who participated in two separate series of five scanning sessions, for a total of 60 scans. Each time, the subject was positioned supine inside the magnet with the RF transceiver subjacent to the occipital lobe. The protocol for each scan began with localizer multislice rapid acquisition with relaxation enhancement (RARE) images (TR = 4.0 s; TE = 60 ms; echo train length, 8; matrix, 256 × 128; two averages; slice thickness, 2 mm; five slices) to select a cubic volume of interest (volume of interest, 3 × 3 × 3 cm3) centered on the midsagittal plane in the occipital lobe. Adjustment of all first- and second- order shim currents was achieved using FASTMAP (fast automatic shimming technique by mapping along projections) with echo planar imaging readout (14,15).
Homonuclear editing
Double editing for Asc and the cysteine residue of GSH (2.95 ppm) was achieved via DEW MEGA-PRESS as described previously (6). Water suppression (16) and outer volume saturation were applied. Slice-selective excitation was achieved using a 2-ms sinc RF pulse with a bandwidth (full width at half-maximum) of 2.0 kHz (γB1 = 706 Hz). Slice-selective refocusing used a 3-ms sinc RF pulse with a bandwidth of 1.5 kHz (γB1 = 942 Hz). Six edited spectra were collected at TR = 4500 ms and TE = 102, 112, 122, 132, 142 and 152 ms for each scan. Shorter editing pulses accommodated measurement at shorter TE. Longer editing pulses were feasible at longer TE. However, the inverse relationship between pulse length and bandwidth led to the excitation of a broader range of frequencies with shorter editing pulses. Because the ideal center frequency of the editing pulse, i.e. 4.01 ppm, is very close to the chemical shift of the Asc resonance to be observed, i.e. 3.73 ppm, utilization of an editing pulse with an excessively broad bandwidth would cause contamination of the Asc signal by overlapping signals from glutamine, glutamate and the glycine residue of GSH (17). To avoid this contamination, the center frequency of each short editing pulse was shifted away from 4.01 ppm, even though the strength of the edited signal (i.e. editing efficiency) was reduced (12). The center frequency of each editing pulse was set so that less than 1% of the signal was perturbed within 10 Hz of 3.73 ppm. As such, Gaussian editing pulses were set at 4.18, 4.13, 4.10, 4.06, 4.04 and 4.01 ppm for pulse lengths of 35, 40, 45, 50, 55 and 60 ms, respectively. Gaussian editing pulses for GSH were all set at 4.56 ppm. Their lengths were set the same as those used for Asc. The RF power (B1) of the 40-ms editing pulse was calibrated by placing the center frequency on water and increasing B1 until the resonance from water was minimized (18). The B1 values for the other editing pulses were calculated relative to the B1 value of the 40-ms editing pulse based on the well-known relationship between pulse length and power required to achieve inversion. The chemical shift of the editing pulse was adjusted whenever the B0 drift exceeded ± 10 Hz. This avoided contamination of the edited Asc resonance (19) and kept the Asc editing efficiency loss below 8%. Ninety-six individual free induction decays (FIDs) were acquired at each TE in an interleaved fashion. All 576 FIDs were acquired in 45 min. The entire scan took approximately 1.5 h per session. The spectral width was 6000 Hz and 4035 complex points were acquired for each spectrum. Each single FID was stored separately in memory, and the frequency and phase of each FID were corrected on the basis of the NAA methyl signal prior to summation (20).
Spectral fitting and calculation of T2
To calculate T2 for the group, the DEW MEGA-PRESS-edited spectra measured at each TE from all 60 scans and subjects were phase and frequency corrected, and then summed. Then, for each TE, LCModel version 6.2 was used to measure the strengths of all signals [i.e. resonances from Asc, GSH, glycerophosphorylethanolamine, myoinositol (Ins), lactate (Lac), N-acetylaspartate (NAA), phosphorylcholine (PC) and phosphorylethanolamine (PE)] appearing in the edited spectrum (21). Basis spectra were simulated at each TE using the quantum mechanics density matrix formalism with published values of J-coupling constants and chemical shifts (6,17,22). These simulations were performed using Matlab and home-written programs (22). Crusher gradients were simulated by performing simulations across a large range of different frequency offsets, and then averaging the resulting magnetization. Shaped pulses were simulated as a series of square pulses. Frequency offset was taken into account in the Hamiltonian, using H = ΩIz, where Ω is the frequency offset for spin I. Slice-selective pulses were simulated without gradient in order to reduce the computation time, which amounted to neglecting the effect of chemical shift displacement on the J-coupled spins. To test the simulation accuracy, basis spectra were also measured in solution. The concentrations quantified using simulated and measured basis spectra to analyze a set of five in vivo double-edited spectra were not statistically significantly different (p > 0.05) (6). The simulated basis spectra characterized the intensity and modulation of the edited resonances that would be measured at each TE in the absence of T2 relaxation, as T2 relaxation was not simulated and was thus not reflected in the basis spectra. The signal strength measured by LCModel is fundamentally a quantitative comparison of the experimental spectrum with the basis spectrum. Thus, reduction in the signal measured by LCModel for a given metabolite (i.e. Asc or GSH) with increasing TE can be attributed to T2 relaxation, as has been demonstrated for J-coupled compounds using none-dited high-resolution spectra measured from the rat brain in vivo at 9.4 T (23). The conceptual and practical accuracies of our approach were tested by measuring T2 of compounds for which values are available in the literature. Exactly the same methods were applied, except that summed (i.e. nonedited), instead of subtracted (i.e. edited), spectra were used. For LCModel analysis of summed spectra, NAA, creatine (Cr) and choline (Cho) were included in the basis set. In this study, LCModel analysis was optimized by constraining the baseline to be flat (via the ALPBMN parameter in LCModel). For comparison with prior findings, data were also fitted using a spline function to model the baseline (controlled by setting the node spacing parameter, DKNTMN, to 99).
Asc and GSH signal strengths calculated by LCModel as a function of TE were supplied as input to fit the monoexponential decay function of eqn (1) using a non-negative least-squares algorithm:
| (1) |
In eqn (1), A symbolizes the signal strength measured by LCModel at each TE. A0 represents the signal strength at TE = 0 ms and was fitted together with T2. T2 and the corresponding 95% confidence interval (CI) (t distribution) were calculated for each of the model specifications (i.e. with a spline or a flat baseline).
The precision that could be anticipated for the calculation of T2 from the signal strengths measured at six long TEs spanning a limited range was assessed using Monte-Carlo simulations. Simulations were performed assuming nine different actual values of T2 ranging from 25 to 400 ms. For each actual value of T2, the signal was computed theoretically [eqn (1)] at each of the TEs used in the in vivo experiment (from 102 to 152 ms in steps of 10 ms). For each of 500 iterations per actual value of T2, random noise (constrained with 5% or 10%) was added to the theoretically computed signal intensity at each TE, and T2 was fitted to the noised points with the two-parameter, single-exponential function [eqn (1)]. The associated SD was also determined based on the goodness of the nonlinear fit. The average of the SDs of T2 from all 500 iterations, divided by the average fitted T2 from these 500 iterations, was computed as an estimate of the achievable precision for a given T2; 500 iterations were used to avoid bias.
Quantification of concentration
To quantify the Asc and GSH concentrations for each single scanning session, spectra measured at all six TEs were summed. The basis spectrum for each metabolite was created by summing the basis spectra simulated at all six TEs after weighting them for in vivo T2 relaxation [56 ms for Asc, 67 ms for GSH and 190 ms for all of the other compounds based on values measured in this study and literature values for similar compounds (24)]. Spectra were fitted using LCModel under both model specifications, i.e. constraining the baseline to be flat and using a spline function. Concentrations were calculated using 10 μmol/g NAA as an internal reference as described previously (6). The calculation of in vivo Asc and GSH (antioxidant) concentrations was based on the assumption that differences between the T2 relaxation of NAA and the T2 relaxation of the antioxidant had the same impact on the resonance intensity in vitro and in vivo, i.e. the ratio exp[−TE/T2(NAA)]/exp[−TE/T2(antioxidant)] was approximately the same under in vitro and in vivo conditions. Deviation from this assumption would result in a systematic overestimation or underestimation of the measured antioxidant concentration for all scans.
RESULTS
The double-edited spectra summed over all 60 scans at each TE (102, 112, 122, 132, 142 and 152 ms) are shown in Fig. 1, together with the corresponding simulated Asc and GSH basis spectra. The modulated resonance patterns measured in vivo were in good agreement with the simulated patterns at every TE. The ppm scale for the in vivo spectra is shifted slightly because it was taken from the LCModel output. The reference frequency is fitted by LCModel. The simulated resonances were also in good agreement with resonances measured from pure solutions at higher spectral resolution (Fig. 2). Appreciable Asc and GSH resonances were detected simultaneously at all TEs in vivo. The counterintuitive increase in the intensity of the Asc resonance with increasing TE (Fig. 1) is a result of the increasing editing efficiency that occurs with lengthening TE, as described in Methods. The simulated spectra characterize the resonance amplitudes that would be measured in the absence of transverse relaxation. The decrease in the in vivo signal strength relative to the simulated signal strength that was measured via LCModel with increasing T2 was attributed to T2 relaxation. Transverse relaxation of GSH is apparent in vivo via the rapid decline in the amplitude of the resonance measured in vivo when compared with the relatively constant amplitude that was simulated. J-modulation was particularly evident in co-edited resonances from Ins, Lac, PC, PE and the aspartyl moiety of NAA (17).
Figure 1.

Ascorbate (Asc) and glutathione (GSH) double-edited spectra measured from the human occipital cortex in vivo (TR = 4500 ms; number of excitations, 96 per TE summed over 60 scans; volume of interest, 3 × 3 × 3 cm3) (top) and simulated at all six TEs (bottom). Spectra are shown with constant scaling per mode of generation (i.e. measured vs simulated). The first simulated Asc resonance is normalized to match the in vivo Asc resonance at the same TE (102 ms). In like fashion, the first simulated GSH resonance is normalized to match the in vivo GSH resonance at the same TE (102 ms). Simulated spectra were apodized to match the measured spectra (no apodization). The phosphorylcholine (PC) resonances are not labeled when its contribution was negligible. Ins, myoinositol; PE, phosphorylethanolamine; NAA, N-acetylaspartate.
Figure 2.

Spectra measured (using the techniques described in Methods from a 3 × 3 × 3-cm3 volume of interest positioned in the same location relative to the coil as in vivo) and simulated over an extended range of TE: (a) TE = 69 ms (using a 20-ms Gaussian editing pulse set to invert at 4.45 ppm); (b) TE = 89 ms (using a 30-ms Gaussian editing pulse set at 4.23 ppm); (c) TE = 112 ms; (d) TE = 132 ms; (e) TE = 152 ms; (f) TE = 172 ms (using a 70-ms Gaussian editing pulse set at 4.01 ppm). Spectra were measured from a phantom containing 36 mM ascorbate (Asc), 18 mM glutathione (GSH) and 100 mM NaCl, so that radiofrequency coil loading was analogous to that in in vivo experiments.
Figure 3 illustrates the sum of spectra measured at all six TEs relative to that measured at 112 ms in one single scanning session. The amplitudes of the Asc and GSH resonances are nearly equivalent when normalized for the scan time. However, the amplitudes of the co-edited NAA, PE and Ins resonances are reduced in the TE-averaged spectrum.
Figure 3.

Ascorbate (Asc) and glutathione (GSH) double-edited spectra measured from the human occipital cortex of one individual in one MRI scanning session (TR = 4500 ms; volume of interest, 3 × 3 × 3 cm3). Top: sum of spectra measured at all six TEs spanning 102–152 ms (number of excitations, 96 per TE). Bottom: Asc and GSH double-edited spectrum measured at the originally proposed TE of 112 ms (6) (number of excitations, 96) multiplied by a factor of six for comparison with the multiple TE spectrum.
Figure 4 illustrates LCModel analysis of the in vivo spectrum measured at TE = 132 ms using the two different LCModel specifications: spline and flat baseline. A close match between the LCModel fit and the in vivo-edited spectrum was achieved for both model specifications, as evidenced by the relatively small fitted residuals. The average Cramer–Rao lower bound (CRLB) estimate of the measurement error for all TEs for Asc was 7.8% when the baseline was fitted with a spline function and 5.5% when the baseline was held flat. The average CRLB for GSH was 5.3% when the baseline was fitted with a spline function and 5.6% when the baseline was held flat.
Figure 4.

Illustration of how the model specification impacts on the fitting, i.e. LCModel analysis of a representative in vivo spectrum at a representative TE summed over all scans and subjects (same as Fig. 1 at TE = 132 ms). (a) Analysis using a spline baseline. (b) Analysis using a flat baseline. The following are shown in each case. Top: the fitted residual. Middle: superimposed in vivo data (gray); overall fit (black). Bottom: fitted baseline. Asc, ascorbate; GSH, glutathione.
Table 1 lists the Asc and GSH T2 values calculated using signal strengths quantified using both the spline and flat baseline model specifications. Confidence in GSH T2 was better than that of Asc in both cases. Allowing freedom to the spline function degraded the 95% CI for T2 of both Asc and GSH. Figure 5 illustrates the fit of the Asc and GSH signal strengths measured at all TEs to an exponential (i.e. T2) decay [i.e. eqn (1)] when the data were modeled with a flat baseline. The T2 values measured from the summed spectra were 205 ms (95% CI, 184–226 ms) for NAA, 109 ms (95% CI, 103–115 ms) for Cr and 203 ms (95% CI, 149–257 ms) for Cho.
Table 1.
T2 (ms) of ascorbate (Asc) and glutathione (GSH) and their confidence intervals (CIs) calculated using Asc and GSH signal strengths measured with two different baseline specifications for LCModel
| Baseline | T2 | Low 95% CI | High 95% CI | |
|---|---|---|---|---|
| Asc | Spline | 883.03 | −44262.1 | 6192.27 |
| Flat | 55.7 | −3.60 | 115.00 | |
| GSH | Spline | 73.88 | 40.8 | 106.97 |
| Flat | 66.71 | 50.34 | 83.08 |
Figure 5.

Results of monoexponential fitting to calculate T2 [eqn (1)]. Glutathione (GSH) and ascorbate (Asc) signal strengths were measured at each TE with LCModel constrained to use a flat baseline. Insets: expansion of the pertinent TE range with added illustration of Cramer–Rao lower bound (CRLB) estimates of measurement error for each data point.
The impacts on the concentration caused by the measurement of spectra at a longer TE and by the optimization of the LCModel specifications were evaluated separately. Asc and GSH concentrations were quantified from the sum of the spectra measured at all six TEs in each of the 60 individual scans using both the traditional (6) and updated LCModel specifications. The average concentrations of Asc and GSH quantified using LCModel as described previously (6), i.e. with a spline baseline, were 0.49 ± 0.06 and 0.71 ± 0.08 μmol/g (mean ± SD, n = 60), respectively. However, the Asc and GSH concentrations quantified using LCModel found to be optimal in the present study, i.e. with a flat baseline, were slightly higher, i.e. 0.62 ± 0.08 and 0.81 ± 0.11 μmol/g (mean ± SD, n = 60), respectively. The concentrations quantified from all five scans for each person were averaged to compute the average concentration for each person. The SDs of these average concentrations were 0.08 μmol/g for Asc and 0.13 μmol/g for GSH.
Monte-Carlo simulations (Fig. 6) showed that, for a given root-mean-square noise level, T2 was estimated with the best precision when it was in the same range as the TE value over which the signal strengths were detected. The substantial difference between the 5% and 10% noise level curves emphasizes the critical role played by the accuracy of determination of the signal strength in the calculation of T2. For example, if the signal strength at each TE can be measured within a 5% noise level, an actual T2 in the range 60–400 ms can be calculated within a 20% SD. However, if the signal strength at each TE can only be measured within a 10% noise level, the ability to quantify T2 degrades substantially. The fitted T2 values were biased for T2 ≤ 75 ms at the 10% root-mean-square noise level (not shown). The finding of an unreliable calculation of short T2 is consistent with the relatively flat signal amplitude curve (Fig. 5) at long TE (i.e. 100–150 ms) for short T2 (<60 ms).
Figure 6.
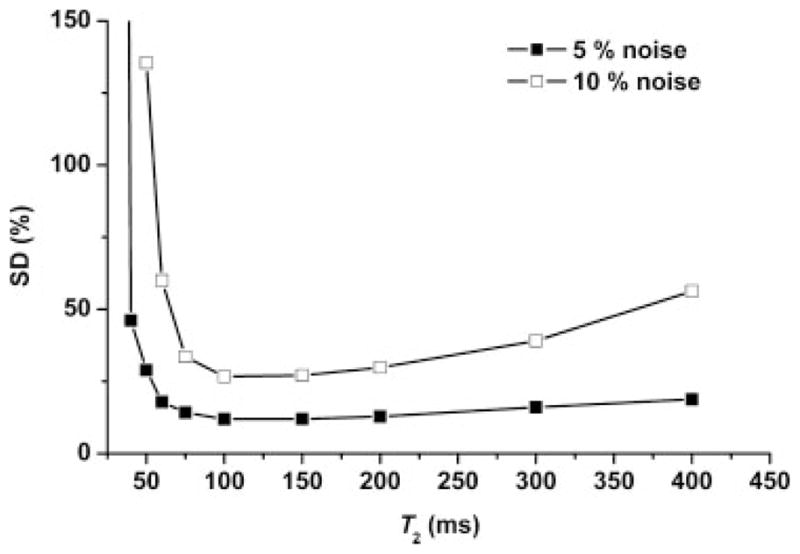
Monte-Carlo simulation of the precision [average of the standard deviations (SDs) of T2 from all 500 iterations divided by the average fitted T2 from these 500 iterations expressed in units of percentage] with which T2 (x axis) can be calculated from spectra measured over the limited range of TE used in this study. The two different root-mean-square noise levels (5% and 10%) reflect uncertainty in the quantification of the signal strength at each individual TE.
DISCUSSION
In this study, T2 relaxation times and concentrations were obtained from the same double-edited Asc and GSH spectra measured at six distinct TEs in the human brain in vivo. Double-edited Asc and GSH resonances were detected appreciably over a sufficiently large range of TE to estimate T2 in vivo. The T2 values of major signals (i.e. NAA, Cr and Cho), measured using an analogous approach, were in reasonable agreement with the range of literature values (25,26). The T2 value of GSH was calculated as 67 ms with practicable certainty in the human brain at 4 T, and the Asc T2 value was estimated to be less than 115 ms. The GSH T2 value, which was measured recently without editing in the rat brain (23), 106 ± 23 ms (mean ± SD), was within the error of the GSH T2 value measured in the human brain in this study. To our knowledge, this is the first time that the in vivo T2 values of Asc and GSH have been reported in the human brain. They are shorter than those reported for other brain metabolites at 4 T (24,27). Moreover, summing the double-edited spectra measured at several TEs during a single scanning session resulted in spectral simplification and a flatter baseline without any loss of Asc or GSH signal intensity (Fig. 3). As such, a double-edited Asc and GSH spectrum can comprise components measured at several TEs without sacrificing the data information content relative to that measured at the originally proposed TE of 112 ms (6). Although differences between the measured and simulated spectra (Fig. 2) appeared to be negligible at the in vivo linewidth (Fig. 1), it is possible that more sophisticated simulations could improve the quantification of the concentrations and T2. Accounting for the B1 profile across the voxel and slice selection would improve simulation.
The concentrations measured employing the basis spectra generated using T2 values at the extremes of the 95% CIs (50 and 83 ms for GSH, 115 ms for Asc) were within 1% of those obtained with basis spectra generated using the T2 values measured in this study (67 ms for GSH and 56 ms for Asc). The concentrations measured to represent an Asc T2 value approaching zero (i.e. using purely the 102 ms basis spectrum) were only 14% different and were highly correlated (r2 = 0.9) with the original values (i.e. concentrations quantified employing basis spectra generated using T2 = 56 ms). Using different T2 values to construct the basis spectra had a small influence, because multiplet patterns of Asc and GSH are similar at all six TEs (Fig. 1). When multiplet patterns are modulated substantially with TE, greater certainty in T2 is needed to construct the correct basis spectra. The fitted residuals near 3.3 and 2.5 ppm probably originate from poorly constructed basis spectra for Ins, PE and NAA. However, these residuals were resolved from Asc and GSH, and so had a negligible influence on Asc and GSH quantification.
The concentrations quantified at multiple TEs in this study ([Asc] = 0.49 ± 0.06 μmol/g, [GSH] = 0.71 ± 0.08 μmol/g, mean ± SD, n = 60) were smaller than those measured previously (6) at TE = 112 ms ([Asc] = 0.84 ± 0.11 μmol/g, [GSH] = 1.02 ± 0.09 μmol/g) when data were processed in a completely analogous fashion and were not corrected for T2. The lower signal intensity quantified at multiple TEs can be expected, given the fast T2 relaxation of Asc and GSH calculated in this study and the longer average TE at which the multiple TE spectra were measured. The concentrations quantified when the control parameters for LCModel were updated according to this study (i.e. constraining to a flat baseline) increased slightly. This increase most probably reflects the improved accuracy of LCModel specification as, when data were fitted using a spline baseline, some of the Asc and GSH signal was inaccurately attributed to the spline baseline. Accurate measurement of T2 is a critical step required to eliminate the need for assumptions about T2, and to quantify the concentration without the possibility of systematic bias.
Constraining the baseline to be flat resulted in an improved adherence of the measured signal strengths to the phenomenon of transverse relaxation, and this adherence increased the accuracy of the quantification of T2. In this study, a subtle change in the LCModel specification (constraining the baseline to be flat) dramatically affected the CIs for the calculation of Asc and GSH T2 (Table 1), yet CRLB estimates of the measurement error and fitted residuals gave no indication of such improvement. A fundamental difference between edited spectra and short-TE spectra, which LCModel was designed to analyze, is that large unexpected distortions, such as residual water, macromolecule or lipid signals, which must be modeled by a spline baseline for short-TE spectra (23), are not present in edited spectra, i.e. at long TE (24). Constraining the baseline to be flat reduced the CRLB estimate of the measurement error for Asc. At the chemical shift of the edited Asc resonance (i.e. 3.73 ppm), allowing the baseline to deviate from flat to a spline function caused the misassignment of some of the Asc signal to the baseline. This effect was more pronounced at shorter TE, which degraded the calculation of Asc T2 (Fig. 5, Table 1). The better certainty with which T2 of GSH was fitted, relative to T2 of Asc, may be related to the absence of contributions from macromolecules in the vicinity of the edited GSH resonance (2.95 ppm) (9) vs potential small contributions from macromolecules in the vicinity of the edited Asc resonance (3.73 ppm) (19). Another potential source of different bias at each TE for Asc is the marked modulation of the co-edited PE and Ins resonances which partially overlap with the edited Asc resonance at several TEs (Fig. 1). The tighter CIs over which T2 vales were calculated (Table 1) when the baseline was held flat affirm that this model specification leads to more reliable quantification.
Figure 6 shows that, if the T2 values for a given compound are in the range 60–400 ms, they can be measured with reasonable certainty (i.e. ≤60% SD) given the TE range used in this study if the accuracy of determination of the signal strength at each TE is within a 10% root-mean-square noise level. However, if the accuracy of determination of the signal strength at each TE is degraded (i.e. noise is increased), or if the actual T2 values are shorter, uncertainty in the calculation of T2 (i.e. SD) will increase rapidly. The CRLB estimate of the measurement error achieved for the quantification of the Asc and GSH signal strengths at each TE in this study, i.e. 5–8%, is bounded by the noise levels depicted in Fig. 6. As such, the 95% CI over which the GSH T2 of 67 ms was measured (i.e. 25%, Table 1) is consistent with the Monte-Carlo prediction (i.e. ~25% SD). Similarly, the ~100% uncertainty with which the Asc T2 was measured (at 95% CI, Table 1) is consistent with the predicted SD for an actual T2 ≤ 56 ms, although a large uncertainty in the calculation of T2 could also arise from a degradation in the accuracy with which the Asc signal strength is determined at each TE (i.e. increased noise via bias), independent of Asc T2.
CONCLUSIONS
The detection of double-edited 1H MRS Asc and GSH resonances at several TEs has been demonstrated in the human brain. From these resonances, the T2 of Asc was estimated to be less than 115 ms, the T2 of GSH was calculated as 67 ms and the Asc and GSH concentrations were quantified. These measured T2 values can be used to improve the accuracy of the concentrations measured via edited spectroscopy. They can be employed to calculate the impact of the T2 relaxation of NAA and antioxidants on the resonance intensity in vitro and in vivo, and thus to circumvent systematic overestimation or underestimation of the concentrations that can occur when assumptions about T2 are applied. The methodology used in this study is also applicable to address whether T2 differs among experimental groups and brain regions.
Acknowledgments
We thank Ivan Tkac for assistance with the evaluation of the feasibility of this project. We appreciate the efforts made by the staff of the Center for Magnetic Resonance Research, Department of Radiology, University of Minnesota, Minneapolis, MN, USA to maintain spectrometer performance. This work was supported by National Institutes of Health contracts/grants R21-AG029582, P41-RR008079 and P30-NS057091.
Abbreviations used
- Asc
ascorbate
- Cho
choline
- CI
confidence interval
- Cr
creatine
- CRLB
Cramer–Rao lower bound
- DEW MEGA-PRESS
double editing with MEGA-point-resolved spectroscopy
- FASTMAP
fast automatic shimming technique by mapping along projections
- FID
free induction decay
- GSH
glutathione
- Ins
myo-inositol
- Lac
lactate
- NAA
N-acetylaspartate
- PC
phosphorylcholine
- PE
phosphorylethanolamine
- RARE
rapid acquisition with relaxation enhancement
- RF
radiofrequency
- SD
standard deviation
References
- 1.de Graaf RA. In Vivo NMR Spectroscopy: Principles and Techniques. John Wiley & Sons; New York: 2002. [Google Scholar]
- 2.Pfeuffer J, Tkac I, Provencher SW, Gruetter R. Toward an in vivo neurochemical profile: quantification of 18 metabolites in short-echo-time (1)H NMR spectra of the rat brain. J Magn Reson. 1999;141:104–120. doi: 10.1006/jmre.1999.1895. [DOI] [PubMed] [Google Scholar]
- 3.de Graaf RA. Spectral editing and two-dimensional NMR. In: de Graaf RA, editor. In Vivo NMR Spectroscopy: Principles and Techniques. 2. John Wiley & Sons; New York: 2008. pp. 389–440. [Google Scholar]
- 4.Yahya A. Metabolite detection by proton magnetic resonance spectroscopy using PRESS. Prog Nucl Magn Reson Spectrosc. 2009;55:183–198. [Google Scholar]
- 5.Kreis R, Ernst T, Ross BD. Development of the human brain: in vivo quantification of metabolite and water content with proton magnetic resonance spectroscopy. Magn Reson Med. 1993;30:424–437. doi: 10.1002/mrm.1910300405. [DOI] [PubMed] [Google Scholar]
- 6.Terpstra M, Marjanska M, Henry PG, Tkac I, Gruetter R. Detection of an antioxidant profile in the human brain in vivo via double editing with MEGA-PRESS. Magn Reson Med. 2006;56:1192–1199. doi: 10.1002/mrm.21086. [DOI] [PubMed] [Google Scholar]
- 7.Terpstra M, Uğurbil K, Tkáč I. Noninvasive quantification of human brain ascorbate concentration using 1H NMR spectroscopy at 7T. NMR Biomed. 2010;23:227–232. doi: 10.1002/nbm.1423. [DOI] [PMC free article] [PubMed] [Google Scholar]
- 8.Tkáč I, Öz G, Adriany G, Uğurbil K, Gruetter R. In vivo 1H NMR spectroscopy of the human brain at high magnetic fields: metabolite quantification at 4T vs. 7 T. Magn Reson Med. 2009;62:868–879. doi: 10.1002/mrm.22086. [DOI] [PMC free article] [PubMed] [Google Scholar]
- 9.Terpstra M, Henry PG, Gruetter R. Measurement of reduced glutathione (GSH) in human brain using LCModel analysis of difference-edited spectra. Magn Reson Med. 2003;50:19–23. doi: 10.1002/mrm.10499. [DOI] [PubMed] [Google Scholar]
- 10.Rice ME. Ascorbate regulation and its neuroprotective role in the brain. Trends Neurosci. 2000;23:209–216. doi: 10.1016/s0166-2236(99)01543-x. [DOI] [PubMed] [Google Scholar]
- 11.Rice ME, Russo-Menna I. Differential compartmentalization of brain ascorbate and glutathione between neurons and glia. Neuroscience. 1998;82:1213–1223. doi: 10.1016/s0306-4522(97)00347-3. [DOI] [PubMed] [Google Scholar]
- 12.Terpstra M, Tkac I, Rao R, Gruetter R. Quantification of vitamin C in the rat brain in vivo using short echo-time 1H MRS. Magn Reson Med. 2006;55:979–983. doi: 10.1002/mrm.20854. [DOI] [PubMed] [Google Scholar]
- 13.Adriany G, Gruetter R. A half-volume coil for efficient proton decoupling in humans at 4 tesla. J Magn Reson. 1997;125:178–184. doi: 10.1006/jmre.1997.1113. [DOI] [PubMed] [Google Scholar]
- 14.Gruetter R, Tkac I. Field mapping without reference scan using asymmetric echo-planar techniques. Magn Reson Med. 2000;43:319–323. doi: 10.1002/(sici)1522-2594(200002)43:2<319::aid-mrm22>3.0.co;2-1. [DOI] [PubMed] [Google Scholar]
- 15.Gruetter R. Automatic localized in vivo adjustment of all first- and second-order shim coils. Magn Reson Med. 1993;29:804–811. doi: 10.1002/mrm.1910290613. [DOI] [PubMed] [Google Scholar]
- 16.Tkac I, Starcuk Z, Choi IY, Gruetter R. In vivo 1H NMR spectroscopy of rat brain at 1ms echo time. Magn Reson Med. 1999;41:649–656. doi: 10.1002/(sici)1522-2594(199904)41:4<649::aid-mrm2>3.0.co;2-g. [DOI] [PubMed] [Google Scholar]
- 17.Govindaraju V, Young K, Maudsley AA, Proton NMR chemical shifts and coupling constants for brain metabolites. NMR Biomed. 2000;13:129–153. doi: 10.1002/1099-1492(200005)13:3<129::aid-nbm619>3.0.co;2-v. [DOI] [PubMed] [Google Scholar]
- 18.Mescher M, Merkle H, Kirsch J, Garwood M, Gruetter R. Simultaneous in vivo spectral editing and water suppression. NMR Biomed. 1998;11:266–272. doi: 10.1002/(sici)1099-1492(199810)11:6<266::aid-nbm530>3.0.co;2-j. [DOI] [PubMed] [Google Scholar]
- 19.Terpstra M, Gruetter R. 1H NMR detection of vitamin C in human brain in vivo. Magn Reson Med. 2004;51:225–229. doi: 10.1002/mrm.10715. [DOI] [PubMed] [Google Scholar]
- 20.Terpstra M, Ugurbil K, Gruetter R. Direct in vivo measurement of human cerebral GABA concentration using MEGA-editing at 7 Tesla. Magn Reson Med. 2002;47:1009–1012. doi: 10.1002/mrm.10146. [DOI] [PubMed] [Google Scholar]
- 21.Provencher SW. Automatic quantitation of localized in vivo 1H spectra with LCModel. NMR Biomed. 2001;14:260–264. doi: 10.1002/nbm.698. [DOI] [PubMed] [Google Scholar]
- 22.Henry PG, Marjanska M, Walls JD, Valette J, Gruetter R, Ugurbil K. Proton-observed carbon-edited NMR spectroscopy in strongly coupled second-order spin systems. Magn Reson Med. 2006;55:250–257. doi: 10.1002/mrm.20764. [DOI] [PubMed] [Google Scholar]
- 23.Xin L, Gambarota G, Mlynarik V, Gruetter R. Proton T2 relaxation time of J-coupled cerebral metabolites in rat brain at 9.4 T. NMR Biomed. 2008;21:396–401. doi: 10.1002/nbm.1205. [DOI] [PubMed] [Google Scholar]
- 24.Soher BJ, Pattany PM, Matson GB, Maudsley AA. Observation of coupled 1H metabolite resonances at long TE. Magn Reson Med. 2005;53:1283–1287. doi: 10.1002/mrm.20491. [DOI] [PMC free article] [PubMed] [Google Scholar]
- 25.Michaeli S, Garwood M, Zhu XH, DelaBarre L, Andersen P, Adriany G, Merkle H, Ugurbil K, Chen W. Proton T2 relaxation study of water, N-acetylaspartate, and creatine in human brain using Hahn and Carr–Purcell spin echoes at 4T and 7T. Magn Reson Med. 2002;47:629–633. doi: 10.1002/mrm.10135. [DOI] [PubMed] [Google Scholar]
- 26.Posse S, Cuenod CA, Risinger R, Le Bihan D, Balaban RS. Anomalous transverse relaxation in 1H spectroscopy in human brain at 4 Tesla. Magn Reson Med. 1995;33:246–252. doi: 10.1002/mrm.1910330215. [DOI] [PubMed] [Google Scholar]
- 27.Choi C, Coupland NJ, Bhardwaj PP, Kalra S, Casault CA, Reid K, Allen PS. T2 measurement and quantification of glutamate in human brain in vivo. Magn Reson Med. 2006;56:971–977. doi: 10.1002/mrm.21055. [DOI] [PubMed] [Google Scholar]