

Abstract
A critical problem in the treatment of malignant gliomas is the extensive infiltration of individual tumor cells into adjacent brain tissues. This invasive phenotype severely limits all current therapies, and to date, no treatment is available to control the spread of this disease. Members of the tumor necrosis factor (TNF) ligand superfamily and their cognate receptors regulate various cellular responses including proliferation, migration, differentiation, and apoptosis. Specifically, the TNFRSF19/TROY gene encodes a type I cell surface receptor that is expressed on migrating or proliferating progenitor cells of the hippocampus, thalamus, and cerebral cortex. Here, we demonstrate that levels of TROY mRNA expression directly correlate with increasing glial tumor grade. Among malignant gliomas, TROY expression correlates inversely with overall patient survival. In addition, we demonstrate that TROY overexpression in glioma cells activates Rac1 signaling in a Pyk2-dependent manner to drive glioma cell invasion and migration. Pyk2 co-immunoprecipitates with the TROY receptor, and depletion of Pyk2 expression by short hairpin RNA interference oligonucleotides inhibits TROY-induced Rac1 activation and subsequent cellular migration. These findings position aberrant expression and/or signaling by TROY as a contributor, and possibly as a driver, of the malignant dispersion of glioma cells.
INTRODUCTION
Glioblastoma multiforme (GBM) is the most malignant form of all primary adult brain tumors in which median patient survival remains approximately 1 year (1). A characteristic feature of GBM is the propensity of glioma cells to invade the surrounding normal brain tissue (2–5). Invasion is a dynamic process dependent upon the interplay between cell surface adhesion receptors and the cellular and extracellular matrix environments. The critical drivers of glioma invasion are not fully understood, yet a number of cell surface proteins including integrins (6, 7), L1CAM (8), and galectin1 (9–13) have been identified as important mediators of glioma invasion. Although some advancement toward GBM treatment has been made (14), these invasive cells still render complete surgical resection impossible and confer resistance to pro-apoptotic stimuli (2, 15) and far less to pro-autophagic stimuli (16). Thus, improved treatment of malignant glioma awaits a means to effectively target the dispersing tumor cells and currently no anti-invasive therapies are available.
Tumor necrosis factor (TNF) and TNF receptor (TNFR) superfamilies are involved in various physiological and pathological responses, including cell survival, programmed cell death, inflammation and differentiation (17). Previously, gene expression profiling of glioma cells (migrating in vitro and invading in vivo) revealed several candidate genes involved in glioma cell invasion, as well as survival genes with a concordant decrease in pro-apoptotic genes (18, 19). Several candidates belonging to the TNFR superfamily emerged, including TNFRSF12A/Fn14 (18, 20). We previously showed that TNFRSF12A/Fn14 is highly expressed in GBM specimens and is upregulated during glioma cell migration in vitro and invasion in vivo (20, 21). Specifically, the Fn14 signaling axis has been implicated in GBM cell invasion (21) and survival (22). Similar to Fn14, our analysis of the glioma gene expression profile identified another Type I transmembrane receptor member of the TNFRSF, TNFRSF19/TAJ/TROY, as a gene candidate highly over-expressed in GBM specimens as described in the present study.
TROY is an orphan member of the TNFR superfamily that is highly expressed in embryonic and adult CNS, and developing hair follicles (23–28). During mouse embryogenesis, TROY mRNA is detected in many developing tissues including the limb buds, eyelids, whiskers, mammary glands, epidermis, bronchial, tongue, dental and gastric epithelium as well as the germinal zones of the CNS including the ventricular zone and subventricular zone. However, in adult animals, TROY expression changes and is primarily restricted to hair follicles and neuron-like cells in the cerebrum, cerebral cortex, and developing olfactory system, including the dorsal root and retinal ganglion neurons (23–28). In humans, TROY mRNA is primarily expressed in the brain and also the prostate, whereas low or undetectable levels are observed in the heart, lung, liver, thymus, uterus, skeletal muscle, spleen, colon, testis, kidney and peripheral blood lymphocytes (29). In the peripheral nervous system, TROY functions as a co-receptor for the ligand-binding Nogo-66 receptor 1 (NgR1) to form the TROY/NgR1/LINGO complex that activates the RhoA pathway to inhibit neurite outgrowth of dorsal root ganglion neurons in adult mice (24, 28). More recently, TROY has been reported to be a possible factor in mediating the switch of osteoblast versus adipocyte differentiation of human multipotent mesenchymal stromal stem cells (30).
In this study, we demonstrate that TROY mRNA is overexpressed in advanced glial tumors and is associated with poor prognosis. We provide evidence that increased TROY expression stimulates glioma cell migration and invasion via the Rac1 signaling pathway. In addition, we demonstrate that TROY co-immunoprecipitates with the non-receptor tyrosine kinase Pyk2 and that depletion of Pyk2 expression or Pyk2 activity suppresses TROY induced Rac1 activation and subsequent glioma cell migration.
MATERIALS AND METHODS
Expression profile dataset of TROY/TNFRSF19.2 in human gliomas and nonneoplastic brain
An expression microarray database consisting of 135 clinically annotated brain tumor specimens publicly available at NCBI’s Gene Expression Omnibus as dataset GDS1962 was mined for TROY expression (TNFRSF19.1 and TNFRSF19.2). Snap-frozen specimens from epileptogenic foci (NB, n = 24) and tumor [29 low-grade astrocytomas (LGAs) and 82 glioblastoma multiformes (GBMs)] with clinical information were collected at the Hermelin Brain Tumor Center, Henry Ford Hospital (Detroit, MI) as previously described (21). Gene expression profiling as described previously (21) was conducted on all samples using Affymetrix U133 Plus 2 GeneChips according to the manufacturer’s protocol at the Neuro-Oncology Branch at the National Cancer Institute (Bethesda, MD). For analysis, gene expression data were normalized in two ways: per chip normalization and per gene normalization across all samples in the collection. For per chip normalization, all expression data on a chip were normalized to the 50th percentile of all values on that chip. For per gene normalization, the data for a given gene were normalized to the median expression level of that gene across all samples. Gene expression differences were deemed statistically significant using parametric tests where variances were not assumed equal (Welch analysis of variance). Expression values were then filtered for highly variable (differentially expressed) genes (coefficient of variation > 30%) across samples, producing a list of 7322 genes. Principal component (PC) analysis was done to discern possible relationships between subgroups of samples as previously described (21), and Kaplan-Meier survival curves were developed for each PC cluster. One cluster had a median survival time of 401 days (short-term survival, ST) and the other cluster had a median survival time of 952 days (long-term survival, LT). Box plots for TROY/TNFRSF19.2 expression level in each cluster derived from PC analysis were graphed. Significance between the two populations was tested with a two-sample t-test.
Clincial samples and histology
Fresh human brain tumor tissues were obtained from 41 patients who underwent therapeutic removal of astrocytic brain tumors under an Institutional Review Board-approved protocol as previously described (31). Non-neoplastic control brain tissues were identified from the margins of the tumors. Histologic diagnosis was assessed under standard light microscopic evaluation of the sections stained with H&E based on the revised WHO criteria for tumors of the central nervous system (32). The 41 astrocytic tumors consisted of 7 low-grade astrocytomas, 4 anaplastic astrocytomas, and 30 glioblastomas. All of the tumor tissues were obtained at primary resection, and none of the patients had been subjected to chemotherapy or radiation therapy before resection.
Cell culture conditions
Human astrocytoma cell lines T98G, SNB19, U87 and U118 were maintained in Dulbecco’s modified Eagle’s medium (DMEM) + 10% heat- inactivated fetal bovine serum (FBS) in a 37°C, 5% CO2 atmosphere.
Antibodies and reagents
Anti HA-epitope antibody was obtained from Cell Signaling Technology Inc. (Beverly, MA). Anti-TROY antibody was obtained from Abcam (San Francisco, CA). The polyclonal anti-Pyk2 antibody was from Upstate Biotechnology (Lake Placid, NY). Monoclonal antibodies to Rac1 were purchased from BD Transduction Labs (San Jose, CA). Monoclonal antibody to α-tubulin was purchased from Millipore (Temecula, CA). Laminin from human placenta was obtained from Sigma.
Expression constructs
The human TROY cDNA (clone ID: 5248745) was purchased from Open Biosystem. The TROY coding sequence (TNFRSF19.2) was amplified by PCR and cloned in-frame upstream of a 3X HA epitope in pcDNA3. For stable transduction of glioma cell lines, the HA epitope-tagged TROY fragment was excised from pcDNA3 and ligated into the lentiviral transfer plasmid pCDH (System Biosciences, Mountain View, CA). pCDH contains a second transcriptional cassette for the expression of a reporter gene (GFP). An empty pCDH vector expressing only the GFP reporter was used as a control. Recombinant lentiviruses were produced as described (33). The kinase deficient Pyk2 variant (Pyk2KD) containing the substitution of K457A was generated using the Quickchange site directed mutagenesis kit (Stratagene, La Jolla, CA). The coding sequence of Pyk2KD was excised and subcloned into the adenoviral shuttle vector pShuttle-CMV to prepare recombinant adenoviruses using the Ad-Easy system as described (34).
Small-interfering RNA preparation and transfection
Small interfering RNA (siRNA) oligonucleotides specific for human Rac1 and non-mammalian GL2 Luciferase were previously described (35). Validated siRNA sequences for human TROY (TROY-1, Hs_TNFRSF19_1; TROY-2, Hs_TNFRSF19_5) were purchased from Qiagen (Valencia, CA). Transient transfection of siRNA was carried out as previously described (35). All siRNA oligonucleotides were transfected at 25 nmol/L, and no cell toxicity was observed. Maximum inhibition of protein levels was achieved 72 h after transfection. Small hairpin RNA (shRNA) specifically targeting human Pyk2 (36) was assembled in the lentiviral plasmid vector pLVTHM (Addgene, Cambridge, MA) and recombinant lentiviruses were produced as previously described (37).
Quantitative reverse transcription PCR
Total RNA from frozen tissues was extracted using Qiagen RNeasy Kit (Qiagen, Valencia, CA.), following the manufacturer’s protocol. The quantity and quality of RNA were assessed with a 2100 Bioanalyzer (Agilent Technologies, Santa Clara, CA). cDNA was synthesized from 200 ng of total RNA as previously described (38). PCR analysis of TROY (sense, 5′-TGC TTG CCA GGA TTT TAT AGG AA-3′; antisense, 5′-GAC GCG ATC TTC ACG AGG TT-3′) and histone H3.3 (sense, 5′-CCA CTG AAC TTC TGA TTC GC-3′; antisense, 5′-GCG TGC TAG CTG GAT GTC TT-3′) was conducted using a LightCycler 480 (Roche, Indianapolis, IN) with SYBR green fluorescence signal detection after each cycle of amplification, and results were quantified and analyzed as described previously (20).
Rac activation assay, Western blotting, and immunopreciptation assays
For the Rac activation assays, glioma cells were plated and cultured for 24 hr under normal conditions. Cells were cultured under serum-deprived condition for an additional 16 hr. Cells were washed twice with cold Tris-bufferedsaline (TBS) and lysed in 50 mmol/L Tris, pH 7.2, 0.5% TritonX-100, 10 mmol/L MgCl2 in a cocktail of protease inhibitors (Roche Diagnostics, Indianapolis, IN). Lysates were harvested and equal concentrations of lysates were assessed for Rac activity according to the protocol of the manufacturer (Pierce, Rockford, IL). Immunoblotting and protein determination were performed as described previously (22). For immunoprecipitation, equivalent amounts of cell lysates (500 μg) were precleared, immunoprecipitated with the appropriate antibody, and the precipitates washed twice with lysis buffer. Samples were then resuspended in 2× SDS sample buffer and boiled in the presence of 2-mercaptoethanol (Sigma), separated by SDS-PAGE, transferred to nitrocellulose overnight at 4 °C, and proteins were detected as described previously (22).
Immunofluorescence analysis for TROY-HA localization
Immunofluorescence was performed using an anti-HA antibody (Cell Signaling). Control cells or cells stably transduced with a lentiviral vector expressing TROY-HA were plated and allowed to attach onto a 10-well glass Teflon slide for 24 h. Cells were then fixed for 5 min in 4% paraformaldehyde in PBS. Cells were then permeabilized with 0.5% Triton X-100 in PBS. After washing with PBS, cells were blocked with 2% bovine serum albumin and 1% goat serum, and incubated with anti-HA antibody for 1 hr at 25 °C. Following washing with 0.1% BSA in PBS and incubation with fluorescein isothiocyanate-conjugated anti-mouse secondary antibody, cell nuclei were stained with 4′,6′-diamindino-2-phenylindole hydrochloride (DAPI) in PBS for 15 min, washed, and mounted in 2% n-propyl gallate, 90% glycerol, pH 8.0. Cells were examined using a laser scanning confocal microscope, equipped with helium, neon, and argon lasers (Zeiss) using the appropriate filters. Images were processed using Adobe Photoshop.
Radial cell migration assay
Cellular migration was quantified in a radial cell migration assay as previously described (21). For certain experiments, cells were transfected with siRNA targeting luciferase, TROY or Rac1. After 24 hours, cells were plated onto 10-well glass slides precoated with 10 μg/ml of human laminin as previously described (21). Cell migration was determined over 24 hours.
Organotypic brain slice invasion assay
An ex vivo invasion assay into rat brain slices was performed as described previously (21). Briefly, 400-μm-thickvital sections were prepared from brains of Wistar rats (Charles River Laboratories, Wilmington, MA) floated on micropore membranes in culture media. Control T98G cells transduced with GFP or T98G cells transduced with TROY-HA (1 × 10⁵) were gently deposited (0.5-μl transfer volume) onto the bilateral putamen of the brain slice then incubated under standard conditions. 48 hours after seeding the cells, glioma cell invasion into the rat brain slices was detected using a LSM 5 Pascal laser-scanning confocal microscope (Zeiss, Thornwood, NY) to observe GFP-labeled cells in the tissue slice. Serial optical sections were obtained every 10 μm downward from the surface plane to the bottom of the slice, and for each focal plane, the area of fluorescent cells as a function of the distance from the top surface of the slice was calculated. The extent of glioma cell invasion was reported as the depth where the area of fluorescent tumor cells was half of the maximum area at the surface.
MALDI-TOF MS
For MALDI-TOF MS, protein bands were stained with SYPRO Ruby protein staining kit (Bio-Rad, Hercules, CA) according to the manufacturer’s protocol. Prominent protein bands present in the anti-HA immunoprecipitate of lysates from TROY-HA expressing cells were visualized under UV light and isolated. The samples of generated peptides were dissolved in 5 ml of 0.5% TFA and measured by MALDI-TOF MS analysis on a Voyager reflector instrument (Applied Biosystems) and a Q-STAR mass spectrometer (Perceptive Biosystems) in positive ion mode at the University of Arizona Proteomic Facility. Data searches were performed using the NCBI protein data bank with a minimum matching peptide setting of four, a mass tolerance setting of 50 to 200 ppm, and a single trypsin miss cut setting.
Statistical analysis
Statistical analyses were performed using the two-sample t-test. P < 0.05 was considered significant.
RESULTS
TROY/TNFRSF19.2 mRNA expression levels correlate with brain tumor grade and poor patient outcome
Members of the TNFR superfamily (TNFRSF), most notably TNFR1, have been shown to play a role in inducing cell invasion and migration in several cancer types. In previous studies, we have reported that the fibroblast growth factor-inducible 14 (Fn14) receptor, (TNFRSF12a) is overexpressed in advanced glial tumors and invading cells (20, 21). To determine whether other members of the TNFRSF are upregulated in glial tumors, we mined the expression microarray database containing 195 clinically annotated brain tumor specimens publicly available at NCBI’s Gene Expression Omnibus as dataset GSE4290. Snap-frozen specimens from epileptogenic foci (NB, n = 24), low-grade astrocytomas (LGA, n=29), and glioblastoma multiforme (GBM, n=82) with clinical information were collected at the Hermelin Brain Tumor Center, Henry Ford Hospital (Detroit, MI) as previously described (21). Gene expression profiling performed as described previously (21) was conducted on all samples using Affymetrix U133 Plus 2 GeneChips according to the manufacturer’s protocol at the Neuro-Oncology Branch at the National Cancer Institute (Bethesda, MD). For our analysis, gene expression data were normalized both per chip and per gene across all samples in the collection as described in detail in the Methods. Gene expression differences were deemed statistically significant using parametric tests where variances were not assumed equal (Welch analysis of variance). Expression values were then filtered for highly variable (differentially expressed) genes (coefficient of variation > 30%) across samples producing a list of 7322 genes. Of the TNFRSF genes analyzed, we found that expression of the TROY/TNFRSF19.2 isoform is significantly differentially expressed among brain specimens. In normal brain specimens, TROY expression is relatively low, but is increased with increasing tumor grade and is significantly higher in GBM samples (n=82) (Fig. 1A). To verify the results from the expression profiling, we performed QRT-PCR on independent non-neoplastic (n=10), LGA (n=6), anaplastic astrocytoma (n=4), and GBM (n=22) specimens. Normal brain specimens show relatively low mRNA levels for TROY as compared to the brain tumor samples (p < 0.01). In GBM specimens, the mRNA level of TROY is significantly higher than in NB tissue (p < 0.01) (Fig. 1B). Next, principal component (PC) analysis was done to discern possible relationships between subgroups of samples as previously described (21), and Kaplan-Meier survival curves were developed for each PC cluster. One cluster had a median survival time of 401 days (short-term survival, ST) and the other cluster had a median survival time of 952 days (long-term survival, LT). Box-and-whisker plots for TROY expression level in each cluster derived from PC analysis were graphed. Significance between the two populations was tested with a two-sample t-test assuming unequal variances. Analysis of the Affymetrix expression values for TROY in the GBM specimens for each cluster showed that patients with GBM in the short term survival cluster had higher expression of TROY (10.5) than GBM patients in the long term survival cluster (2.9; p<0.01; Fig. 1C). This data suggests that high TROY expression correlates with poor patient outcome.
Figure 1. Gene expression profiling of TROY/TNFRSF19 across non-neoplastic brain samples and brain tumor samples.

TROY mRNA expression levels from NCBI Gene Expression Omnibus GDS1962 dataset are presented as box-and-whisker plots. The box for each gene represents the interquartile range (25–75th percentile) and the line within this box is the median value. Bottom and top bars of the whisker indicate the 10th and 90th percentiles, respectively. Outlier values are indicated (closed circles). Significance between the indicated classes of brain specimens was tested using a two-sample t test assuming unequal variances. (NB = non-neoplastic brain; OL, Oligodendrogliomas; Astro = low grade astrocytomas; GBM = glioblastoma multiforme). (B) Quantitative real-time PCR analysis of TROY expression in NB, grade 1 LGAs, grade 2–3 Astrocytomas, and GBM. Values were normalized to histone H3.3 and HPRT1 reference genes. Data are presented as box-and-whisker plots. (C) Principal component analysis of brain tumors from NCBI Gene Expression Omnibus GDS1962 dataset revealed two groups differing by their survival and were denoted as long term (LT) survival and short-term (ST) survival. Box-and-whisker plots for TROY expression in GBM specimens for each cluster are shown. Significance between the two populations was tested with a two-sample t test assuming unequal variances.
TROY is expressed in glioblastoma cell lines and siRNA-mediated depletion of TROY suppresses glioblastoma cell migration
We next examined the expression of TROY protein in four different cultured glioblastoma cell lines. Expression of TROY was high in U118 cells, moderate in U87 cells, and lower in T98G and SNB19 cells (Fig. 2A). To determine the role of TROY in glioma cell migration, we used RNAi to knockdown the expression of TROY in the four glioma cell lines and examined the migratory behavior of the cells on human laminin using a two-dimensional radial cell migration assay (21). siRNA-mediated knockdown of TROY expression in the glioma cell lines with two independent siRNA oligonucleotides was ~80–90% effective and has no effect on the expression of another TNRFSF member, Fn14. Representative results are shown for U118 cells (Fig. 2B). Knockdown of TROY expression resulted in a significant inhibition of cell migration in all four cell lines relative to control cells expressing siRNA targeting luciferase (p < 0.05, Fig. 2C).
Figure 2. Depletion of TROY expression inhibits glioma cell migration.

(A) T98G, SNB19, U87, and U118 cell lysates were analyzed for endogenous level of TROY expression by immunoblotting. The level of α-tubulin protein was also immunoblotted to ensure equal sample loading. (B) Knockdown of TROY expression in U118 cells by two independent siRNA oligonucleotides. Cell lysates were analyzed for TROY and Fn14 expression. (C) Migration rate of indicated glioma cell lines transfected with siRNA oligonucleotides targeting TROY or luciferase (ctrl). Migration rate was determined after 24 h migration on 10 μg/ml human laminin (*, p < 0.05).
Overexpression of TROY in glioma cells stimulates cell migration and invasion and TROY expression localizes to the leading edge of cell migration
To further examine the function of TROY signaling in glioma cell migration, we overexpressed HA epitope-tagged TROY in T98G glioma cell lines by lentiviral transduction (Fig. 3A). Overexpression of HA tagged-TROY in T98G glioma cells resulted in a two-fold increase in cell migration rate (Fig. 3B). To examine the role of TROY in glioma cell invasion in the context of the authentic brain microenvironment, we utilized an ex vivo organotypic rat brain slice model. Overexpression of TROY in T98G glioma cells resulted in a two-fold increase in the depth of cell invasion after 48 hours relative to control cells transduced with GFP alone. (Fig. 3C). Immunolocalization of TROY using an anti-HA antibody revealed that TROY was localized near the cell periphery and was enriched in lamellipodia (Fig. 3D, panel b).
Figure 3. Overexpression of TROY induces glioma cell migration and invasion.

(A) Lysates of T98G cells transduced with empty lentiviral vector (v) or lentiviral vector encoding HA-epitope tagged TROY immunoblotted with anti-HA antibody. (B) Migration rate analysis of HA-TROY expressing glioma cells and control transduced cells. Cell migration was assessed over 48 h. Data represents the average of three independent experiments (*, p < 0.01; **, p < 0.05). (C) T98G cells stably expressing GFP or T98G cells expressing HA-tagged TROY and GFP were implanted into the bilateral putamen on rat organotypic brain slices. Depth of invasion 48 h after seeding was calculated from Z-axis images collected by confocal laser scanning microscopy. The mean value of the depth of invasion was obtained from six independent experiments (*, p < 0.01). (D) Immunofluorescent staining for TROY in T98G (panel a) and T98G-TROY-HA (panel b) cells using an anti-HA antibody. Panel c represents T98G-TROY-HA stained with secondary antibody alone. Arrow represents TROY staining at the membrane periphery and cellular extension.
Pyk2 associates with TROY and mediates TROY-induced glioblastoma migration
To determine possible mechanisms by which TROY regulates cell migration, we sought to identify potential binding partners of TROY utilizing immunoprecipitation experiments coupled with MALDI-TOF MS analysis. T98G cells expressing HA-tagged TROY or control T98G cells expressing GFP alone were lysed, immunoprecipitated with anti-HA antibodies, and the immunoprecipitates resolved by SDS-PAGE. Prominent protein bands present in the immunoprecipitates of TROY expressing cells but absent in the immunoprecipitates of control cells were recovered from the gel. Proteins were eluted, trypsin-digested, and MALDI-TOF and MS-MS analysis of the trypsin digests were performed. The non-receptor protein tyrosine kinase Pyk2 was a candidate sequence identified by mass spectrometry in the TROY immunoprecipitate. Association of TROY with Pyk2 was verified by co-immunoprecipitation. T98G cells transfected with HA-tagged TROY or co-transfected with HA-tagged TROY and Pyk2 were immunoprecipitated with anti-HA antibodies and the precipitates immunoblotted with anti-Pyk2 antibodies (Fig. 4A). Both endogenous Pyk2 and transfected Pyk2 co-immunoprecipitated with TROY substantiating the intracellular interaction between TROY and Pyk2.
Figure 4. Pyk2 is a TROY binding partner and mediates TROY-induced glioma migration.

(A) Cell lysates of T98G cells, T98G cells transfected with HA-TROY, transfected with Pyk2, or co-transfected with HA-TROY and Pyk2 were immunoblotted with anti-Pyk2 or anti-HA antibodies (top panel). Cell lysates were immunoprecipitated with anti-HA antibody and the precipitates immunoblotted with anti-HA or anti-Pyk2 (bottom panel). (B) Depletion of Pyk2 by RNAi suppresses TROY-induced glioma migration. Migration rate of T98G, T98G-TROY-HA, and T98G-TROY-HA cells expressing a shRNA targeting Pyk2 was assessed over 24 h using a radial migration assay on 10 μg/ml laminin substrate (*, p < 0.01). (C) Inhibition of Pyk2 activity inhibits TROY-induced glioma migration. T98G or T98G-TROY-HA expressing cells were infected with recombinant adenoviruses expressing a kinase deficient Pyk2 variant (FLAG-Pyk2KD). Cell migration was assessed over 24 h using a radial migration assay on 10 μg/ml laminin substrate (*, p < 0.01).
To determine whether the association with Pyk2 was required for TROY-induced stimulation of glioma migration, we examined the effect of depletion of Pyk2 expression by shRNA in TROY overexpressing T98G cells. Knockdown of Pyk2 expression significantly inhibited TROY stimulated glioma cell migration (Fig. 4B). Moreover, TROY stimulated migration of glioma cells required Pyk2 activity (Fig. 4C). Expression of a kinase inactive variant of Pyk2 (Pyk2KD) significantly inhibited the migration of the control T98G cells consistent with our previous results (36). Expression of Pyk2KD also significantly inhibited the migration of TROY overexpressing T98G cells, indicating that Pyk2 lies downstream of TROY. Together, these results indicate that TROY-mediated glioma cell migration is dependent upon Pyk2 function.
TROY regulates Rac1 activity and depletion of Rac1 expression by siRNA suppresses TROY-induced cell migration and invasion
Since Rac1 plays a central role in cytoskeletal rearrangement associated with cell migration and invasion, we investigated the effect of TROY expression on Rac1 function. To examine the effect of TROY on Rac1 activity, we compared the activation of Rac1 in glioma cells overexpressing TROY relative to the activation of Rac1 in untransfected cells. Overexpression of TROY resulted in a ~ 2-fold induction of Rac1 activation relative to untransfected cells (Fig. 5A). Since Pyk2 interacts with TROY and mediates TROY-induced migration, we also tested whether Rac1 activation induced by TROY expression is dependent upon Pyk2. shRNA-mediated depletion of Pyk2 in TROY overexpressing glioma cells suppressed TROY induced Rac1 activity to the level of that in control cells (Fig. 5A). This suggests that the TROY-mediated regulation of Rac1 activation is dependent upon Pyk2. To determine the role Rac1 plays in TROY-induced glioma migration, we silenced Rac1 expression in T98G cells overexpressing the TROY receptor. siRNA-mediated depletion of Rac1 expression in T98G was ~90% effective and resulted in significant inhibition of TROY-mediated cell migration (Fig. 5B).
Figure 5. TROY signaling activates Rac1 and induces cell migration via the Rac1 signaling pathway.

(A) T98G, T98G-TROY-HA, and T98G-TROY-HA cells expressing a shRNA targeting Pyk2 were cultured under serum-free medium for 16 h. Cellular lysates were then analyzed for activation of Rac1. (B) Depletion of Rac1 expression by siRNA suppresses TROY-induced glioma cell migration. T98G and T98G-TROY-HA cells were transfected with a siRNA oligonucleotide targeting Rac1. Cell migration was assessed over 24 h using a radial migration assay on 10 μg/ml laminin substrate (*, p < 0.01). Western blot validation of Rac1 depletion and HA-TROY expression are shown.
DISCUSSION
In this study, we demonstrated that the TNFRSF member, TROY, is overexpressed in glioblastoma and that its expression inversely correlates with patient survival. We further demonstrated that knockdown of TROY expression by RNA interference significantly inhibited glioblastoma cell migration in vitro. Conversely, increased expression of TROY enhanced glioblastoma cell migration in vitro and invasion ex vivo. TROY-induced stimulation of glioma cells correlated with increased Rac1 activation and was dependent upon Pyk2 function. These results support a role for aberrant expression and/or signaling by TROY in the malignant dispersion of glioma cells.
TROY is an orphan member of the TNFRSF, and unlike the classical TNFRSF members, TROY lacks a death domain (23). During embryonic development, TROY is widely expressed, but its expression in the postnatal organism is restricted (23–26, 28). The strict control of TROY expression indicates that aberrant expression may be unfavorable. Indeed, it has been recently reported that TROY is highly expressed in primary and metastatic melanoma cells, but not in melanocytes found in normal skin biopsies (39). Similarly, we report that the levels of expression of TROY in glial tumors correlate with tumor grade with advanced GBM showing the highest expression of TROY. Similar to our previous finding with Fn14 (21), TROY expression appears to be an indicator of poor outcome. Principle component analysis indicated that GBM patients in the short-term survival group expressed TROY at significantly increased levels as compared with GBM patients with long-term survival. Thus, the aberrant re-expression of TROY in GBM may play an important role in GBM progression, specifically cell invasion and possibly serves as a good predictor of survival outcome complimenting other prognostic indicators.
The human TNFRSF19 gene has two transcripts: TNFRSF19.1, which encodes a 423-amino acid polypeptide and TNFRSF19.2 which encodes a 417-amino acid polypeptide. The sequence of both transcripts is identical with the exception of the carboxy terminus of cytoplasmic domain. TNFRSF19.2 contains a major TNF receptor-associated factor (TRAF)-binding consensus sequence at amino acid 413–416 while this sequence is absent in TNFRSF19.1. The lack of the TRAF binding sequence in TNFRSF19.1, suggests that these two TROY variants may signal differently, although that remains to be determined. We identified that the TROY variant TNFRSF19.2 was highly over-expressed in glioblastoma specimens, whereas no changes were observed in the mRNA expression of TNFRSF19.1. Elevated NF-κB activity has been observed in GBM (40, 41) and has been implicated in contributing to cellular resistance to cytotoxic intervention and promotion of expression of genes involved in cell survival and invasion (42). As TROY mediated activation of NF-κB has been reported in experimental systems (43, 44), it is possible that TROY overexpression in GBM may contribute to NF-κB hyperactivation and subsequently cell invasion.
Our data showed that overexpression of TROY in glioma cells results in the inhibition of RhoA (data not shown) and an increased activation of Rac1 and thus, results in the enhancement of cell migration. However, it is unclear how the TROY receptor is activated in glioma cells. It is possible that TROY signaling in GBM cells is dependent upon the NgR1-LINGO complex, which utilizes the myelin-associated glycoprotein (MAG), Nogo-A and oligodendrocyte myelin glycoproteins (OMgp) as ligand factors. Interestingly, p75 has also been shown to be upregulated in the invasive glioma cells and regulates glioma invasion (45, 46). Therefore, it is possible that in glioma, TROY can also replace p75 in the NgR1-LINGO complex to sustain glioma cell invasion in vitro.
Our studies identified Pyk2 as a cytoplasmic binding partner of TROY. Pyk2 is highly expressed in the nervous system and uniquely located within cells to transduce information from interactions with the extracellular matrix and soluble mediators through cell surface integrins, receptor tyrosine kinases, and G-protein coupled receptors into the activation of intracellular signaling pathways that modulate cell growth and migration (47, 48). Pyk2 expression is elevated in glioma and expression is increased with advancing WHO grade (49). Moreover, Pyk2 expression is differentially upregulated in invasive glioma cells relative to cells in their cognate tumor cores in glioblastoma tumor samples (19) and phosphorylation of Pyk2 mediates heregulin stimulated glioma invasion (50). In vitro studies with glioma cell lines indicated that migratory potential correlated positively with endogenous Pyk2 activity (51) and that silencing Pyk2 expression inhibits glioma cell migration (36). Moreover, knockdown of Pyk2 expression (37) or inhibition of Pyk2 activity (33) extended survival in a glioma xenograft model. In this study, we demonstrated that knockdown of Pyk2 expression inhibited TROY-stimulated glioma cell migration and Rac1 activation. TROY stimulated glioma cell migration required Pyk2 activity, as expression of a kinase-deficient Pyk2 blocked the effect of increased TROY expression suggesting that Pyk2 is a proximal signaling effector for TROY. Understanding the mechanisms that underlie Pyk2 regulation of TROY-induced Rac1 activation is an area of current investigation.
Rac1 has been shown to play a role in various malignant carcinoma cells and in gliomas (52, 53). In glioma, inhibition of Rac1 expression by RNAi strongly inhibits cell migration and invasion (35, 54). Recently, studies have shown that that certain members of the TNFRSF can regulate the activation of Rac1 (21, 55, 56). Notably, activation of Fn14 results in the activation of Rac1 to drive glioma invasion and migration (21). Since the activation of Rac1 occurs through the exchange of bound GDP for GTP catalyzed by one of multiple Rac guanine exchange factors (GEFs), it is likely TROY may modulate cytoskeleton dynamics by influencing one or more of the Rac GEF proteins involved in Rac1 activation, possibly through Pyk2. Importantly, several Rac GEFs, including Ect2, VAV3, TRIO, and Dock180, have been shown to be overexpressed in GBM specimens, and depletion of the expression of these GEFs by RNAi reduced Rac1 activation and inhibited glioma cell migration and invasion (38, 57). Interestingly, Pyk2 has been shown to modulate the activity of several Rac GEFs including VAV1 and VAV2 (58, 59). A model of TROY signaling to mediate cell migration is shown in Fig. 6.
Figure 6. Schematic model of TROY-Pyk2-Rac1 signaling pathway in GBM cells.
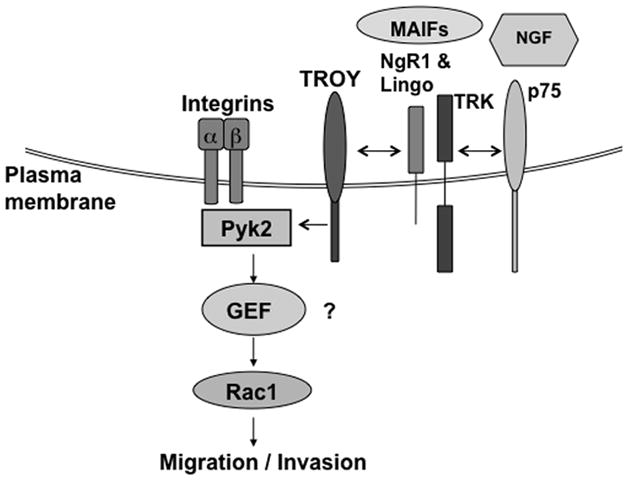
Activation of the TROY receptor by possible interaction with NgR1-LINGO complex elicits a signaling pathway to recruit Pyk2 to the TROY receptor complex. Pyk2 functions to induce Rac1 activation potentially by influencing a Rac guanine nucleotide exchange factor (GEF) to drive glioma cell migration and invasion.
In summary, we have identified an important role for the TNFRSF member TROY in glioma cell migration and invasion. Increased expression of TROY stimulates in vitro glioma cell migration and invasion, is associated with increased activation of Rac1, and correlates with poor patient outcome. Furthermore, the results indicate that TROY-stimulated glioma cell migration and Rac1 activation is regulated by Pyk2. Future studies will seek to substantiate the current in vitro results implicating the importance of TROY in glioma invasion in a preclinical animal model. Overall, these observations suggest that TROY may represent a novel target for therapeutic intervention to inhibit invasion in malignant glioma.
Acknowledgments
We thank Caitlin Auther for providing technical support. We also thank Dr. Mitsutoshi Nakada (Kanazawa University, Ishikawa, Japan) for providing the brain clinical specimens. Supported by the Science Foundation Arizona CAA 0244-08 (N.L.T) and the National Institute of Health (CA130940 N.L.T and CA103956, CA108961 J.C.L).
Abbreviations
- RT
reverse transcription
- QRT-PCR
quantitative reverse transcription-polymerase chain reaction
- ECM
extracellular matrix
- FBS
fetal bovine serum
- TNF
tumor necrosis factor
- TNFR
tumor necrosis factor receptor
- TNFRSF
tumor necrosis factor receptor superfamily
- TRAF
TNFR-associated factors
- GBM
glioblastoma multiforme
- PBS
phosphate buffered saline
- PMSF
phenylmethylsulfonyl fluoride
- siRNA
small interfering RNA
References
- 1.Central Brain Tumor Registry of the United States. Chicago, IL: 2008. Primary Brain tumors in the United States Statistical Report; p. 1. 2007–2008. [Google Scholar]
- 2.Berens ME, Giese A. “...those left behind”. Biology and oncology of invasive glioma cells. Neoplasia. 1999;1(3):208–19. doi: 10.1038/sj.neo.7900034. [DOI] [PMC free article] [PubMed] [Google Scholar]
- 3.Giese A, Bjerkvig R, Berens ME, Westphal M. Cost of migration: invasion of malignant gliomas and implications for treatment. J Clin Oncol. 2003;21(8):1624–36. doi: 10.1200/JCO.2003.05.063. [DOI] [PubMed] [Google Scholar]
- 4.Teodorczyk M, Martin-Villalba A. Sensing invasion: cell surface receptors driving spreading of glioblastoma. J Cell Physiol. 222(1):1–10. doi: 10.1002/jcp.21901. [DOI] [PubMed] [Google Scholar]
- 5.Furnari FB, Fenton T, Bachoo RM, et al. Malignant astrocytic glioma: genetics, biology, and paths to treatment. Genes Dev. 2007;21(21):2683–710. doi: 10.1101/gad.1596707. [DOI] [PubMed] [Google Scholar]
- 6.Paulus W, Baur I, Beutler AS, Reeves SA. Diffuse brain invasion of glioma cells requires beta 1 integrins. Lab Invest. 1996;75(6):819–26. [PubMed] [Google Scholar]
- 7.Uhm JH, Gladson CL, Rao JS. The role of integrins in the malignant phenotype of gliomas. Front Biosci. 1999;4:D188–99. doi: 10.2741/uhm. [DOI] [PubMed] [Google Scholar]
- 8.Bao S, Wu Q, Li Z, et al. Targeting cancer stem cells through L1CAM suppresses glioma growth. Cancer Res. 2008;68(15):6043–8. doi: 10.1158/0008-5472.CAN-08-1079. [DOI] [PMC free article] [PubMed] [Google Scholar]
- 9.Le Mercier M, Fortin S, Mathieu V, Kiss R, Lefranc F. Galectins and gliomas. Brain Pathol. 20(1):17–27. doi: 10.1111/j.1750-3639.2009.00270.x. [DOI] [PMC free article] [PubMed] [Google Scholar]
- 10.Le Mercier M, Fortin S, Mathieu V, et al. Galectin 1 proangiogenic and promigratory effects in the Hs683 oligodendroglioma model are partly mediated through the control of BEX2 expression. Neoplasia. 2009;11(5):485–96. doi: 10.1593/neo.81526. [DOI] [PMC free article] [PubMed] [Google Scholar]
- 11.Camby I, Belot N, Lefranc F, et al. Galectin-1 modulates human glioblastoma cell migration into the brain through modifications to the actin cytoskeleton and levels of expression of small GTPases. J Neuropathol Exp Neurol. 2002;61(7):585–96. doi: 10.1093/jnen/61.7.585. [DOI] [PubMed] [Google Scholar]
- 12.Jung TY, Jung S, Ryu HH, et al. Role of galectin-1 in migration and invasion of human glioblastoma multiforme cell lines. J Neurosurg. 2008;109(2):273–84. doi: 10.3171/JNS/2008/109/8/0273. [DOI] [PubMed] [Google Scholar]
- 13.Strik HM, Schmidt K, Lingor P, et al. Galectin-1 expression in human glioma cells: modulation by ionizing radiation and effects on tumor cell proliferation and migration. Oncol Rep. 2007;18(2):483–8. [PubMed] [Google Scholar]
- 14.Stupp R, Hegi ME, Mason WP, et al. Effects of radiotherapy with concomitant and adjuvant temozolomide versus radiotherapy alone on survival in glioblastoma in a randomised phase III study: 5-year analysis of the EORTC-NCIC trial. Lancet Oncol. 2009;10(5):459–66. doi: 10.1016/S1470-2045(09)70025-7. [DOI] [PubMed] [Google Scholar]
- 15.Lefranc F, Brotchi J, Kiss R. Possible future issues in the treatment of glioblastomas: special emphasis on cell migration and the resistance of migrating glioblastoma cells to apoptosis. J Clin Oncol. 2005;23(10):2411–22. doi: 10.1200/JCO.2005.03.089. [DOI] [PubMed] [Google Scholar]
- 16.Lefranc F, Facchini V, Kiss R. Proautophagic drugs: a novel means to combat apoptosis-resistant cancers, with a special emphasis on glioblastomas. Oncologist. 2007;12(12):1395–403. doi: 10.1634/theoncologist.12-12-1395. [DOI] [PubMed] [Google Scholar]
- 17.Locksley RM, Killeen N, Lenardo MJ. The TNF and TNF receptor superfamilies: integrating mammalian biology. Cell. 2001;104(4):487–501. doi: 10.1016/s0092-8674(01)00237-9. [DOI] [PubMed] [Google Scholar]
- 18.Mariani L, Beaudry C, McDonough WS, et al. Glioma cell motility is associated with reduced transcription of proapoptotic and proliferation genes: a cDNA microarray analysis. J Neurooncol. 2001;53(2):161–76. doi: 10.1023/a:1012253317934. [DOI] [PubMed] [Google Scholar]
- 19.Hoelzinger DB, Mariani L, Weis J, et al. Gene expression profile of glioblastoma multiforme invasive phenotype points to new therapeutic targets. Neoplasia. 2005;7(1):7–16. doi: 10.1593/neo.04535. [DOI] [PMC free article] [PubMed] [Google Scholar]
- 20.Tran NL, McDonough WS, Donohue PJ, et al. The human Fn14 receptor gene is up-regulated in migrating glioma cells in vitro and overexpressed in advanced glial tumors. Am J Pathol. 2003;162(4):1313–21. doi: 10.1016/S0002-9440(10)63927-2. [DOI] [PMC free article] [PubMed] [Google Scholar]
- 21.Tran NL, McDonough WS, Savitch BA, et al. Increased Fibroblast Growth Factor-Inducible 14 Expression Levels Promote Glioma Cell Invasion via Rac1 and Nuclear Factor-{kappa}B and Correlate with Poor Patient Outcome. Cancer Res. 2006;66(19):9535–42. doi: 10.1158/0008-5472.CAN-06-0418. [DOI] [PubMed] [Google Scholar]
- 22.Tran NL, McDonough WS, Savitch BA, Sawyer TF, Winkles JA, Berens ME. The tumor necrosis factor-like weak inducer of apoptosis (TWEAK)-fibroblast growth factor-inducible 14 (Fn14) signaling system regulates glioma cell survival via NFkappaB pathway activation and BCL-XL/BCL-W expression. J Biol Chem. 2005;280(5):3483–92. doi: 10.1074/jbc.M409906200. [DOI] [PubMed] [Google Scholar]
- 23.Hu S, Tamada K, Ni J, Vincenz C, Chen L. Characterization of TNFRSF19, a novel member of the tumor necrosis factor receptor superfamily. Genomics. 1999;62(1):103–7. doi: 10.1006/geno.1999.5979. [DOI] [PubMed] [Google Scholar]
- 24.Park JB, Yiu G, Kaneko S, et al. A TNF receptor family member, TROY, is a coreceptor with Nogo receptor in mediating the inhibitory activity of myelin inhibitors. Neuron. 2005;45(3):345–51. doi: 10.1016/j.neuron.2004.12.040. [DOI] [PubMed] [Google Scholar]
- 25.Pispa J, Mikkola ML, Mustonen T, Thesleff I. Ectodysplasin, Edar and TNFRSF19 are expressed in complementary and overlapping patterns during mouse embryogenesis. Gene Expr Patterns. 2003;3(5):675–9. doi: 10.1016/s1567-133x(03)00092-9. [DOI] [PubMed] [Google Scholar]
- 26.Hisaoka T, Morikawa Y, Kitamura T, Senba E. Expression of a member of tumor necrosis factor receptor superfamily, TROY, in the developing mouse brain. Brain Res Dev Brain Res. 2003;143(1):105–9. doi: 10.1016/s0165-3806(03)00101-9. [DOI] [PubMed] [Google Scholar]
- 27.Hisaoka T, Morikawa Y, Kitamura T, Senba E. Expression of a member of tumor necrosis factor receptor superfamily, TROY, in the developing olfactory system. Glia. 2004;45(4):313–24. doi: 10.1002/glia.10323. [DOI] [PubMed] [Google Scholar]
- 28.Shao Z, Browning JL, Lee X, et al. TAJ/TROY, an orphan TNF receptor family member, binds Nogo-66 receptor 1 and regulates axonal regeneration. Neuron. 2005;45(3):353–9. doi: 10.1016/j.neuron.2004.12.050. [DOI] [PubMed] [Google Scholar]
- 29.Eby MT, Jasmin A, Kumar A, Sharma K, Chaudhary PM. TAJ, a Novel Member of the Tumor Necrosis Factor Receptor Family, Activates the c-Jun N-terminal Kinase Pathway and Mediates Caspase-independent Cell Death. Journal of Biological Chemistry. 2000;275(20):15336–42. doi: 10.1074/jbc.275.20.15336. [DOI] [PubMed] [Google Scholar]
- 30.Qiu W, Hu Y, Andersen TE, et al. Tumor necrosis factor receptor superfamily member 19 (TNFRSF19) regulates differentiation fate of human mesenchymal (stromal) stem cells through canonical Wnt signaling and C/EBP. J Biol Chem. 285(19):14438–49. doi: 10.1074/jbc.M109.052001. [DOI] [PMC free article] [PubMed] [Google Scholar]
- 31.Nakada M, Drake KL, Nakada S, Niska JA, Berens ME. Ephrin-B3 ligand promotes glioma invasion through activation of Rac1. Cancer Res. 2006;66(17):8492–500. doi: 10.1158/0008-5472.CAN-05-4211. [DOI] [PubMed] [Google Scholar]
- 32.Kleihues P, Louis DN, Scheithauer BW, et al. The WHO classification of tumors of the nervous system. J Neuropathol Exp Neurol. 2002;61(3):215–25. doi: 10.1093/jnen/61.3.215. discussion 26–9. [DOI] [PubMed] [Google Scholar]
- 33.Loftus JC, Yang Z, Tran NL, et al. The Pyk2 FERM domain as a target to inhibit glioma migration. Mol Can Ther. 2009;8(6):1505–14. doi: 10.1158/1535-7163.MCT-08-1055. [DOI] [PMC free article] [PubMed] [Google Scholar]
- 34.He TC, Zhou S, da Costa LT, Yu J, Kinzler KW, Vogelstein B. A simplified system for generating recombinant adenoviruses. Proc Natl Acad Sci U S A. 1998;95(5):2509–14. doi: 10.1073/pnas.95.5.2509. [DOI] [PMC free article] [PubMed] [Google Scholar]
- 35.Chuang YY, Tran NL, Rusk N, Nakada M, Berens ME, Symons M. Role of Synaptojanin 2 in Glioma Cell Migration and Invasion. Cancer Res. 2004;64(22):8271–5. doi: 10.1158/0008-5472.CAN-04-2097. [DOI] [PubMed] [Google Scholar]
- 36.Lipinski CA, Tran NL, Menashi E, et al. The tyrosine kinase pyk2 promotes migration and invasion of glioma cells. Neoplasia. 2005;7(5):435–45. doi: 10.1593/neo.04712. [DOI] [PMC free article] [PubMed] [Google Scholar]
- 37.Lipinski CA, Tran NL, Viso C, et al. Extended survival of Pyk2 or FAK deficient orthotopic glioma xenografts. J Neuro-Oncol. 2008;90:181–9. doi: 10.1007/s11060-008-9656-8. [DOI] [PMC free article] [PubMed] [Google Scholar]
- 38.Salhia B, Tran NL, Chan A, et al. The guanine nucleotide exchange factors trio, Ect2, and Vav3 mediate the invasive behavior of glioblastoma. Am J of Path. 2008;173(6):1828–38. doi: 10.2353/ajpath.2008.080043. [DOI] [PMC free article] [PubMed] [Google Scholar]
- 39.Spanjaard RA, Whren KM, Graves C, Bhawan J. Tumor necrosis factor receptor superfamily member TROY is a novel melanoma biomarker and potential therapeutic target. Int J Cancer. 2007;120(6):1304–10. doi: 10.1002/ijc.22367. [DOI] [PubMed] [Google Scholar]
- 40.Weaver KD, Yeyeodu S, Cusack JC, Jr, Baldwin AS, Jr, Ewend MG. Potentiation of chemotherapeutic agents following antagonism of nuclear factor kappa B in human gliomas. J Neurooncol. 2003;61(3):187–96. doi: 10.1023/a:1022554824129. [DOI] [PubMed] [Google Scholar]
- 41.Nakanishi C, Toi M. Nuclear factor-kappaB inhibitors as sensitizers to anticancer drugs. Nat Rev Cancer. 2005;5(4):297–309. doi: 10.1038/nrc1588. [DOI] [PubMed] [Google Scholar]
- 42.Pahl HL. Activators and target genes of Rel/NF-kappaB transcription factors. Oncogene. 1999;18(49):6853–66. doi: 10.1038/sj.onc.1203239. [DOI] [PubMed] [Google Scholar]
- 43.Kojima T, Morikawa Y, Copeland NG, et al. TROY, a Newly Identified Member of the Tumor Necrosis Factor Receptor Superfamily, Exhibits a Homology with Edar and Is Expressed in Embryonic Skin and Hair Follicles. J of Biol Chem. 2000;275(27):20742–7. doi: 10.1074/jbc.M002691200. [DOI] [PubMed] [Google Scholar]
- 44.Hashimoto T, Schlessinger D, Cui CY. Troy binding to lymphotoxin-alpha activates NF kappa B mediated transcription. Cell Cycle. 2008;7(1):106–11. doi: 10.4161/cc.7.1.5135. [DOI] [PubMed] [Google Scholar]
- 45.Johnston AL, Lun X, Rahn JJ, et al. The p75 neurotrophin receptor is a central regulator of glioma invasion. PLoS Biol. 2007;5(8):e212. doi: 10.1371/journal.pbio.0050212. [DOI] [PMC free article] [PubMed] [Google Scholar]
- 46.Wang L, Rahn JJ, Lun X, et al. Gamma-secretase represents a therapeutic target for the treatment of invasive glioma mediated by the p75 neurotrophin receptor. PLoS Biol. 2008;6(11):e289. doi: 10.1371/journal.pbio.0060289. [DOI] [PMC free article] [PubMed] [Google Scholar]
- 47.Girault JA, Costa A, Derkinderen P, Studler JM, Toutant M. FAK and PYK2/CAKbeta in the nervous system: a link between neuronal activity, plasticity and survival? Trends Neurosci. 1999;22(6):257–63. doi: 10.1016/s0166-2236(98)01358-7. [DOI] [PubMed] [Google Scholar]
- 48.Avraham H, Park SY, Schinkmann K, Avraham S. RAFTK/Pyk2-mediated cellular signalling. Cell Signal. 2000;12(3):123–33. doi: 10.1016/s0898-6568(99)00076-5. [DOI] [PubMed] [Google Scholar]
- 49.Gutenberg A, Bruck W, Buchfelder M, Ludwig HC. Expression of tyrosine kinases FAK and Pyk2 in 331 human astrocytomas. Acta Neuropathol (Berl) 2004;108(3):224–30. doi: 10.1007/s00401-004-0886-3. [DOI] [PubMed] [Google Scholar]
- 50.van der Horst EH, Weber I, Ullrich A. Tyrosine phosphorylation of PYK2 mediates heregulin-induced glioma invasion: novel heregulin/HER3-stimulated signaling pathway in glioma. Int J Cancer. 2005;113(5):689–98. doi: 10.1002/ijc.20643. [DOI] [PubMed] [Google Scholar]
- 51.Lipinski CA, Tran NL, Bay C, et al. Differential role of proline-rich tyrosine kinase 2 and focal adhesion kinase in determining glioblastoma migration and proliferation. Mol Cancer Res. 2003;1(5):323–32. [PubMed] [Google Scholar]
- 52.Fritz G, Just I, Kaina B. Rho GTPases are over-expressed in human tumors. Int J Cancer. 1999;81(5):682–7. doi: 10.1002/(sici)1097-0215(19990531)81:5<682::aid-ijc2>3.0.co;2-b. [DOI] [PubMed] [Google Scholar]
- 53.Gomez del Pulgar T, Benitah SA, Valeron PF, Espina C, Lacal JC. Rho GTPase expression in tumourigenesis: evidence for a significant link. Bioessays. 2005;27(6):602–13. doi: 10.1002/bies.20238. [DOI] [PubMed] [Google Scholar]
- 54.Chan AY, Coniglio SJ, Chuang YY, et al. Roles of the Rac1 and Rac3 GTPases in human tumor cell invasion. Oncogene. 2005;24(53):7821–9. doi: 10.1038/sj.onc.1208909. [DOI] [PubMed] [Google Scholar]
- 55.Tanabe K, Bonilla I, Winkles JA, Strittmatter SM. Fibroblast growth factor-inducible-14 is induced in axotomized neurons and promotes neurite outgrowth. J Neurosci. 2003;23(29):9675–86. doi: 10.1523/JNEUROSCI.23-29-09675.2003. [DOI] [PMC free article] [PubMed] [Google Scholar]
- 56.Ruan W, Lee CT, Desbarats J. A Novel Juxtamembrane Domain in Tumor Necrosis Factor Receptor Superfamily Molecules Activates Rac1 and Controls Neurite Growth. Mol Biol Cell. 2008;19(8):3192–202. doi: 10.1091/mbc.E08-02-0161. [DOI] [PMC free article] [PubMed] [Google Scholar]
- 57.Jarzynka MJ, Hu B, Hui KM, et al. ELMO1 and Dock180, a bipartite Rac1 guanine nucleotide exchange factor, promote human glioma cell invasion. Cancer Res. 2007;67(15):7203–11. doi: 10.1158/0008-5472.CAN-07-0473. [DOI] [PMC free article] [PubMed] [Google Scholar]
- 58.Gao C, Blystone SD. A Pyk2-Vav1 complex is recruited to beta3-adhesion sites to initiate Rho activation. Biochem J. 2009;420(1):49–56. doi: 10.1042/BJ20090037. [DOI] [PubMed] [Google Scholar]
- 59.Gakidis MA, Cullere X, Olson T, et al. Vav GEFs are required for beta2 integrin-dependent functions of neutrophils. J Cell Biol. 2004;166(2):273–82. doi: 10.1083/jcb.200404166. [DOI] [PMC free article] [PubMed] [Google Scholar]