

Abstract
The human epidermal growth factor receptors EGFR and HER2 are members of the EGFR family of cell-surface receptors/tyrosine kinases. EGFR- and HER2-positive cancers represent a more aggressive disease with greater likelihood of recurrence, poorer prognosis, and decreased survival rate, compared to EGFR- or HER2-negative cancers. The details of HER2 proto-oncogenic functions are not deeply understood, partially because of a restricted availability of tools for EGFR and HER2 detection [1]. We have created photo-stable and relatively simple-to-produce imaging probes for in vitro staining of EGFR and HER2. These new reagents, called Affiprobes, consist of a targeting moiety, a HER2- or EGFR-specific Affibody molecule, and a fluorescent moiety, mCherry (red) or EGFP (green). Our flow cytometry and confocal microscopy experiments demonstrated high specificity and signal/background ratio of Affiprobes. Affiprobes are able to stain both live cells and frozen tumor xerograph sections. This type of optical probe can easily be extended for targeting other cell-surface antigens/receptors.
Keywords: Imaging agents, Cancer, Affiprobe, HER2, EGFR
Introduction
Overexpression of the epidermal growth factor receptor (EGFR, HER1, or ErbB-1) in several malignant tumors, such as carcinomas of the breast, colon, urinary bladder, and lung, results in with increased cell proliferation and motility, decreased apoptosis [2] and is associated with poor prognosis [3]. Similarly, the human epidermal growth factor receptor 2, HER2 (Her2/neu, ErbB2, or c-erb-b2), has been found overexpressed in a number of cancers, such as breast, ovarian, salivary gland, stomach, kidney, colon, prostate, and non-small cell lung cancer [4-6] When overexpressed, homo- or hetero-dimers of HER2 cause increased proliferation, decreased apoptosis, enhanced tumor cell motility, and neo-angiogenesis, which are strongly associated with tumor formation and invasion. Therefore, women with HER2-positive breast cancer have a more aggressive disease, greater likelihood of recurrence, poorer prognosis, and decreased survival rate, compared to HER2-negative cases [7]. The details of HER2 proto-oncogenic function, its internalization mechanism, and subcellular trafficking are not fully understood. The study of HER2 internalization is important for determination of its role in cell signaling pathways and designing novel strategies of HER2-targeted therapies.
Several ligands were identified for EGFR family receptors, including EGF and TGF-alpha, that induce receptor dimerization followed by tyrosine autophosphorylation, thus triggering downstream signaling. HER2 is the only member of this family that does not have identified natural ligands.
Affibody molecules are a new class of relatively small (~7-kDa) affinity proteins. Structurally, they are based on a 58-amino-acid scaffold, derived from the Z domain of the Staphylococcus aureus protein, and were obtained by combinatorial protein engineering [8, 9]. Although HER2- and EGFR-specific Affibody molecules strongly bind their receptors (low nanomolar KD), this binding does not lead to receptor activation [10]. Affibody, unlike antibody, does not require post-translational modifications for activity. Therefore, E. coli host can be used for expression of soluble and appropriately folded Affibody and Affibody fusions. Affibody moiety does not make proteins insoluble and does not require eukaryotic chaperons for refolding, whereas even small, single-chain fragments of antibody—scFvs—require refolding after expression in E. coli. Altogether, the Affibody molecule size, high affinity, specificity, and, finally, the fact that they are physiologically inactive, make these proteins an interesting alternative to natural ligands, antibodies, or scFvs as targeting agents.
It was previously reported that Affibody molecules were labeled with radionuclides, including 99mTc, 111In, 68Ga, 90Y, 125I, and 18F [11-17], optical beacons [18-20], or reporter enzyme [19]. Aforementioned probes were successfully applied for characterization of HER2 and EGFR expression in vitro, as well as in xenografts. Moreover, it was recently shown that at least in preclinical studies, Affibody molecules were effectively used for specific, HER2-targeted drug delivery to tumor cells [21, 22].
The goal of this work was to create chemically and optically stable probes that are able to bind targets specifically and with high affinity, that can be easily produced, and that provide a high signal-to-background ratio. For that purpose we have combined the exceptional features of Affibody molecules as targeting moieties with excellent optical characteristic of auto-fluorescence proteins such as mCherry [23] and Enhanced Green Fluorescent Protein (EGFP) [24], which were used widely for production of fusions with scFv [25] and other proteins [26-28]. The resulting molecules, called Affiprobes, are recombinant fusion proteins expressed in E. coli cells and purified by one-step affinity chromatography under non-denaturing conditions as soluble proteins.
We propose that Affiprobes, because of their characteristic and cost-effectiveness, may become an attractive alternative to chemically labeled antibodies, antibody fragments, and natural ligands for cell imaging technology.
Results and Discussion
HER2- and EGFR-targeting Affiprobe constructs were cloned by combining PCR blocks coding for the receptor-targeting Affibody molecules and fluorescent protein moieties linked by a short flexible linker (Figure 1, Supplementary Figures 1, 2). Affiprobes based on anti-Taq DNA polymerase Affibody molecules were used as a negative (non-specific) control. The proteins were expressed in E. coli cells, purified using Ni-NTA affinity chromatography, and characterized by protein SDS-gel electrophoresis (Supplementary Figure 3). Affiprobes were also characterized using HPLC and MALDI-TOF MS (Supplementary Figure 4). Affiprobe preparations after Ni-column contained two low molecular weight polypeptides of 16.4 and 18.8 kDa and some other minor contaminants. N-terminal sequence analysis of HPLC-purified fragments (data not shown) demonstrated that the 16.4-kDa fragment corresponds to the N-terminal sequence of the Affiprobe and therefore contains Affibody moiety but not fluorophore. The 18.8 kDa protein probably corresponds to the C-terminal portion of the Affiprobe, since the sum of the fragment weights is equal to the size of the full-size Affiprobe. These minor fragments were formed after elution. On the other hand, Affiprobes appear to be stable in serum, since 48 hours of incubation in 50% FBS did not affect their binding and fluorescent properties (Supplementary Figure 5).
Figure 1.

Structure of the Affiprobes. Affiprobe molecules contain a hexahistidine tag at the N-terminus, followed by an Affibody molecule targeting moiety Z(HER2), Z(EGFR), and Z(Taq4:5), flexible 6 amino-acid G3SG2 linker, and a fluorescent protein mCherry or EGFP at the C-terminus.
Specificity and affinity of the purified Affiprobes were determined by flow cytometry using BT474 (HER2-positive) and MDA-MB468 (EGFR-positive) cells. As listed in Table 1, obtained KD values were in low nanomolar range, both for HER2- and EGFR-targeted probes. No significant difference in KD values between Z(HER2)-Green and Z(HER2)-Red was observed; however, mCherry-based Affiprobe had a slightly lower affinity to EGFR than corresponding value recorded for Z(EGFR)-Green (Supplementary Figure 6).
Table 1.
Affinity of Affiprobes to HER2 and EGFR –overexpressing cells*.
| Target
Fluorescent protein |
HER2 | EGFR | Taq |
|---|---|---|---|
| EGFP | 12.7±0.8 nM | 19.6±2.3 nM | >2.8μM |
| mCherry | 11.6±1.1 nM | 27.9±2.1 nM | >2.8μM |
Dissociation equilibrium coefficients (KD) were estimated by FACS using SKBR3 and MDA-MB468 cells for HER2 and EGFR – targeted Affiprobes respectively. KD values were estimated using non-linear regression analysis (GraphPad Software, Inc., San Diego, CA).
KD obtained for HER2-targeted probes were similar to that reported by Kramer et al. for 18F-labelled Affibody molecules (15 nM) tested on SKOV3 and SKBR3 cells [17]. Results of our competition assay showed that, Affibody concentration of 81.2 ± 5.5 nM caused 50% decrease of Z(HER2)-Red (applied at 280 nM) binding to BT474 cells. This observation indicates that Z(HER2)-Red has around 3.5 times lower affinity than non-modified Affibody molecules (Supplementary Figure 7). KD values obtained for Z(EGFR), both red and green, were approximately one order of magnitude higher than corresponding values reported by Tolmachev, et al. for Z(EGFR:1907) labeled with Alexa Fluor 488 tested on A431 cells [15]. We have previously reported that modification of HER2 Affibody molecules with either fluorescent dye [18] or a toxic moiety [21] decreased their affinity to the target receptors. Therefore, it is likely that the apparent reduction of Affiprobe binding affinity is due to incorporation of relatively bulky fluorescent protein into our construct.
The capability of the Affiprobes to detect different levels of HER2 expression was tested by FACS (Supplementary Figure 8). A high level of correlation was seen between the receptor expression determined by ELISA and the Affiprobe binding (R2 = 0.97).
Confocal imaging further confirmed specific binding of Affiprobes. MDA-MB468 and SKBR3 cell lines stained with EGFR- and HER2-Affiprobes showed an accumulation of only specific probes on the cell surface (Figure 2a, b), while neither HER2 nor EGFR was recognized by non-specific Affiprobe Z(Taq4:5) (Figure 2a, b). Similarly, MCF7 cells, expressing low levels of both receptors, did not show any fluorescent signal. SKBR3 cells are an example of a HER2 and EGFR double-positive cell line showing an affinity to Z(HER2)-Red and Z(EGFR)-Green Affiprobes (Figure 2c).
Figure 2.
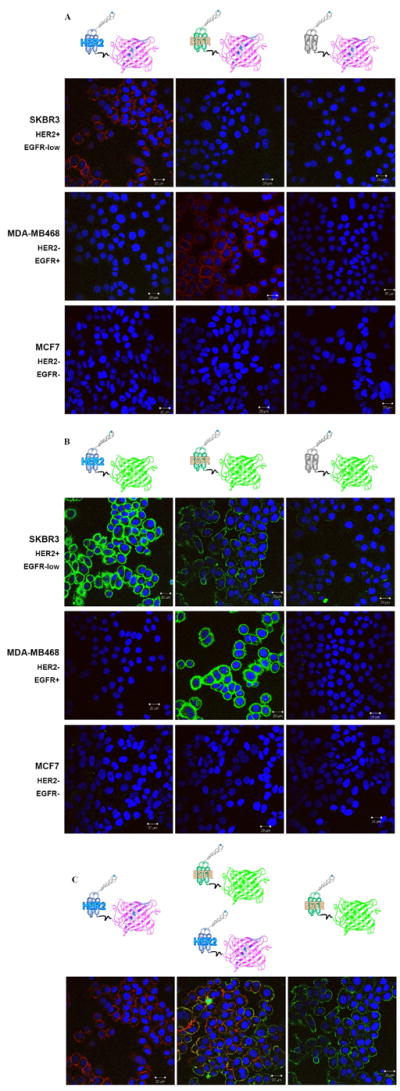
Affiprobe staining of cells with different HER2 and EGFR phenotype. Cells were incubated with Affiprobes (100 μg/mL) for 1h at 37°C in the presence of Hoechst 33342 (1 μg/mL) Representative confocal images through middle section of the cells were acquired with a Zeiss LSM 510 confocal microscope as described in Experimental section.
We were also able to prove that Affiprobes are applicable for fluorescent staining of the frozen tissue sections (Figure 3). SKOV3 tumor cells show an accumulation of the probe on the membrane, while non-specific Affiprobes Z(Taq4:5)-Red and Z(Taq4:5)-Green applied and imaged at the same conditions show very low/no signal.
Figure 3.
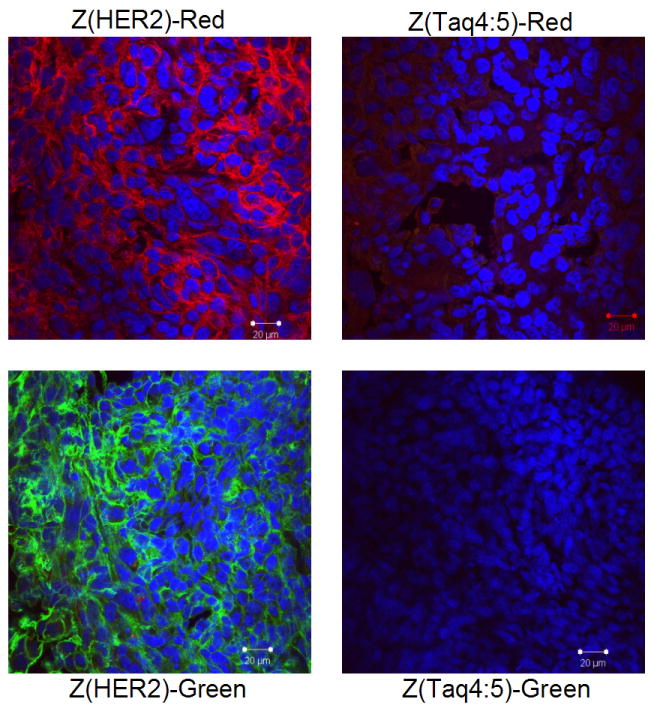
Confocal imaging of frozen section of HER2 positive tumor xenograft. Tumors bearing SKOV3 cells were extracted from euthanized mice, flash-frozen, and a 10-μm section was generated, using OTF 5000 Cryostat. Tissue sections were immobilized on silanated slides and incubated overnight with 100 μg/mL of Z(HER2)-Red or Z(HER2)-Green in 2% BSA. Nonspecific Affiprobes were applied as controls, respectively. Slides were then washed in PBS and analyzed on an LSM 510 microscope.
For further confirmation of the Affiprobe specificity, BT474 and SKBR3 cells were incubated with Z(HER2)-Red with and without a 50-fold molar excess of HER2 Affibody molecules. As shown in Supplementary Figure 9, pre-incubation of HER2-positive cells with a competitor-abrogated Affiprobe binding. On the other hand, FACS experiments confirmed that therapeutic antibody transtuzumab routinely used for treatment of HER2-positive tumors did not compete with Affiprobes for receptor binding, even if applied with 100-fold molar excess (Supplementary Figure 10). This observation suggests that Affiprobes may become a unique tool to investigate the fate of HER2 receptors in trastuzumab-related studies.
As shown on Figure 2, no internalization of Affiprobes was observed after one hour of incubation. However, when the cells were washed and incubated in normal cell culture medium for additional 5 hours, low levels of Z(EGFR)-Red and Z(HER2)-Red, but no Z(EGFR)-Green or Z(HER2)-Green, were detected inside the cells. This difference was even more clear 18 hours later: While all Z(HER2)-Green and the majority of the Z(EGFR)-Green signal originated from the cell membrane, both mCherry-based probes, Z(EGFR)-Red and Z(HER2)-Red, underwent evident internalization, especially in the case of EGFR–targeted Affiprobe. Nevertheless, in both cases fluorescent signal was still detected on the cell surface (Figure 4). The difference in internalization between green and red proteins can be explained by the membrane-penetrating feature of mCherry protein. We have observed that continuous 24-hour exposure of MDA-MB468 and SKBR3 cells to Z(Taq)-Red resulted in receptor-independent internalization of the probe, while such an effect was not observed with non-specific Z(Taq)-Green probe (Supplementary Figure 11). These findings suggest that mCherry is not an optimal label to monitor receptor-mediated internalization for periods of time longer than 1h but, instead, it might be potentially used as a bimodal imaging and internalization-facilitating moiety with functions similar to cell-penetrating peptides such as HIV-1 Tat or poly-arginine [29, 30].
Figure 4.
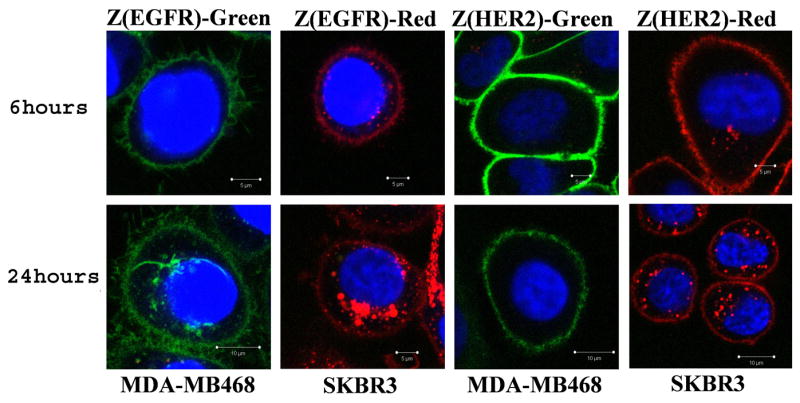
Affiprobes’ internalization pattern. MDA-MB468 and SKBR3 cells were loaded with 0.1 mg/mL of EGFR- or HER2-specific Affiprobes, respectively; After one hour, media were changed; and incubation was continued for 5 or 23 more hours. Cells were analyzed by confocal microscopy as described in Experimental section.
Our results are consistent with previous reports showing a low level of HER2-mediated internalization of Affibody molecules. For example, the work by Tran et al. indicated that only 20% of the Affibody molecules had internalized after 24h of incubation [31]. Similarly, although EGFR belongs to “rapid internalizing” receptors following their activation by EGF [32], and significant fraction of ligand-based fusion protein, EGF-EGFP, was internalized as soon as two hours after binding to EGFR (Supplementary Figure 12), we observed relatively low internalization level of EGFR-bound Affiprobes. Our observation seems to contrast with evident internalization of Z(EGFR:955)2 Affibody reported by Nordberg et al [33], however this apparent inconsistency might be due to different biological characteristic of dimeric Affibody molecules used in this study.
Conclusion
This work describes the design, production, and characterization of specificity, efficacy, and affinity of HER2- and EGFR-specific Affiprobes. The presented data indicate that Affiprobes, a novel type of imaging agent, are suitable for fluorescent analysis of both live cells and frozen tumor tissues. Several reasons make Affiprobes an attractive alternative to antibodies, antibody fragments, or peptides labeled with small fluorescent molecules. These probes are highly specific and photo-stable proteins. No need for additional labeling makes their optical characteristics extremely uniform. They can be obtained by efficient, no-hassle, and lower-cost production. In addition, our Affibody-based probes, unlike the natural ligands, do not activate the receptors.
This approach can easily be extended to target other cell-surface receptors/antigens as soon as Affibody molecules against other receptors become available. Moreover, different fluorescent proteins could be utilized to create broad-spectrum tools for multiplex analysis.
Experimental Section
Reagents
The Affibody molecules were kindly provided by our CRADA (co-operative research and development agreement) partner in Sweden (Affibody AB, Sweden, www.Affibody.se). Recombinant Human ErbB2/Fc chimeric protein was from R&D Chemicals. 1-ethyl-3[3-dimethylaminopropyl] carbiimide HCl and sulfo-NHS (N-hydroxysulfosuccinimide) were from Bio-Rad (Hercules, CA). Protein A/G was from Pierce (Rockford, IL).
Affiprobe cloning
The Affiprobe-coding plasmids pZ(HER2)-Red, pZ(HER2)-Green, pZ(EGFR)-Red, pZ(EGFR)-Green, pZ(Taq4:5)-Red, and pZ(Taq4:5)-Green contain a hexahistidine tag, targeting and detection moieties linked by a short flexible 6 amino-acid G3SG2 linker. The HER2-Affibody molecule Z(HER2:342) (Affibody AB, Sweden, www.Affibody.se) from the previously described plasmid pAfTxKDEL31 [21] was used in plasmids pZ(HER2)-Red and pZ(HER2)-Green as a targeting moiety. Anti-EGFR Affibody molecule Z(EGFR:1907) [34] was used in pZ(EGFR)-Red and pZ(EGFR)-Green. Anti-Taq polymerase Affibody molecule Z(Taq4:5) [11] was used in plasmids pZ(Taq4:5)-Red and pZ(Taq4:5)-Green. The Red fluorescent protein mCherry [35] and Green fluorescent protein EGFP [23] were used as detection moieties on the C terminus of the Affiprobes, and pRSET-mCherry (gift from Dr. Roger Y. Tsien, USCD, CA) and pEGFP (Clontech) plasmids were used as templates for PCR. The resulting plasmids were constructed by combining those parts through a mega-primer PCR and cloning them into pET23d+ vector (Novagen, EMD Chemicals, NJ). The inserts of the plasmids were sequenced. Amino-acid sequences of the Affiprobes and nucleotide sequence of the plasmids are presented in Supplementary Figures 1 and 2.
Affiprobe overexpression and purification
BL21 Star®(DE3) E. coli cells (Invitrogen, Carlsbad, CA), transformed with the Affiprobe plasmids, were grown in 1 L Super Broth media (MP Biomedicals, LLC, OH), supplemented with 100 μg/mL carbenicillin (Sigma-Aldrich, MO) until A600 reached value 1.0. Affiprobe expression was induced by IPTG (1 mM) for three hours. After that, cells were harvested, resuspended in 50 mL of the buffer A (25 mM imidazole, 300 mM NaCl, 50 mM sodium phosphate pH8), followed by two 5-minute cycles of ultrasonication on ice at 20W with a Cole-Parmer Ultrasonic Processor Model CP70T. The lysates were clarified by centrifugation at 50,000 rcf for 15 minutes at 8°C, followed by 0.45-μm syringe filtration. The cleared lyzates were loaded onto a 5-mL HisTrap HP column (GE HealthCare/Amersham), equilibrated with buffer A using a syringe pump NE-300 (New Era Pump Systems Inc., Wantagh, NY). The flow rate was 5 mL/min. An ÄKTAprime Plus chromatography system (Amersham Biosciences, Pittsburgh, PA) was used for elution of Affiprobe from the column by a Histidine-tagged Protein Purification, Gradient Elution” program with buffers A and B (buffer A containing 400 mM imidazole instead of 25 mM). The eluted fractions were analyzed by 4–12% gradient Bis-Tris PAAG (Invitrogen) electrophoresis in a MOPS-SDS buffer (Invitrogen), and the gel was stained with MicrowaveBlue® (PROTIGA Inc., Frederick, MD) (Supplementary Figure 3).
Characterization of Affiprobes by HPLC and MALDI-TOF MS
Acetonitrile was added to 50–100 μL of an Affiprobe preparation to the final concentration of 5%, and the resulting solution was injected into a 2.1 × 100 mm Poros R2 column (Applied Byosystems, CA) connected to the Waters HPLC system (626 Pump System, 6000 S Controller with Millenium-32 software and 996 Photodiode Array Detector). Chromatography was performed at a flow rate of 0.25 mL/min, using aqueous acetonitrile solvents (buffer A: 10 mM ammonium bicarbonate in water; buffer B: acetonitrile/water 60:40 by volume containing 10 mM ammonium bicarbonate). The column was equilibrated in 5% of buffer B. After sample injection, the column was rinsed for 10 min with 5% of buffer B; then a linear gradient elution was applied from 5 to 100% of buffer B for 60 min. Aliquots of 0.2–0.3 mL were collected, and Affiprobe-containing fractions were analyzed by MALDI-TOF MS on Voyager DePro; a 5-μL aliquot was used for N-terminal sequence analysis on the automated protein sequencer Procise 494 cLC (Applied Biosystems, Foster City, CA) to determine protein homogeneity and concentration.
FACS analysis
For FACS experiments, cells were trypsinized, counted, and aliquoted by 3 × 10⁵ for each Affiprobe or Affibody concentration and measured in triplicates. Reactions were run in PBS supplemented with 2% BSA for one hour on ice. In competition assay, cells were pre-incubated with Z(HER2:342) Affibody at indicated concentrations. Before acquisition, cells were washed twice with ice-cold PBS and analyzed by LSRII (BD Biosciences, San Jose, CA) equipped with blue and yellow lasers (λemission = 488 and 561 nm, respectively), and FACSDiVa software (BD Biosciences, San Jose, CA) for acquisition control. Subsequent data analysis was performed using FlowJo software (Tree Star, Inc., Ashland, OR) and nonlinear regression using GraphPad Prism (GraphPad Software, Inc., San Diego, CA).
Preparation of frozen tissue sections and staining with Affiprobes
Mice bearing subcutaneous SKOV3 tumors were sacrificed and tumors were extracted, followed by one-hour fixation in 4% paraformaldehyde in PBS at room temperature. Next, tumors were impregnated in 20% sucrose solution in PBS at 4°C overnight. Sucrose concentration was increased to 30% and incubation was prolonged for an additional 24h. Finally, tissue was flash-frozen in isopentane cooled with liquid nitrogen. Using Tissue-Tek (Sakura Finetek, Torrance, CA), tumor tissues were assembled in cutting blocks, and a 10-μm section was generated, using OTF 5000 Cryostat (Bridgeville, PA). Tissue sections were immobilized on silanated slides (Columbia, MD) and stored in -80°C. Sections were washed in -20°C acetone, dried, and incubated overnight with 100 μg/mL of Z(HER2)-Red or Z(HER2)-Green in 2% BSA. Nonspecific Affiprobes were applied as controls, respectively. Slides were then washed three times in PBS, dried, and mounted in mounting medium: DAPI-containing ProlongGold for nuclear counterstaining (Invitrogen, Carlsbad, CA). Finally, the samples were analyzed on an LSM 510 microscope at the settings described above.
Confocal microscopy
Cells were plated onto Lab-Tek chambered cover glass (Nalge Nunc International 4, Rochester, NY) and incubated with Affiprobes (100 μg/mL) for 1 at 37°C For internalization studies cells were incubated in growth medium at 37°C for indicated time intervals. Nuclei were counterstained with Hoechst 33342 at 1μg/mL. Directly before imaging, cells were rinsed three times with PBS. Frozen tissue sections were prepared as described above.
Images were taken with a Zeiss LSM 510 confocal microscope using a 40 × 1.3 NA Plan-Apochromat oil immersion objective and a multi-track configuration. The mCherry, EGFP and Hoechst 33342 (or DAPI) signals were collected using LP 560, BP 505-530, and BP 385-470 filters, after excitation with the 543 nm, 488 nm, and 364 nm laser lines, respectively. Images (8 bits, 1024 × 1024 pixels) were acquired with line average of 4 using the Zeiss AIM software.
Supplementary Material
Acknowledgments
The authors thank Dr. Roger Y. Tsien (http://www.tsienlab.ucsd.edu/, USCD, San Diego, CA) for the clone of mCherry (pRSET-mCherry). We also appreciate the support obtained from experts from Affibody AB and SAIC-Frederick, Inc., Barbara J Taylor of CCR FACS Core Facility, and Susan Garfield of CCR Confocal Microscopy Core Facility.
This project has been funded in whole or in part with federal funds from the National Cancer Institute, National Institutes of Health, under contract HHSN261200800001E. The content of this publication does not necessarily reflect the views or policies of the Department of Health and Human Services, nor does mention of trade names, commercial products, or organizations imply endorsement by the U.S. government. This research was supported in part by the Intramural Research Program of the NIH, National Cancer Institute, Center for Cancer Research.
Footnotes
Author Contributions I.L, R.Z., and J.C. generated the Affiprobe concept, designed the experiments, and prepared the manuscript. Protein analysis was done by R.F., O.C., and L.B. Affiprobe cloning was done by I.L. Protein purification was done by R.Z and I.L. Cell-staining experiments in vitro were performed by R.Z., M.K., and G.K-M.
References
- 1.Sorkin A, Goh LK. Exp Cell Res. 2009;315:683–96. doi: 10.1016/j.yexcr.2008.07.029. [DOI] [PubMed] [Google Scholar]
- 2.Yarden Y, Sliwkowski MX. Nat Rev Mol Cell Biol. 2001;2:127–37. doi: 10.1038/35052073. [DOI] [PubMed] [Google Scholar]
- 3.Nicholson RI, Gee JM, Harper ME. Eur J Cancer. 2001;37(Suppl 4):S9–15. doi: 10.1016/s0959-8049(01)00231-3. [DOI] [PubMed] [Google Scholar]
- 4.Mass RD. Int J Radiat Oncol Biol Phys. 2004;58:932–40. doi: 10.1016/j.ijrobp.2003.09.093. [DOI] [PubMed] [Google Scholar]
- 5.Wang SC, Hung MC. Semin Oncol. 2001;28:115–24. doi: 10.1016/s0093-7754(01)90289-1. [DOI] [PubMed] [Google Scholar]
- 6.Scholl S, Beuzeboc P, Pouillart P. Ann Oncol. 2001;12(Suppl 1):S81–7. doi: 10.1093/annonc/12.suppl_1.s81. [DOI] [PubMed] [Google Scholar]
- 7.Ross JS, Fletcher JA. Stem Cells. 1998;16:413–428. doi: 10.1002/stem.160413. [DOI] [PubMed] [Google Scholar]
- 8.Nord K, Gunneriusson E, Ringdahl J, Stahl S, Uhlen M, Nygren PA. Nat Biotechnol. 1997;15:772–7. doi: 10.1038/nbt0897-772. [DOI] [PubMed] [Google Scholar]
- 9.Nygren PA. FEBS J. 2008;275:2668–76. doi: 10.1111/j.1742-4658.2008.06438.x. [DOI] [PubMed] [Google Scholar]
- 10.Urica N. Uppsala University, Medicinska vetenskapsområdet, Faculty of Medicine, Department of Oncology, Radiology and Clinical Immunology, Biomedical PhD. 2008:50. [Google Scholar]
- 11.Orlova A, Tolmachev V, Pehrson R, Lindborg M, Tran T, Sandstrom M, Nilsson FY, Wennborg A, Abrahmsen L, Feldwisch J. Cancer Res. 2007;67:2178–86. doi: 10.1158/0008-5472.CAN-06-2887. [DOI] [PubMed] [Google Scholar]
- 12.Ekblad T, Tran T, Orlova A, Widstrom C, Feldwisch J, Abrahmsen L, Wennborg A, Karlstrom AE, Tolmachev V. Eur J Nucl Med Mol Imaging. 2008;35:2245–55. doi: 10.1007/s00259-008-0845-7. [DOI] [PubMed] [Google Scholar]
- 13.Tran T, Engfeldt T, Orlova A, Sandstrom M, Feldwisch J, Abrahmsen L, Wennborg A, Tolmachev V, Karlstrom AE. Bioconjug Chem. 2007;18:1956–64. doi: 10.1021/bc7002617. [DOI] [PubMed] [Google Scholar]
- 14.Tolmachev V, Nilsson FY, Widstrom C, Andersson K, Rosik D, Gedda L, Wennborg A, Orlova A. J Nucl Med. 2006;47:846–53. [PubMed] [Google Scholar]
- 15.Tolmachev V, Friedman M, Sandstrom M, Eriksson TL, Rosik D, Hodik M, Stahl S, Frejd FY, Orlova A. J Nucl Med. 2009;50:274–83. doi: 10.2967/jnumed.108.055525. [DOI] [PubMed] [Google Scholar]
- 16.Nordberg E, Orlova A, Friedman M, Tolmachev V, Stahl S, Nilsson FY, Glimelius B, Carlsson J. Oncol Rep. 2008;19:853–7. doi: 10.3892/or.19.4.853. [DOI] [PubMed] [Google Scholar]
- 17.Kramer-Marek G, Kiesewetter DO, Martiniova L, Jagoda E, Lee SB, Capala J. Eur J Nucl Med Mol Imaging. 2008;35:1008–18. doi: 10.1007/s00259-007-0658-0. [DOI] [PMC free article] [PubMed] [Google Scholar]
- 18.Lee SB, Hassan M, Fisher R, Chertov O, Chernomordik V, Kramer-Marek G, Gandjbakhche A, Capala J. Clin Cancer Res. 2008;14:3840–9. doi: 10.1158/1078-0432.CCR-07-4076. [DOI] [PMC free article] [PubMed] [Google Scholar]
- 19.Lundberg E, Hoiden-Guthenberg I, Larsson B, Uhlen M, Graslund T. J Immunol Methods. 2007;319:53–63. doi: 10.1016/j.jim.2006.10.013. [DOI] [PubMed] [Google Scholar]
- 20.Friedman M, Lindstrom S, Ekerljung L, Andersson-Svahn H, Carlsson J, Brismar H, Gedda L, Frejd FY, Stahl S. Biotechnol Appl Biochem. 2009;54:121–31. doi: 10.1042/BA20090096. [DOI] [PubMed] [Google Scholar]
- 21.Zielinski R, Lyakhov I, Jacobs A, Chertov O, Kramer-Marek G, Francella N, Stephen A, Fisher R, Blumenthal R, Capala J. J Immunother. 2009 doi: 10.1097/CJI.0b013e3181ad4d5d. [DOI] [PMC free article] [PubMed] [Google Scholar]
- 22.Puri A, Kramer-Marek G, Campbell-Massa R, Yavlovich A, Tele SC, Lee SB, Clogston JD, Patri AK, Blumenthal R, Capala J. J Liposome Res. 2008;18:293–307. doi: 10.1080/08982100802457377. [DOI] [PMC free article] [PubMed] [Google Scholar]
- 23.Shaner NC, Campbell RE, Steinbach PA, Giepmans BN, Palmer AE, Tsien RY. Nat Biotechnol. 2004;22:1567–72. doi: 10.1038/nbt1037. [DOI] [PubMed] [Google Scholar]
- 24.Zhang G, Gurtu V, Kain SR. Biochem Biophys Res Commun. 1996;227:707–11. doi: 10.1006/bbrc.1996.1573. [DOI] [PubMed] [Google Scholar]
- 25.Cao M, Cao P, Yan H, Ren F, Lu W, Hu Y, Zhang S. Appl Microbiol Biotechnol. 2008;79:423–31. doi: 10.1007/s00253-008-1447-9. [DOI] [PubMed] [Google Scholar]
- 26.Prinz A, Reither G, Diskar M, Schultz C. Proteomics. 2008;8:1179–96. doi: 10.1002/pmic.200700802. [DOI] [PubMed] [Google Scholar]
- 27.Zhang J, Campbell RE, Ting AY, Tsien RY. Nat Rev Mol Cell Biol. 2002;3:906–18. doi: 10.1038/nrm976. [DOI] [PubMed] [Google Scholar]
- 28.Giepmans BN, Adams SR, Ellisman MH, Tsien RY. Science. 2006;312:217–24. doi: 10.1126/science.1124618. [DOI] [PubMed] [Google Scholar]
- 29.Yoshikawa T, Sugita T, Mukai Y, Yamanada N, Nagano K, Nabeshi H, Yoshioka Y, Nakagawa S, Abe Y, Kamada H, Tsunoda S, Tsutsumi Y. J Mol Biol. 2008;380:777–82. doi: 10.1016/j.jmb.2008.05.047. [DOI] [PubMed] [Google Scholar]
- 30.Matsui H, Tomizawa K, Matsushita M. Nippon Yakurigaku Zasshi. 2003;121:435–9. doi: 10.1254/fpj.121.435. [DOI] [PubMed] [Google Scholar]
- 31.Tran TA, Rosik D, Abrahmsen L, Sandstrom M, Sjoberg A, Wallberg H, Ahlgren S, Orlova A, Tolmachev V. Eur J Nucl Med Mol Imaging. 2009 doi: 10.1007/s00259-009-1176-z. [DOI] [PubMed] [Google Scholar]
- 32.Capala J, Prahl M, Scott-Robson S, Ponten J, Westermark B, Carlsson J. J Neurooncol. 1990;9:201–10. doi: 10.1007/BF02341150. [DOI] [PubMed] [Google Scholar]
- 33.Nordberg E, Friedman M, Gostring L, Adams GP, Brismar H, Nilsson FY, Stahl S, Glimelius B, Carlsson J. Nucl Med Biol. 2007;34:609–18. doi: 10.1016/j.nucmedbio.2007.05.010. [DOI] [PubMed] [Google Scholar]
- 34.Friedman M, Orlova A, Johansson E, Eriksson TL, Hoiden-Guthenberg I, Tolmachev V, Nilsson FY, Stahl S. J Mol Biol. 2008;376:1388–402. doi: 10.1016/j.jmb.2007.12.060. [DOI] [PubMed] [Google Scholar]
- 35.Shu X, Shaner NC, Yarbrough CA, Tsien RY, Remington SJ. Biochemistry. 2006;45:9639–47. doi: 10.1021/bi060773l. [DOI] [PubMed] [Google Scholar]
Associated Data
This section collects any data citations, data availability statements, or supplementary materials included in this article.