Abstract
High resolution of NMR spectroscopic data of biosamples are a rich source of information on the metabolic response to physiological variation or pathological events. There are many advantages of NMR techniques such as the sample preparation is fast, simple and non-invasive. Statistical analysis of NMR spectra usually focuses on differential expression of large resonance intensity corresponding to abundant metabolites and involves several data preprocessing steps. In this paper we estimate functional components of spectra and test their significance using multiscale techniques. We also explore scaling in NMR spectra and use the systematic variability of scaling descriptors to predict the level of cysteine, an important precursor of glutathione, a control antioxidant in human body. This is motivated by high cost (in time and resources) of traditional methods for assessing cysteine level by high performance liquid chromatograph (HPLC).
Keywords: Cysteine level, functional ANOVA, Hurst exponent, 1H NMR spectra, scaling, wavelet spectra
1. Introduction
During the last decade, metabolomics has provided new opportunities to investigate complex dietary and nutritional questions by applying quantitative methodologies to information-rich profiles of dietary chemicals and their metabolites (German et al., 2003; 2004). NMR spectroscopy has been utilized in exploring physiological variations in macronutrient metabolism and has shown to be a fast, simple, and non-invasive method for “fingerprinting” of metabolic compounds. These advantages, however, are offset by complex spectral representations. For example, 1H NMR measures proton (hydrogen) signals from all plasma metabolites. Its principle, same as that used in MRI, is based on behavior of protons in atomic nuclei in a strong magnetic field. However almost every molecule in plasma contains multiple protons which results in overlapped and complex spectra. For this reason advanced signal processing techniques are increasingly used to analyze the NMR spectra.
Statistical analysis of NMR spectra traditionally focuses on differential expression of large resonance intensity corresponding to abundant metabolites and involves several data preprocessing steps such as baseline correction, peak alignment and normalization. These preprocessing steps are not perfect and often lead to ambiguities and information loss. Researchers have developed statistical methods and multidimensional NMR techniques that identify important metabolites contributed to toxicological and pathophysiological conditions or treatments by comparing the spectra.
A previously unaddressed question is what is the interplay of metabolites with small “energies” in spectra, how they “communicate”, and what is the position-lagged correlation of their spectral contents. In contrast to exploring a few large resonance intensity in the spectra after preprocessing of spectral curves, our analysis focuses on fractal properties of the output signals and regularities of their scalings. An advantage of the proposed method is that it does not require complicated preprocessing steps.
Formally speaking, we treat the spectra as functional data and employ functional data analysis (FDA) techniques (Ramsay and Silverman, 1997; 2002) for extracting spectral functional components characterized by treatments, subject blocking, and maybe some other factors of underlying experimental design. At the same time, we employ multiscale analysis that provides the tools for assessing the scaling of derived functional components which is an intrinsic property of functional observations and deriving descriptors that can be connected to energy activity of all metabolites in the spectrum.
Since wavelets and wavelet-based methodology offer domains in which the variation of a function can be explored at layers of nested scales, with the possibility of controlling the total energy allocated to each resolution level (Morris et al., 2006; Raz and Turetsky, 1999; Ruttimann, 1998; Sajda, et al., 2002; Vidakovic, 2001), we perform the multiscale analysis of spectral components in the wavelet domain.
Traditional applications of wavelets in NMR spectroscopy are for dimension and noise reduction. The statistical foundation of these methods is due to David Donoho and his coauthors. It is interesting that one of the first template functions to test performance of wavelet methods was a caricature of an NMR spectrum, the function bumps, (Donoho and Johnstone, 1994; 1995). More recent publications describe emerging methods in NMR data processing and some novel uses of wavelets in NMR processing (Günther, 2002; Hoch and Stern, 1996; Trbovic et al., 2005; Vannucci et al., 2005).
In the following, we suggest new methods to extract biologically significant information about the interactions of metabolites and their relationship with biological functions that is contained in NMR spectra by using scaling measures computed from wavelet coefficients. The method does not require preprocessing. As an application, we use the systematic variability scaling descriptors to predict cysteine concentrations from spectral data in which cysteine itself cannot be detected because its concentration is below detection limits. The measurement of plasma cysteine requires special blood collection techniques, and analysis by HPLC requires the long sample preparation time before actual HPLC running. On the other hand, NMR does not require any special blood collection technique or complicated sample preparation. NMR running time is much shorter than that of HPLC. The prediction of concentration of cysteine through multiscale analysis thereby could save the cost and time of analysis compared to other methods.
To focus on the effect of diurnal time on the scaling coefficient, we use functional repeated measure block design, a statistical design technique in which the observations are spectra. The influence of subjects on scaling index is not of interest and they serve as blocks. The scaling is assessed from the functional ANOVA components corresponding to the treatment effect of interest.
The paper is organized as follow. In Section 2 we describe the methodology of functional data analysis and wavelet-based assessment of scaling. The application of the methodology to assess the level of cysteine in blood plasma is provided in Section 3. Remarks and conclusions are given in Section 4.
2. Methodology
In this section we describe data and statistical methodology utilized in the analysis. Some technical details about the methods are deferred to Appendix. Our methodology is supported by two statistical techniques – (i) functional data analysis (FDA) and (ii) scaling assessment. Both techniques utilize multiresolution tools (wavelets) in their implementation.
2.1 Data
Human plasma samples were collected hourly over a 24 hour period (from 8:30 am to 8:30 am) from nine healthy adults under a protocol approved by the Emory University Institution Review Board. Subjects were given standardized, nutritionally balanced meals to provide caloric intake at estimated basal energy expenditure + 40% (derived from the Harris Benedict equation) and adequate protein at 15% of total energy intake. Total energy intake was provided as 15% protein (based on 0.8 gm protein/kg/day), 30% fat, and 55% carbohydrate. Subjects consumed each meal within 45 minutes (i.e., breakfast from 9:00–9:45 am, lunch from 1:00–1:45 pm and dinner from 5:00–5:45 pm) and the snack within 15 minutes (9:00–9:15 pm). Meals were provided as a percentage of total energy intake as breakfast (30%), lunch (30%), dinner (30%), and an evening snack (10%). Water was provided ad libitum throughout the admission. Activity (if desired) was confined to walking in the Emory General Clinical Research Center (GCRC) unit and only within the following time frames (after the hourly blood draw): 10:00–10:30 am, 12:00–12:30 pm, 14:00–14:30 pm, 16:00–16:30 pm, 18:00–18:30 pm and 20:00–20:30 pm. Otherwise, patients remained in their room, either lying in bed or sitting in a chair. Blood samples were collected via a heparinized butterfly needle and syringe. Tubes were spun in a microcentrifuge at 14,600 g for 30 seconds at room temperature to remove blood cells. The entire sampling procedure was less than 2 minutes for each hourly sample. Plasma samples were maintained on ice until convenient for transfer to a −70°C freezer.
Plasma samples were thawed and a 600 ml porions are mixed with 66 ml of deuterium oxide (D2O) containing DSS [3–(trimethylsilyl)–1–propanesulfonic acid sodium salt (C6H15NaO3SSi, 1% w/w)]. 1H NMR spectra were measured at 600 MHz on a Varian INOVA600 spectrometer with water presaturation at 25°C. The samples were maintained at 25°C in the magnet at least 10 minutes before measurement in order to ensure temperature stability. NMR spectra were measured with 64 scans into 16,384 data points over a spectral width of 6600.7 Hz, which resulted in an acquisition time of 2.55s per sample (d1=0, pulse=5ms, presaturation=1s, acquisition=1.5s). To check the reproducibility of the NMR analysis, spectra were acquired on identical samples at multiple time points (1.5h, 3h, 4h and 6h). The correlation coefficients of spectra were 0.96, 0.93, 0.97, 0.97.
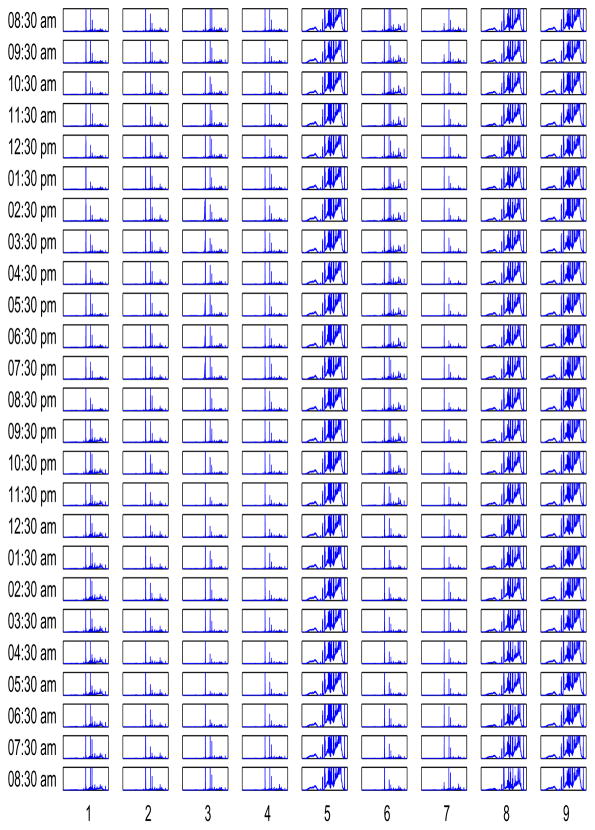
Figure 1 shows the 1H FT(Fourier transform)-NMR spectra that measure physiologic variations in macronutrients in human plasma. The columns correspond to individuals while the rows represent time of sampling. For each subgraph the horizontal axis is expressed as ppm (part per million) and ranges between 10 and 0, while the vertical axis gives an artificial magnitude adopted for comparison. Although the range of spectra for all patients is the same, note that the individuals 5,8, and 9 have “richer” spectra which can be attributed to varying rates of absorbtion, distribution, metabolism, and excretion.
Figure 1.
The 1H FT-NMR spectra of human plasma samples of nine patients for 25 time points. The columns correspond to individuals while the rows represent time instants. For each subgraph the horizontal axis is chemical shift expressed as ppm unit and ranges between 10 and 0, while the vertical axis gives NMR spectral intensity.
The level of cysteine was measured by HPLC with fluorescence detection of dansyl derivatives (Jones, 2002). This method requires two days for processing and cysteine derivation. Furthermore, HPLC running time took for 1 hour to evaluate the cysteine concentration. In this study, we extract the Hurst exponent from NMR spectrum to predict the level of concentration, although cysteine concentration of human plasma cannot be directly observed in the NMR spectrum. The acquisition time for one NMR spectrum is less than 15 minutes per sample. The preparation of sample for NMR is less than 5 minutes. Total time for NMR data collection per sample is less than 20 minutes. Comparing the NMR method to the HLPC method to extract the level of cysteine, the NMR approach of human plasma is much simpler and requires much less time than HPLC.
2.2 Assessing the spectral components via a functional design
Given that our observations are functions (spectra) observed under different conditions from different individuals, we employ functional data analysis (FDA) to estimate, separate, and test spectral components corresponding to different experimental factors.
FDA is a recent statistical methodology (Ramsay and Silverman, 1997; 2002) which treats functions, images, n-dimensional continuum objects as observations and performs standard statistical inference tasks (estimation, testing, classification) on such functional observations. Unlike the traditional statistical procedures that treat functional observations as multivariate data, the FDA makes inference on functions directly. For instance, estimating population mean function μ(·) or testing that it is equal to 0, based on the sample of functional observations, are typical inferential tasks in FDA.
The traditional ANOVA statistical technique explores the scalar data which are obtained under one or more (fixed- or random-level) experimental treatments. It estimates the population treatment means and tests their equality. The functional ANOVA (FANOVA) assumes that observations are functions, in our case NMR spectra and performs equivalent statistical inference.
It is assumed that the experiment in which the NMR spectra are measured is performed under p different treatments. Let b represent the number of subjects observed under the treatment i, where i = 1, 2, …, p. The total sample size is n = pb. It is of interest to estimate and test the functional contributions of the treatments to the spectral output. In the FANOVA jargon, the observed spectra siℓ(δ) can be represented as superposition of 4 functions, μ(δ) which is a common part, αi(δ) which is the contribution from the treatment i, βℓ(δ) which is the contribution of the subject ℓ (blocking variable), and the error term εiℓ(δ). This can be expressed as
| (2.1) |
Here the variable δ represents chemical shift expressed in ppm unit. It is assumed that for each fixed δ, εiℓ(δ) are independent normal random variables with mean zero and common variance σ2. A rigorous way to introduce (2.1) involves random fields and is provided in the Appendix. In simple terms, each observed spectra is a sum of the mean spectra, treatment effect component, subject effect component, and an error attributed to the measurement procedure and uncontrollable fluctuations. The validity of this analysis is contingent on precise alignment of spectra across times and subjects since the estimators involve averaging the observed functions.
In the context of our data, the repeated measures are calibrated so that measure 1 corresponds to 8:30 am. The each subsequent measure is 1 hour apart from the previous one, so that 25th measurement corresponds to 8:30 am of the following day, i.e., p = 25. A total of nine individuals are followed through all the treatment times. This study is not interested in differences among the individuals; thus, the subjects are considered as a blocking factor.
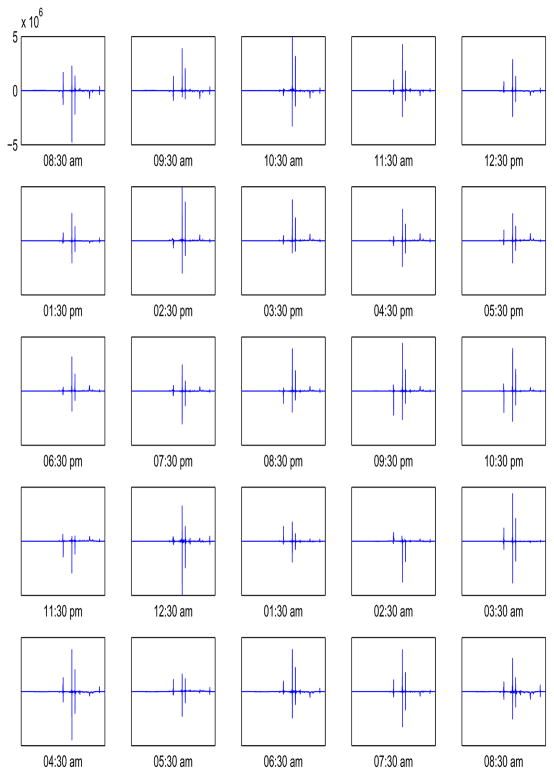
Our major interest is the hourly variation of nutritional metabolomics. We first separate the observed spectra as the sum of the mean spectra μ̂, time effects α̂i and the subject effects β̂j, j = 1,…, 9. The estimates of the time effects are shown in Figure 2. The mean hourly contributions to the spectra are estimated as in the Appendix. Note that α̂1 and α̂25 (upper left and lower right panels numbered as panels 1 and 25 respectively) are similar in size, as expected. Note also that at some hours there is increased expression of dominant metabolites compared to the average (panels 9:30 am, 3:30 pm, for example), while for some other times (panels 11:30 pm, 2:30 am, for example) the expression decreases.
Figure 2.
Estimators of the time effects α̂i for 25 times. The upper left panel shows α̂1 while the lower right panel shows α̂25.
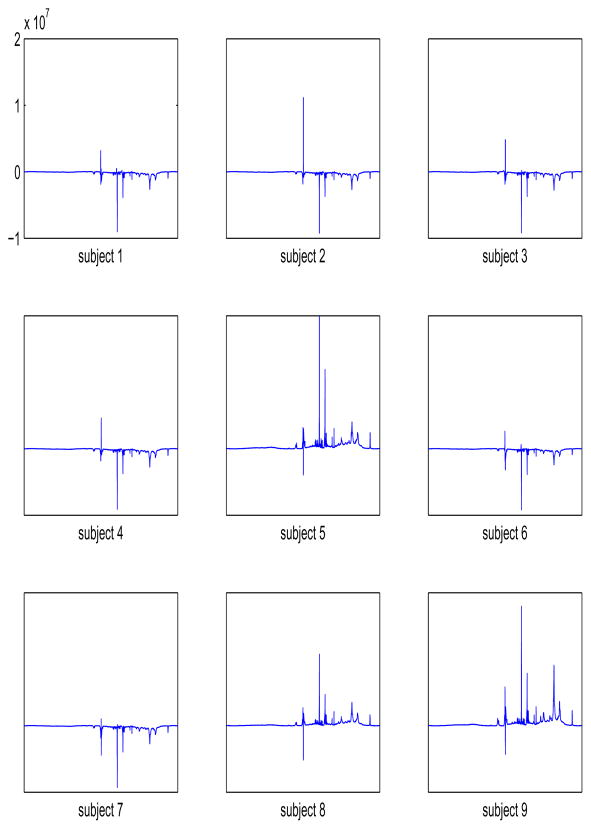
The estimators of the block effects, i.e., the mean contributions to the spectra by each subject, are given in Figure 3. Although these estimators are not of interest in assessing the treatment means, their inequality is desirable since it shows that our model accounts for the variability among the subjects contributing to the precision of the assessment of the differences between the treatment means. This is a universal benefit of blocking in all experimental designs where blocking is possible. As evident in Figure 3, the mean contribution of each subject shows a different pattern. For example, subjects 5, 8, 9 show increased expression of dominant features compared to the average and subjects 1, 3, 4, 6, 7 show a decrease in the expression.
Figure 3.
Estimators of the block effects for the 9 individuals.
The FANOVA tests (details in Appendix) showed that both null hypotheses and were rejected with p-values of 0.0001 and 10−6, strongly suggesting that the mean functional contributions to the spectra are non-zero functions and vary significantly with δ, time and subjects.
Although these results are important, their practicality is limited. Other relevant but exogenous parameters influence the functional estimators. This motivated us to summarize the functional components of spectra via scalar descriptors with realistic physical interpretation, as described in the following Section.
2.3 Scaling of spectral components
Most high frequency biomedical measurements exhibit scaling. The regular scaling of high frequency data has been used in statistical modeling tasks involving regression, classification, and experimental design (Peng et al., 1992; Shi et al., 2006). The scaling is described as regular decay of the energy in signals when this energy is progressively measured at scales for which the resolution is increasing. More precisely, the regular scaling is described by a linear relationship between the log-scale (scale defined as reciprocal of the frequency) and log-average-energy within the scale. The slope of this linear relationship uniquely determines the Hurst exponent, H, a constant between 0 and 1 that characterizes the scaling. For example, white noise is characterized by H = 1/2, all turbulent signals have H = 1/3, and “random DNA walk” corresponding to non-coding parts of human DNA have H ≈ 0.6. Most neural, ocular, and many other physiological high-frequency measurements scale and this scaling has been used as a statistical summary of the outputs. Theoretical details describing the estimation of the Hurst exponent are given in the Appendix.
Next, we briefly discuss the rationale for use of scaling to summarize NMR spectra. When trends in data are irrelevant and when smoothing does not make sense, scaling analysis of row noisy measurements may yield useful information. For example, in the study on links between dynamics of change of pupil diameter and ocular pathologies, Shi et al. (2006) argue that trends in high frequency measurements (> 200 Hz) are irrelevant since they could be affected by the change of environmental light intensity, clearly not related to the pathologies. However, the scaling in these measurements assessed by the Hurst exponent carries discriminatory information about the eye pathologies. Similarly, traditional analysis of 1H NMR spectra of human plasma can be considered irrelevant to the plasma cysteine concentration because the dominant spectral measurements are insensitive to directly detect cysteine.
Another important property of scaling is that it is invariant with respect to shift/scale of the spectra, and does not require data preprocessing steps such as baseline correction, peak alignment and normalization, unless performed on one of the FANOVA components. The consequence is that the estimator of the Hurst exponent is robust with respect to changes in a few dominant resonance intensities corresponding to expressed metabolites or marker chemicals.
If the signal has high Hurst exponent, the autocorrelations (correlations between the signal and its shifts) are strong, signifying considerable internal regularity. On the other hand, the signals with low Hurst exponent exhibit intrinsic irregularity and antipersistency. In terms of NMR spectra, spectra with a larger Hurst exponent would possess more internal regularity and autocorrelation. This informally means that metabolites communicate more when the Hurst exponent is higher and that they are more “co-expressed.”
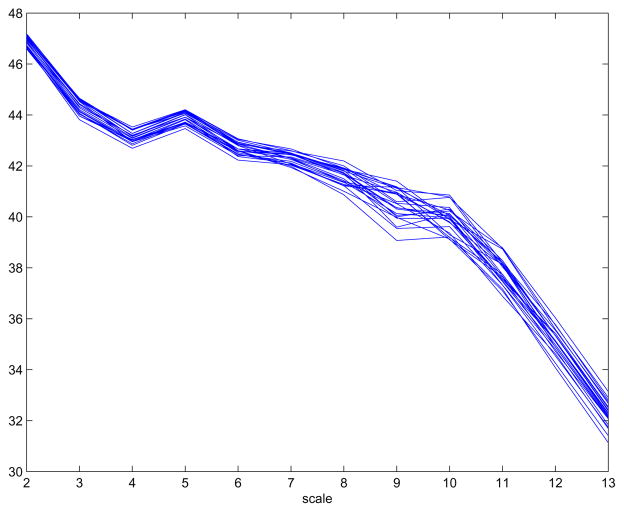
The signature of scaling in the NMR spectral data is visible in a logscale diagram (Figure 4). The horizontal axis represent diadic scales in which the largest number (13 in Figure 4) corresponds to the Nyquist frequency i.e., the finest discernable scale. Note that the slope of the graph in the logscale diagram corresponding to scales 10, 11, 12, and 13 differ from the slope corresponding to scales that are below 10. This is an artifact of preprocessing of spectra. The low scales of logscale diagram (2–5) are not of interest in assessing the scaling since their values are affected by global energy of the spectra and a few energetic peaks. The region with fairly constant slope in the middle of the diagram is used to calculate the Hurst exponent.
Figure 4.
An average logscale diagram for each of 25 times.
We estimated the Hurst exponent from each of the spectra normalized by subtracting the mean estimator, μ̂(δ). The rationale is to inspect the scaling of the functional contributions for time and subject only. From , i = 1,…, 25, ℓ = 1,…, 9, the matrix of Hurst exponents, {Hiℓ} is obtained. Assume that each Hiℓ can be decomposed to a “grand mean” H′, effect of time , effect of subject , and an error εiℓ in the form of a block-design model
A standard analysis of this model yielded that the hypothesis , i =1,…, 25 was rejected (p-value 0.0013); that is, there is a significant difference in scaling with respect to times. The hypothesis , ℓ = 1,…, 9 was rejected as well (p-value < 0.0001), and a significant difference in scaling is attributed to subjects. This is expected and justifies the blocking. We note that if this blocking was omitted, i.e., if Hiℓ’s are analyzed by one way ANOVA,
the hypothesis , i = 1,…, 25 was not rejected, in fact unaccounted variabilities among the subjects masked the variability in times.
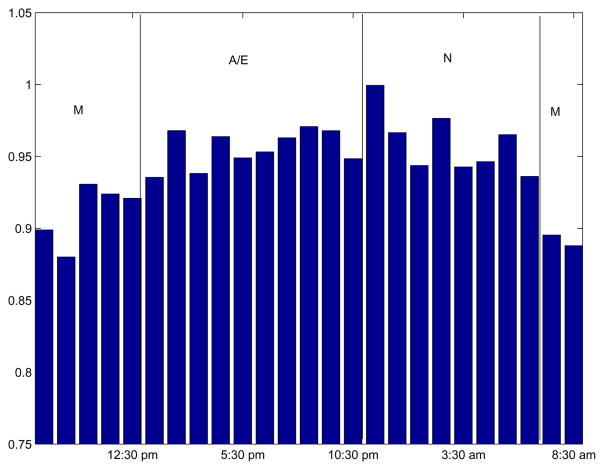
Figure 5 shows the hourly variations of Hurst exponent, estimated from the FANOVA components corresponding to the time effects αi, as in Figure 2). Since αis are obtained by manipulating spectra, the alignment is necessary (e.g., common average spectra is subtracted). We argue that even if the alignment is not perfect and a few big peaks result from a misalignment, the scaling is not affected if robust measures of average level energies are used, as proposed in Stoev et al. (2005).
Figure 5.
Hourly variations of Hurst exponent as bar plot (left) and as compass plot (right).
The left panel shows the average Hurst exponent by the hour, while the right panel shows a compass-plot of the truncated average Hurst exponent. It is noticeable that H values tend to be higher in the afternoon/evening and tend to be lower in the night to morning. This indicates that the metabolites have more tendency to be co-expressed in the late afternoon than in the morning. The three classes of time of day (morning, afternoon/evening, night) we used are from the previous PCA (Principal Components Analysis) results of the data Park et al. (2006).
2.4 Assessing the level of cysteine
Cysteine (Cys) is an amino acid used for protein synthesis as well as many other metabolic functions. Therefore, metabolic changes could potentially serve as a biological response indicator of plasma cystaine. This suggests that scaling measure of NMR spectra of human plasma could be useful to assess the level of cysteine.
Cysteine is obtained directly from the diet and also from the essential amino acid, methionine (Met), which is metabolized in individuals by the transulfuration pathway to form Cys (Hoffer, 2002). In addition to use in the primary sequence of most proteins, both Met and Cys are required for other metabolic functions. Met is converted to S-adenosylmethionine, which is used for methylation reactions (Bottiglieri, 2002) for structural and functional modifications of proteins, RNA and DNA, as well as synthesis of phospholipids and signaling molecules. The carbon skeleton of Met is also used for biosynthesis of polyamines, which are required for cell division and cell growth (Wallace and Caslake, 2001). Cys is used for biosynthesis of glutathione (GSH), coenzyme A, taurine and sulfate (Stipanuk and Watford, 2006). GSH functions in redox regulation (Jones, 2002) and detoxification of oxidants and reactive electrophiles (Jones et al., 2005). Coenzyme A is central to fatty acid metabolism and the citric acid cycle; taurine is utilized for bile acid synthesis and osmotic regulation (Hansen, 2001); sulfate is used as a structural component of oligosaccharides (Sugahara and Kitagawa, 2000), transport of steroid hormones (Song, 2001) and detoxification of foreign compounds (McCarver and Hines, 2002). Both are required for physiologic processes in addition to maintenance of protein synthesis and nitrogen balance.
Accordingly, Cys could have a central role in controlling metabolism. Consequently we tested the association of the Hurst exponents of NMR spectra with a quantitative measures of Cys in simultaneously collected samples to determine whether a useful estimate of plasma Cys could be derived from the metabolic spectrum.
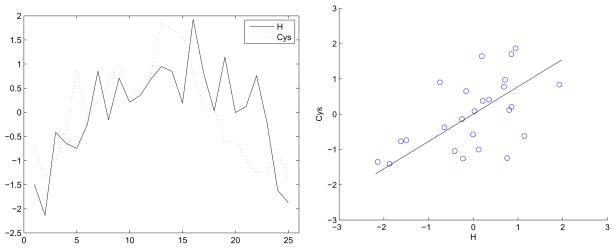
Figure 6 shows the plot of the hourly variation of the average Cys level with the average Hurst exponent and the associated scatter plot. The biological implication of co-behavior pattern of the Cys level and the scaling measure reveals that we can make predictions of Cys level based on the Hurst exponents of 1H NMR spectra. This means that, in principle, we can use 1H NMR spectra for nutritional assessment, i.e., we can assess Cys levels even though Cys is not directly detected in the sample.
Figure 6.
Hourly variation of cysteine level with Hurst exponent and associated scatter plot.
The rationale is the following. When Cys level is high, the major metabolic pathways producing different metabolites are well regulated. The links between metabolites are strong in the sense that there is required coordination of metabolism of lipids, carbohydrates, and proteins. On the 1H NMR spectra, this well regulated link results in a more regular appearance. Some portion of this regularity is likely to be due to multiple signals arising from the same chemicals, especially among the metabolites not so distant in the chemical shift. This regularity is properly sensed and assessed by wavelet spectra and is measured by Hurst exponent. The higher exponent corresponds to more regulated spectra which is linked to the increased level of Cys.
3. Conclusions
NMR spectroscopy of human plasma and urine is attractive because it requires minimal sample preparation, has a short run time and provides quantitative spectral information that depends upon intrinsic properties of the biologic molecules. In this study, we performed FDA and scaling assessment of NMR spectra and proposed a means to predict Cys concentration using the scaling in the 1H NMR data.
Such a wavelet-based global spectral analysis can be extended to local analysis that will identify neighborhoods of metabolites close in chemical shift sense, responsible for particular changes. This analytic approach may be useful for single, high-throughput analysis for chemical assessment of cysteine as well as other key nutrients.
Acknowledgments
This research was supported by NIH Grants DK066008, ES012929 and M01RR00039 at Emory University and NSF Grants DMS 0505490 and ATM 0724524 at Georgia Institute of Technology. We thank the editorial team for insightful comments that improved the presentation.
Technical appendix
In this Technical Appendix we give some details concerning the functional ANOVA and wavelet-based assessment of scaling.
The functional ANOVA (FANOVA) model has been utilized by several authors. For example, Ramsay and his team use the FANOVA to model lip motion from acoustical data (Ramsay et al., 1996) and Fan and Lin (1998) apply it to test longitudinal effects of business advertisement, while Abramovich et al. (2004) apply a functional block design on the data coming from sport medicine.
In the FANOVA, the observations y are modeled as
where σ > 0 is the diffusion coefficient, p and s are finite integers, μ(t) and αi(t) are (unknown) s-dimensional mean and treatment effect functions and Wiℓ(t) are independent s-dimensional standard Wiener processes. To ensure identifiability of treatment effect functions αi, it is standardly imposed:
| (3.1) |
It is understood that the observations y are taken at a regular grid in s-dimensional space tm = (t1,m,…, ts,m),
and that N is the discretization size.
The standard least square estimators for μ(t) and αi(t)
where , are obtained by minimizing the discrete version of LMSSE Ramsay and Silverman (1997, p 141),
subject to discretized version of constraint (3.1).
The fundamental ANOVA identity becomes functional identity,
with SST(t) = Σi,ℓ[yil (t)−ȳ..(t)]2, SSTr(t) = Σini[yi.(t)−ȳ..(t)]2, and SSE(t) = Σi,ℓ[yiℓ(t)−ȳi.(t)]2. If MSE(t) = SSE(t)/(n − p) and MSTr(t) = SSTr(t)/(p − 1), then for each t, the function
is distributed as non-central . Angelini and Vidakovic (2003) use False Discovery Rate procedure in multiple F-tests in the wavelet domain to regularize functional treatment effects. For more on functional statistical designs, use of decorrelating transformations (wavelets), and estimation, regularization and testing of design components, see Brown, et al. (2001), Fan (1996), Fan and Lin (1998), Raz and Turetsky (1999), and Vidakovic (2001).
The self-similarity is an inherent property of many high-frequency functional responses. If the data are self-similar, that is, scale in a regular fashion, then a single descriptor in the form of a Hurst exponent, fully describes the scaling.
There are many ways to assess the self-similarity and to estimate the Hurst exponent. We mention the methods based on contrasting estimators of variability, on various aspects of Fourier and wavelet spectra, methods based on level-crossings, filtering, etc. The literature on this methodology is rich and the monograph Doukhan et al. (2002) provides a comprehensive overview.
We utilized the wavelet-based estimation of the Hurst exponent because of its locality and robustness. A brief description of wavelet spectra follows.
Assume that the signal (1H NMR data) is wavelet-transformed to a range of scales j0 ≤ j ≤ j1, where the j0 scale contains wavelet coefficients corresponding to the coarsest details while the j1 scale corresponds to the details in the highest resolution. A complete wavelet transformation contains in addition the scaling coefficients, but they play no role in determining the Hurst exponent. The structure of decomposition (details of various scales and scaling exponents) is the embodiment of the multiresolution analysis performed by wavelets. The Hurst exponent quantifies scaling behavior in the data, and classifies these intrinsic autocorrelations as persistent (H > 0.5), antiperspirant (0 < H < 0.5), or white noise (H = 0.5). Researchers realized the practical importance of scaling descriptors and utilized them in the statistical inference tasks, see for instance Shi et al. (2006) and references therein. Persistent signals show more visual regularity while the antiperspirant signals exhibit irregular, almost a zig-zag appearance.
The magnitudes of the detail coefficients over all scales are second order descriptors of the process and, in total, constitute a wavelet spectrum of the signal. Formally, within the scale j, averages of squared wavelet coefficients (energies) are found. We denote these averages by E(j). The logarithms of such average energies are proportional to the scale index j and this proportionality is directly linked to the Hurst exponent; that is,
| (3.2) |
where a is the slope, and C is an intercept. The slope a can be expressed in terms of the Hurst exponent H as a = 2H − 1, which provides a practical approach to Hurst exponent estimation. For more information, consult Abry et al. (1998), Abry et al. (2003), and Stoev et al. (2005).
References
- Angelini C, Vidakovic B. Some novel methods in wavelet data analysis: wavelet Anova, F-test shrinkage, and Γ-mMnimax wavelet shrinkage. In: Krishna M, Radha R, Thangavely S, editors. Wavelets and their Applications. Allied Publishers; 2003. pp. 31–45. [Google Scholar]
- Abramovich F, Antoniadis A, Sapatinas T, Vidakovic B. Optimal testing in functional analysis of variance models. Int J Wavelets, Multiresolution Info Processing. 2004;2:323–349. [Google Scholar]
- Abry P, Flandrim P, Taqqu M, Veitch D. Self-similarity and long-range dependence through the wavelet lens. In: Doukhan P, Oppenheim G, Taqqu M, editors. Theory and Applications of Long-Range Dependence. Birkhaüser; Boston: 2003. pp. 557–577. [Google Scholar]
- Abry P, Veitch D, Flandrim P. Long-range dependence: revisiting aggregation with wavelets. Journal of Time Series Analysis. 1998;19:256–266. [Google Scholar]
- Bottiglieri T. S-Adenosyl-L-methionine (SAMe): from the bench to the bedside–molecular basis of a pleiotrophic molecule. American Journal of Clinical Nutrition. 2002;76:1151S–1517S. doi: 10.1093/ajcn/76/5.1151S. [DOI] [PubMed] [Google Scholar]
- Brown PJ, Fearn T, Vannucci M. Bayesian wavelet regression on curves with application to a spectroscopic calibration problem. J Amer Statist Assoc. 2001;96:398–408. [Google Scholar]
- Donoho DL, Johnstone IM. Ideal special adaptation via wavelet shrinkage. Biometrika. 1994;81:425–455. [Google Scholar]
- Donoho DL, Johnstone IM. Adapting to unknown smoothness via wavelet shrinkage. J Amer Statist Assoc. 1995;90:1200–1224. [Google Scholar]
- Doukhan P, Oppenheim G, Taqqu MS, editors. Theory and Applications of Long-range Dependence. Birkhaüser; Boston: 2002. [Google Scholar]
- Fan J. Test of significance based on wavelet thresholding and Neyman’s truncation. J Amer Statist Assoc. 1996;91:674–688. [Google Scholar]
- Fan J, Lin SK. Test of significance when data are curves. J Amer Statist Assoc. 1998;93:1007–1021. [Google Scholar]
- German JB, Roberts MA, Watkins SM. Genomics and metabolomics as markers for the interaction of diet and health: lessons from lipids. J Nutr. 2003;133:2078S–2083S. doi: 10.1093/jn/133.6.2078S. [DOI] [PubMed] [Google Scholar]
- German JB, et al. Metabolomics in the opening decade of the 21st century: Building the roads to individualized health. J Nutr. 2004;134:2729–2732. doi: 10.1093/jn/134.10.2729. [DOI] [PubMed] [Google Scholar]
- Günther UL, Ludwig C, Ruterjans H. WAVEWAT-Imporoved solvent suppression in NMR spectra employing wavelet transforms. Submitted to J Magn Reson. 2002;156:19–25. doi: 10.1006/jmre.2002.2534. [DOI] [PubMed] [Google Scholar]
- Hansen SH. The role of taurine in diabetes and the development of diabetic complications. Diabetes/Metabolism Research Reviews. 2001;17:330–46. doi: 10.1002/dmrr.229. [DOI] [PubMed] [Google Scholar]
- Hoch CJ, Stern AS. NMR Data Processing. Wiley-Liss; 1996. [Google Scholar]
- Hoffer LJ. Methods for measuring sulfur amino acid metabolism. Curr Opin Clin Nutr Metabol Care. 2002;5:511–517. doi: 10.1097/00075197-200209000-00009. [DOI] [PubMed] [Google Scholar]
- Jones DP. Redox state of GSH/GSSG couple: Assay and biological significance. Meth Enzymol. 2002;348:93–112. doi: 10.1016/s0076-6879(02)48630-2. [DOI] [PubMed] [Google Scholar]
- Jones DP, Brown LA, Sternberg P. Variability in glutathione-dependent detoxication in vivo and its relevance to detoxication of chemical mixtures. Toxicology. 1995;105:267–274. doi: 10.1016/0300-483x(95)03221-z. [DOI] [PubMed] [Google Scholar]
- McCarver DG, Hines RN. The ontogeny of human drug-metabolizing enzymes: phase II conjugation enzymes and regulatory mechanisms. J Pharmacol Exp Therap. 2002;300:361–366. doi: 10.1124/jpet.300.2.361. [DOI] [PubMed] [Google Scholar]
- Morris JS, Brown PJ, Herrick RC, Baggerly KA, Coombes KR. Bayesian analysis of mass spectrometry proteomics data using wavelet based functional mixed models. University of Texas, MD Anderson Cancer Center Department of Biostatistics and Applied Mathematics Working Paper Series; 2006. [Google Scholar]
- Park Y, et al. Technical report. Department of Medicine, Emory University; 2006. Nutritional Metabolomics: Statistical pattern recognition of diurnal variation of macronutrients in human plasma by high-resolution 1h nmr spectroscopy. [Google Scholar]
- Peng CK, Buldyrev SV, Goldberger AL, Havlin S, Sciortino F, Simons M, Stanley HE. Long-Range Correlation in Nucleotide Sequences. Nature. 1992;356:168–170. doi: 10.1038/356168a0. [DOI] [PubMed] [Google Scholar]
- Ramsay JO, Munhall KG, Gracco VL, Ostry DJ. Functional data analysis of lip motion. Journal of the Acoustical Society of America. 1996;99:3718–3727. doi: 10.1121/1.414986. [DOI] [PubMed] [Google Scholar]
- Ramsay JO, Silverman BW. Functional Data Analysis. Springer-Verlag; 1997. [Google Scholar]
- Ramsay JO, Silverman BW. Applied Functional Data Analysis Methods and Case Studies. Springer-Verlag; 2002. [Google Scholar]
- Raz J, Turetsky B. Wavelet ANOVA and fMRI. Proceedings of SPIE: Wavelet Applications in Signal and Image Processing VII. 1999;3813:561–570. [Google Scholar]
- Ruttimann UE, et al. Statistical Analysis of functional MRI sata in the wavelet domain. IEEE Transactions on Medical Imaging. 1998;17:142–154. doi: 10.1109/42.700727. [DOI] [PubMed] [Google Scholar]
- Sajda P, Laine A, Zeevi Y. Multi-resolution and wavelet representations for identifying signatures of disease. Disease Markers. 2002;18:339–363. doi: 10.1155/2002/108741. [DOI] [PMC free article] [PubMed] [Google Scholar]
- Shi B, Moloney KP, Pan Y, Leonard VK, Vidakovic B, Jacko J, Sainfort F. Classification of high frequency pupillary responses using schur monotone descriptors in multiscale domains. Journal of Statistical Computation and Simulation. 2006;76:431–446. [Google Scholar]
- Song WC. Biochemistry and reproductive endocrinology of estrogen sulfo-transferase. Annals of the New York Academy of Sciences. 2001;948:43–50. doi: 10.1111/j.1749-6632.2001.tb03985.x. [DOI] [PubMed] [Google Scholar]
- Stipanuk MH, Watford M. Amino acid metabolism. In: Stipanuk MH, editor. Biochemical, Physiological and Molecular Aspects of Human Nutrition. Saunders/Elsevier; 2006. pp. 320–418. [Google Scholar]
- Stoev S, Taqqu M, Park C, Marron JS. On the wavelet spectrum diagnostic for hurst parameter estimation in the analysis of internet traffic. Computer Networks. 2005;48:423–445. [Google Scholar]
- Sugahara K, Kitagawa H. Recent advances in the study of the biosynthesis and functions of sulfated glycosaminoglycans. Current Opinion in Structural Biology. 2000;10:518–527. doi: 10.1016/s0959-440x(00)00125-1. [DOI] [PubMed] [Google Scholar]
- Trbovic N, Dancea F, Langer T, Günther U. Using wavelet de-noised spectra in NMR screening. J Magn Reson. 2005;173:280–287. doi: 10.1016/j.jmr.2004.11.032. [DOI] [PubMed] [Google Scholar]
- Vannucci M, Sha N, Brown PJ. NIR and mass spectra classification: Bayesian methods for wavelet-based feature selection. Chemometrics and Intelligent Laboratory Systems. 2005;77:139–148. [Google Scholar]
- Vidakovic B. Wavelet-based functional data analysis: theory, applications and ramifications. F3399. In: Kobayashi T, editor. Proceedings of The 3rd Pacific Symposium on Flow Visualization and Image Processing; 2001. [Google Scholar]
- Wallace HM, Caslake R. Polyamines and colon cancer. Eur J Gastroenterol Hepatol. 2001;13:1033–1039. doi: 10.1097/00042737-200109000-00006. [DOI] [PubMed] [Google Scholar]


