Abstract
Background & Aims
Nonalcoholic fatty liver disease (NAFLD), the most common form of chronic liver disease in developed countries, may progress to nonalcoholic steatohepatitis (NASH) in a minority of people. Those with NASH are at increased risk for cirrhosis and hepatocellular carcinoma. The potential risk and economic burden of utilizing liver biopsy to stage NAFLD in an overwhelmingly large at-risk population are enormous; thus, the discovery of sensitive, inexpensive, and reliable noninvasive diagnostic modalities is essential for population-based screening.
Methods
Acoustic Radiation Force Impulse (ARFI) shear wave imaging, a noninvasive method of assessing tissue stiffness, was used to evaluate liver fibrosis in 172 patients diagnosed with NAFLD. Liver shear stiffness measures in 3 different imaging locations were reconstructed and compared to the histologic features of NAFLD and AST-to-platelet ratio indices (APRI).
Results
Reconstructed shear stiffnesses were not associated with ballooned hepatocytes (p = 0.11), inflammation (p = 0.69), nor imaging location (p = 0.11). Using a predictive shear stiffness threshold of 4.24 kPa, shear stiffness distinguished low (fibrosis stage 0–2) from high (fibrosis stage 3–4) fibrosis stages with a sensitivity of 90% and a specificity of 90% (AUC of 0.90). Shear stiffness had a mild correlation with APRI (R2 = 0.22). BMI > 40 kg/m2 was not a limiting factor for ARFI imaging, and no correlation was noted between BMI and shear stiffness (R2 = 0.05).
Conclusions
ARFI imaging is a promising imaging modality for assessing the presence or absence of advanced fibrosis in patients with obesity-related liver disease.
Keywords: ultrasound, ARFI imaging, shear wave, elasticity, stiffness, nonalcoholic steatohepatitis, nonalcoholic fatty liver disease, hepatic fibrosis, cryptogenic cirrhosis
INTRODUCTION
Nonalcoholic fatty liver disease (NAFLD), a serious public health concern, is increasing with the rise in obesity and is currently the most common form of chronic liver disease in both children and adults [1–2]. Estimates suggest that approximately 80 million Americans may have NAFLD [3]. NAFLD is a clinicopathologic condition associated with over-accumulation of fat in the liver; it is characterized by simple steatosis on the benign end of the spectrum with progression to nonalcoholic steatohepatitis (NASH), an intermediate stage of the disease, and increased risk for progression to cirrhosis, need for liver transplant and/or hepatocellular carcinoma in a minority of patients with NAFLD [4–6]. The clinician has limited ability to characterize disease severity by patient history, physical examination, routine laboratory studies and/or radiological imaging modalities [6]. Liver biopsy remains the only reliable “gold standard” method for distinguishing benign steatosis from NASH and staging the severity hepatic fibrosis for patients with obesity-related liver disease [7]. However, due to increased cost, possible risk, and health-care resource utilization, an invasive liver biopsy is poorly suited as a diagnostic test for such a prevalent condition. Furthermore, the histologic lesions of NASH are unevenly distributed throughout the liver parenchyma; therefore, sampling error of liver biopsy can result in substantial stratification and staging inaccuracies [8].
Ultrasound is an ideal technology to non-invasively characterize advanced liver disease. The majority of the liver can be interrogated using a variety of imaging locations (i.e. both inter- and subcostally). Further, ultrasound equipment and scanners have become much more compact, are portable, can be utilized in variety of clinical settings (inpatient and outpatient, clinical and radiology suites), and can be performed at the bedside as diagnostic tools or for assessment of anatomy at the time of liver biopsy.
The use of ultrasound to characterize liver stiffness has been explored with transient elastography (FibroScan®, EchoSens, Paris, France), which has demonstrated promise as a non-invasive tool for staging hepatic fibrosis [9]. While body mass indices (BMI) > 28 kg/m2 have been identified as an independent risk factor for failure to obtain a measure of liver elastography [10], more recent clinical studies using the FibroScan® system have appeared in the literature that have demonstrated increasing liver stiffness with advanced fibrosis in patients with NAFLD [11–13]. Patients with ascites, however, present challenges for systems such as the FibroScan® since shear waves will not propagate through fluids, making shear stiffness reconstructions in these patients impossible with transient elastography; this is not a limitation for the Acoustic Radiation Force Impulse (ARFI) shear wave imaging technique presented herein [14–15]. Transient tissue deformations of several microns are induced in liver tissue by acoustic radiation force, generating shear waves that can be used to estimate the tissue stiffness, as detailed in [15].
Given NAFLD’s enormous public health burden, there is a great need for the development and optimization of a non-invasive approach to determine the presence or absence of advanced liver disease. We evaluated ARFI shear wave imaging as a potential non-invasive method to assess hepatic fibrosis stage in patients with biopsy-proven NAFLD.
PATIENTS AND METHODS
Study Design and Population
We performed a retrospective/prospective study of patients with biopsy-proven NAFLD at the Duke University Medical Center. Patients were enrolled from March 2008 to March 2010. Patients who met the following criteria were used for our analysis (n=172): (1) age 18 or older; (2) available liver histology data; (3) no significant alcohol consumption (<14 drinks/week in men or < 7 drinks / week in women on average within the past 2 years); (4) no other coexisting causes of chronic liver disease as determined by a hepatologist. This study was approved by the Institutional Review Board at Duke University, and each study subject provided written informed consent prior to enrollment in the study. Table 1 shows a summary of the study subject enrollment metrics.
Table 1.
Study Subject Demographics
| Totals | Successful Stiffness Reconstruction | Unsuccessful Stiffness Reconstruction | |
|---|---|---|---|
| Study Subjects | 172 | 135 | 37 |
| Gender | |||
| Male | 65 | 51 | 14 |
| Female | 107 | 84 | 23 |
| Body Mass Index | |||
| < 18 | 1 | 1 | 0 |
| 18–23 | 8 | 8 | 0 |
| 23–30 | 45 | 39 | 6 |
| 30–40 | 85 | 68 | 17 |
| >40 | 33 | 19 | 14 |
| Fibrosis Stage | |||
| 0 | 31 | 26 | 5 |
| 1 | 39 | 34 | 5 |
| 2 | 46 | 35 | 11 |
| 3 | 36 | 22 | 14 |
| 4 | 20 | 18 | 2 |
Data Acquisition and Processing
Shear wave data acquisition and processing was performed as previously reported in earlier technical publications using a customized Siemens SONOLINE Antares™ scanner and a CH41 transducer (Siemens Healthcare, Ultrasound Business Unit, Mountain View, CA) [15,19]. Five different people performed the imaging during this study, each of whom had training scanning volunteers before scanning study subjects to reduce operator variability; inter-operator variability was not analyzed in this study. All patients (n = 172) undergoing a percutaneous liver biopsy for the diagnosis and staging of presumed NALFD were imaged within minutes prior to liver biopsy. Shear stiffnesses were characterized in 3 different locations of the liver: (1) superior intercostal (i.e., 9–10th rib intercostals space coinciding most often with the location of the liver biopsy needle insertion), (2) inferior intercostal (i.e. 10–11th rib intercostals space, typically 1–2 ribs spaces inferior to the superior location), and (3) lateral subcostal. Three replicate shear stiffness data acquisitions were performed at each imaging location for a total of 9 data acquisitions per patient.
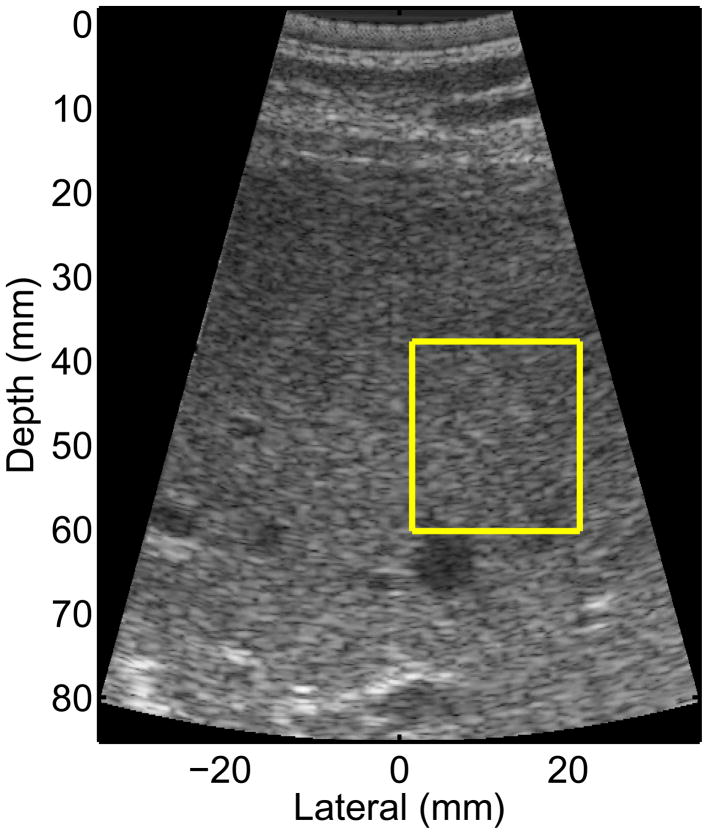
Study subjects were asked to suspend breathing for each of the 9 data acquisitions, which lasted ~5 seconds. After the study subject paused their breathing, an imaging location was found that had homogeneous liver parenchyma on standard B-mode imaging, devoid of any vessels or other substructures of the liver; an example of such a region of interest (ROI) is shown in Figure 1. Data were acquired once a suitable location was found during imaging. The patient was then instructed to resume breathing after the shear wave data were saved.
Figure 1.
B-mode image from one of the NAFLD study subjects. The yellow box represents the ROI for reconstructing the shear stiffness, which is chosen to be free of vessels and other liver substructures. The radiation force excitation was applied at a lateral position of 0, and propagation was monitored to the right (positive lateral locations).
The RANSAC algorithm described by Wang et al. was used for all of the shear wave speed estimates presented herein [19]. Quantitative criteria were used to eliminate spurious estimates corrupted by excessive motion artifact, poor signal-to-noise ratio (SNR), and inadequate imaging windows [19]. Patients who had an IQR / mean > 0.3 after outlier rejection were considered too variable and not successfully reconstructed. Shear wave speed estimates (cT) were converted to shear stiffnesses (μ) using the expression:
| (1) |
where ρ represents the constant density (1.0 g/cm3) in the assumed linear, isotropic elastic liver tissue [15]. Some literature using the commercial implementation of this technique (VirtualTouch™ Tissue Quantification on the Siemens ACUSON S2000) may report shear wave speeds (cT) instead of shear moduli; the quoted shear moduli (μ) in this paper (in kPa) can be converted to shear wave speeds (cT, in m/s) using the relationship cT = sqrt(μ) (Equation 1). Literature involving the FibroScan® quote liver stiffnesses as Young’s moduli (E) instead of shear moduli; under the assumption of tissue incompressibility that is made in this setting, shear and Young’s moduli can be converted using the expression E = 3μ.
Liver Histology
The primary outcome in this study was liver histology in patients with NAFLD. All liver biopsy specimens were stained with hematoxylin-and-eosin and Masson’s trichrome stains. Liver histology was reviewed and scored by a liver histopathologist (CG) according to the published NASH Clinical Research Network scoring system [22]. The following histologic features of NAFLD were evaluated in this study: the grades of lobular inflammation, and ballooning, and the stage of fibrosis. Briefly, lobular inflammation was graded into 0 to 3 based on the numbers of inflammatory foci per 20x field: 0 (grade 0), < 2 (grade 1), 2–4 (grade 2), and > 4 (grade 3). Ballooning was graded into 0 to 2: none (grade 0), few (grade 1), or many (grade 2). Fibrosis was classified into 5 stages: none, normal connective tissue (stage 0); zone 3 perisinusoidal or periportal fibrosis (stage 1; 1a = mild, zone 3, perisinusoidal, 1b = moderate, zone 3, perisinusoidal, 1c = portal/periportal); moderate, zone 3; perisinusoidal and portal/periportal fibrosis (stage 2); bridging fibrosis (stage 3); and cirrhosis (stage 4). For the purpose of these analyses, fibrosis stages 1a, 1b, and 1c were combined and treated as stage 1.
AST to Platelet Ratio Index (APRI)
The aspartate aminotransferase to platelet ratio index (APRI) has been recognized as a noninvasive test to characterize the degree of liver fibrosis in the setting of NAFLD [20]. APRI was calculated for all study subjects as a follows [21]:
| (2) |
where ULN represent the AST upper level of normal (56 IU/L) and the platelet count has units of 109/L.
Statistical Analysis
The shear stiffness data from the 3 imaging locations were analyzed to (1) evaluate the stiffness variability between replicate measures in the same patient and the same location, (2) evaluate the stiffness variability between different locations in the same patient, and (3) evaluate the stiffness variability averaged over replicate measures and locations as a function of fibrosis stage. A log transformation was applied to reduce the heterogeneity in the variances across fibrosis stage; the SAS (SAS Institute, Inc., Cary, NC) PROC MIXED and PROC VARCOMP procedures were used for statistical testing. Significance was determined at an overall Bonferroni 0.10 level.
RESULTS
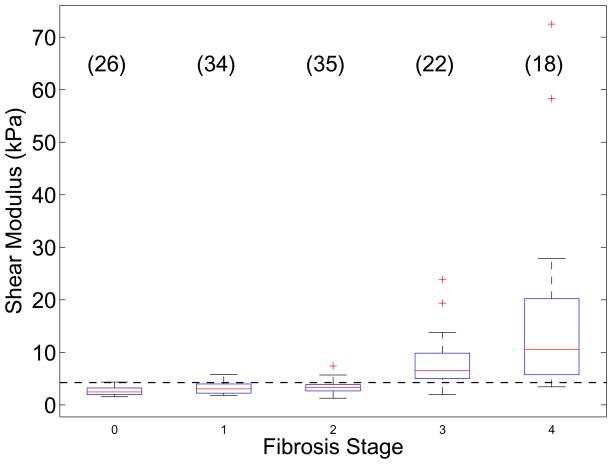
One hundred thirty five of the 172 total subjects had successful shear stiffness reconstruction using the RANSAC algorithm. Table 1 outlines the distribution of study subjects as a function of gender, BMI, and fibrosis stage. Liver stiffness did not vary significantly as a function of imaging location (p = 0.11); therefore the stiffness values from all imaging locations were pooled together for each study subject. The IQR / mean shear stiffness over all successfully reconstructed patients was 0.19 ± 0.13, allowing us to use the mean stiffness as a representative quantity for each patient. Figure 2 shows the mean reconstructed shear moduli from these 135 successfully-reconstructed study subjects as a function of their biopsy-determined fibrosis stage. Fibrosis stages 0–2 are significantly different from fibrosis stages 3–4 (p < 0.0001); based on these data, we can calculate a simple threshold of liver shear stiffness to distinguish these two groups of fibrosis as the mean log stiffness between the F2–3 populations. Using this calculated shear stiffness threshold of >= 4.24 kPa (as indicated in the horizontal dashed line in Figure 2), ARFI shear wave imaging yields a sensitivity of 90% and a specificity of 90% with an AUC value of 0.90.
Figure 2.
Reconstructed shear moduli in 135 patients being evaluated for NAFLD as a function of their biopsy-proven fibrosis stage. The boxes represent the interquartile range (IQR), while the whiskers represent 1.5 times the respective IQR level over the mean stiffnesses for each study subject (the mean of 3 replicate measures in the 3 imaging locations with an IQR/mean < 0.3). The number of study subjects for each fibrosis stage is indicated in parentheses. The horizontal dashed line represents the threshold (4.24 kPa) to distinguish fibrosis stages F0–2 from F3–4.
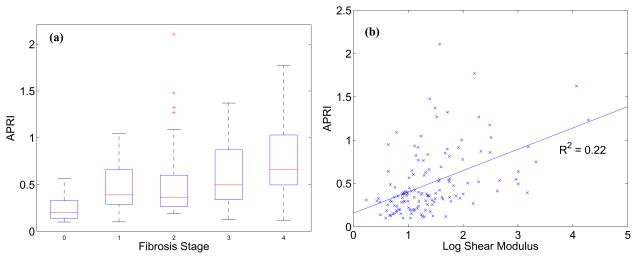
The APRI is a convenient, noninvasive, blood-marker-based metric to evaluate the presence of advanced fibrosis in NAFLD patients. As expected, Figure 3(a) shows the increase in APRI as a function of fibrosis stage. There is moderate correlation between APRI and mean liver shear stiffness, as shown in Figure 3(b) (R2 = 0.22, p < 0.001).
Figure 3.
(a) APRI as a function of fibrosis score; (b) APRI as a function of reconstructed log shear stiffness (R2 = 0.22, p < 0.001).
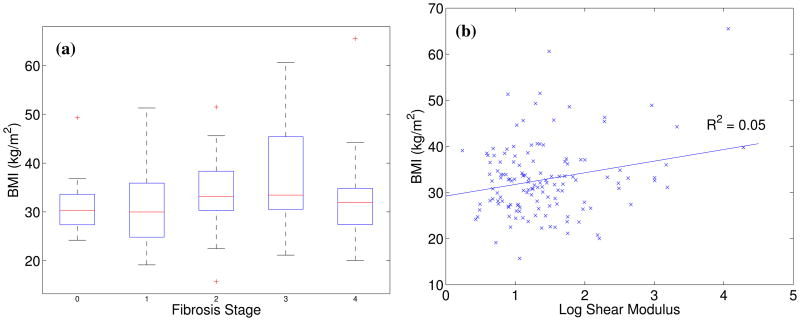
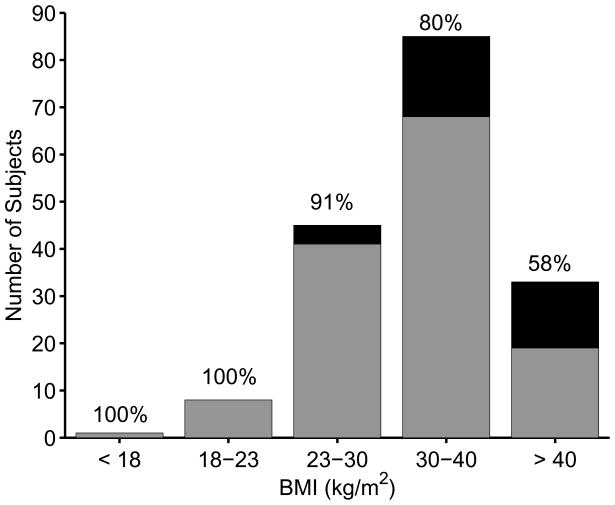
Figure 4 shows the mean reconstructed shear moduli in the study subjects as a function of their BMI. There is no significant correlation between patient BMI and fibrosis stage (Figure 4(a)) or liver stiffness (Figure 4(b), R2 = 0.05, p < 0.01). The overall BMI distribution of patients in this study is shown in Figure 5, with the portion of subjects with successful shear stiffness reconstructions indicated in gray (represented with percentages in text above each bar). The percentage of patients with successful shear stiffness reconstructions does decrease with increasing BMI, with 100% yield for BMI < 23 kg/m2 and 58% yield for BMI > 40 kg/m2, including successful stiffness reconstruction in a patient with a BMI = 66 kg/m2 (Figures 4(a) and 5). One of these patients presented with ascites that were visualized during the ultrasound exam; shear stiffness reconstructions (μ = 12.0 ± 2.2 kPa) successfully predicted this patient as being cirrhotic (F4).
Figure 4.
(a) BMI as a function of fibrosis score; (b) mean reconstructed log shear stiffness for each study subject as a function of study subject BMI. No correlation between mean liver stiffness and BMI was noted (R2 = 0.05, p < 0.01).
Figure 5.
Distribution of study subject BMIs; successful shear stiffness reconstructions are indicated in gray, while unsuccessful shear stiffness reconstructions are indicated in black. The percentages above each bar represent the percentage of successful reconstructions.
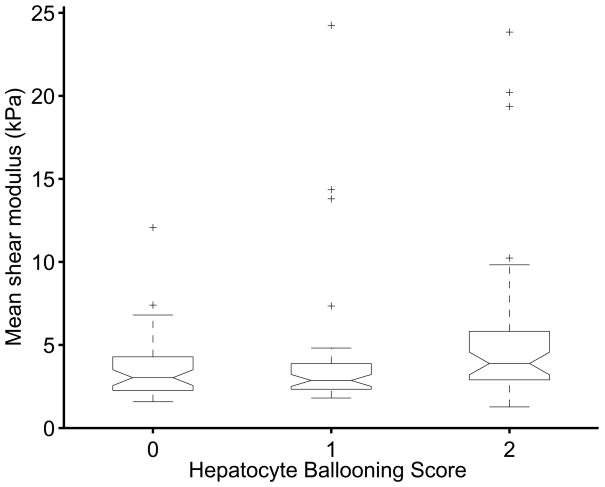
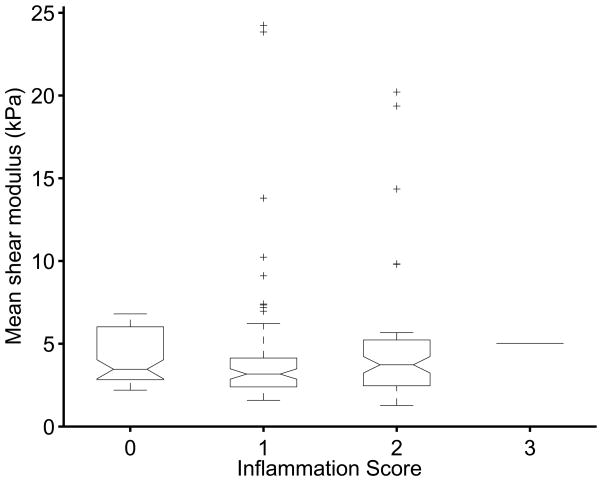
The effects of hepatocyte ballooning (Figure 6) and inflammation (Figure 7) were also tested for their effect on the shear stiffness measurements. Neither variable was found to be significant at the 0.1 level, with p = 0.11 for the ballooning and p = 0.69 for the inflammation.
Figure 6.
Box plots of mean reconstructed shear stiffness for different biopsy-proven hepatocyte ballooning scores; no significant trends in shear stiffness exist as a function of hepatocyte ballooning (p = 0.11).
Figure 7.
Box plots of mean reconstructed shear stiffness for different biopsy-proven inflammation scores; no significant trends in shear stiffness exist as a function of inflammation (p = 0.69).
DISCUSSION
ARFI shear wave imaging was able to successfully reconstruct liver stiffnesses in patients with fibrosis stages ranging from F0–4, with the most significant distinction occurring between patients grouped with little-to-moderate fibrosis (F0–2) versus those with advanced fibrosis / cirrhosis (F3–4). These results are consistent with those presented by Wong et al. [12] with the FibroScan®, though Yonega et al. did show more separation between the little-to-moderate fibrosis stages [11]. Both Yoneda et al. and Wong et al. showed increasing variability in the liver stiffness with increasing fibrosis, which is consistent with our results (Figure 2). Wong et al. went on to establish stiffness thresholds to distinguish F3–4 fibrosis from less severe fibrosis, with a shear stiffness of 2.9 kPa providing sensitivity and specificity values of ~83% [12]. Applying a shear stiffness threshold of 4.2 kPa to our data yielded a sensitivity and specificity of ~90%. While both studies demonstrate similar trends, the difference in absolute threshold value is likely due to differences in the characteristics of the mechanical excitation [32]. Future, larger scale studies need to be performed to validate the predictive value of these stiffness metrics and to study the dispersive mechanical properties of the liver.
The primary role of liver biopsy in the evaluation of NAFLD is the exclusion of advanced fibrosis and/or cirrhosis as the presence of such would alter clinical management and follow-up. The ability to use ARFI imaging as a non-invasive screening test to discern those patients with advanced liver disease could spare patients the potential complications of a liver biopsy, reduce associated health care costs and resource utilization, and allow adequate screening of advanced liver disease to be applied to a larger population of at risk patients.
Acoustic radiation force-based shear stiffness reconstruction techniques have started to appear on commercial scanners that are being used in clinical studies of liver fibrosis due to a variety of etiologies [17,25,30,31]. Lupsor et al. [26] and Friedrich-Rust et al. [27] utilized the Virtual Touch™ Tissue Quantification mode on the Siemens ACUSON S2000 scanner (a commercial implementation of the acoustic radiation force technologies presented in this manuscript) to study the correlation between shear stiffness values (measured directly as shear wave speeds) with liver fibrosis in viral hepatitis patients; they found very similar trends compared to those found in the NAFLD patient population in this study. Yoneda et al. also recently compared transient elastography (i.e., the FibroScan® system) with Virtual Touch™ Tissue Quantification in NAFLD patients and found a good correlation between the two systems (R2 = 0.56, p < 0.0001) [13]. However, it should be noted that this Japanese study population tended to be leaner (BMI 27 ± 4.7 kg/m2) with few patients with advanced fibrosis or cirrhosis (F3, n=4; F4, n=6). This is in contrast to our study with over 60% of NAFLD patients having BMI > 30 kg/m2 and a large cohort of patients with biopsy-proven advanced fibrosis / cirrhosis (F3–4, n=40), confirming that shear stiffness reconstruction is possible in the majority of obese and even severely obese patients with NAFLD, as is typically observed in Western countries. Overall, the results from these ultrasound-based elasticity measurement systems are in good agreement with those found in the Magnetic Resonance Elastography (MRE) literature [28–29]. Multi-center, prospective studies need to be performed to rigorously evaluate the clinical utility of ARFI shear wave imaging, in comparison with tools such as the FibroScan®, as a function of controlled patient population variables, including gender, age, BMI, and liver disease etiology.
The shear stiffness reconstructions did not significantly differ based on the imaging location, which allowed all of the analysis presented herein to be performed using mean shear stiffness values for each study subject. Liver shear stiffness was also not significantly affected by the degree of hepatocyte ballooning (Figure 6), nor the amount of hepatic inflammation (Figure 7). One other factor that has been reported to have an effect on liver stiffness is hepatic congestion, which can increase liver stiffness [23–24]. However, no patients with known right-sided heart failure were included in this study, and no signs of sinusoidal dilation were noted on liver biopsy, thus reducing the likelihood that this factor would confound our interpretation of the study results. The APRI trends with liver fibrosis shown in Figure 3(a) are consistent with those reported by Loaeza-del-Castillo et al. [20], and shear stiffness demonstrated a mild correlation with APRI (Figure 3(b)).
There was no correlation between BMI and liver stiffness, and stiffness values were successfully reconstructed in subjects with BMIs up to 66 kg/m2 (the highest BMI in this study). However, 37 patients did not yield successful liver shear stiffness estimates; of these patients, many of them had high BMIs (> 40 kg/m2) (Figure 5). One likely explanation for this trend is the increasing amount of adipose tissue between the skin and the liver capsule that can occur in subjects with higher BMIs. The magnitude of the applied radiation force in ARFI imaging decreases when more acoustic energy is absorbed by the intervening tissue along the acoustic propagation path. Subcutaneous adipose tissue can have considerably higher ultrasonic loss (attenuation) than liver tissue. Therefore, patients with high BMI, who often have several centimeters of subcutaneous adipose tissue, may be more likely to experience smaller applied radiation forces, which can lead to poor data SNR and a failure to yield a stiffness estimate [15,19]. This additional adipose tissue may also introduce phase aberration and clutter into the ultrasound beams that are used to track the resultant displacements, compromising our ability to perform an accurate shear wave velocity reconstruction [15]. These sources of error and limitations will be addressed in future technical studies. Although the trend of decreasing successful stiffness reconstruction yield with increasing BMI was observed (Figure 5), successful shear stiffness reconstructions were still achieved in patients with BMIs ranging from 15.7 – 66.0 kg/m2.
There are several considerations to optimize the likelihood of successful shear stiffness reconstruction in patients. Good coupling between the ultrasound transducer and the skin must be maintained to achieve adequate displacement magnitudes; poor coupling leads to a loss of acoustic energy at the skin interface, which exacerbates the challenge of generating adequate displacements in patients with high BMIs. The imager must also make sure that high-quality B-mode images are being made prior to data acquisition. Typically, the location where the needle biopsy was performed (intercostal) provided the best qualitative imaging ROI since it had the least subcutaneous adipose tissue in the acoustic propagation path compared with the other imaging locations. B-mode images should target a uniform region of liver parenchyma, as shown in Figure 1, and be devoid of rib shadowing and liver substructures that can lead to data artifacts associated with poor SNR and shear wave interactions with these entities. Motion artifacts can present challenges in some study subjects. The most common sources of motion in these studies were cardiac motion (which can be excessive in subcostal imaging locations that approach the sternal notch) and poor patient compliance with suspending their breathing during data acquisition. Additionally, the operator must take care to maintain a steady hand while acquiring data.
One interesting patient in this study was a 48 year old female who presented with ascites (F4, APRI = 1.2, BMI = 32, ). The presence of abdominal fluid, although it can compromise the ability of a system like the FibroScan® to characterize liver stiffness, did not impair the ability for ARFI shear wave imaging to reconstruct a shear stiffness. With FibroScan®, the fluid prevents coupling of the shear wave “punch” from the skin surface into the target organ; however, the acoustic energy used to generate the radiation force in this study is able to easily couple through that fluid, and in fact, is enhanced since that fluid does not attenuate the energy as much as soft tissues. Therefore, ARFI shear wave imaging may be able to discern the presence or absence of cirrhosis in patients with ascites and allow clinicians to assess whether the presence of ascites may be attributed to cirrhosis. Our successful shear stiffness reconstructions in this patient (μ = 12.0 ± 2.2 kPa) would have predicted her advanced fibrosis / cirrhosis.
This study demonstrates that shear stiffness reconstructions based on acoustic radiation force excitations can be used to non-invasively evaluate liver fibrosis in patients being evaluated for NAFLD, including those with high BMI and ascites. These shear stiffnesses can be directly related to the liver fibrosis stage without being confounded by the imaging location, hepatocyte ballooning or hepatic inflammation.
Acknowledgments
Funding: This work is supported by NIH grant R01 EB002132. Dr. Abdelmalek is supported by NIH/NIDDK Mentored Career Development Award K23-DK062116.
The authors would like to thank Siemens Medical Solutions, USA for their technical support, and Veronica Rotemberg, Miriam Chitty, Samantha Kwan, Melissa Smith, Pamela Anderson and Nicole Rothfusz for their assistance in the hepatology clinic and with data collection.
Abbreviations
- NAFLD
Nonalcoholic Fatty Liver Disease
- NAFL
Nonalcoholic Fatty Liver
- NASH
Nonalcoholic Steatohepatitis
- BMI
Body Mass Index
- ARFI
Acoustic Radiation Force Impulse
- ROI
Region of Interest
- IQR
Interquartile Range
- AUC
Area Under Curve (ROC Analysis)
- SNR
Signal-to-Noise Ratio
Footnotes
Financial Disclosures: The authors do not have any conflicts of interest to report.
Publisher's Disclaimer: This is a PDF file of an unedited manuscript that has been accepted for publication. As a service to our customers we are providing this early version of the manuscript. The manuscript will undergo copyediting, typesetting, and review of the resulting proof before it is published in its final citable form. Please note that during the production process errors may be discovered which could affect the content, and all legal disclaimers that apply to the journal pertain.
References
- 1.Angulo P. Nonalcoholic fatty liver disease. N Engl J Med. 2002;346:1221–1231. doi: 10.1056/NEJMra011775. [DOI] [PubMed] [Google Scholar]
- 2.Wieckowska A, Feldstein AE. Nonalcoholic fatty liver disease in the pediatric population: a review. Curr Opin Pediatr. 2005;17:636–641. doi: 10.1097/01.mop.0000172816.79637.c5. [DOI] [PubMed] [Google Scholar]
- 3.Szczepaniak LS, Nurenberg P, Leonard D, Browning JD, Reingold JS, Grundy S, et al. Magentic resonance spectroscopy to measure hepatic triglyceride content: prevalence of hepatic steatosis in the general population. Am J Physiol Endocinol Metab. 2004;288:E462–8. doi: 10.1152/ajpendo.00064.2004. [DOI] [PubMed] [Google Scholar]
- 4.Brunt EM, Janney CG, Di Biceglie AM, Neuschwander-Tetri BA, Bacon BR. Nonalcoholic steatohepatitis: a proposal for grading and staging the histological lesions. Am J Gastroenterology. 1999;94:2467–2474. doi: 10.1111/j.1572-0241.1999.01377.x. [DOI] [PubMed] [Google Scholar]
- 5.Matteoni CA, Younossi ZM, Gramlich T, Liu Y, Rybicki L, McCullough AJ. Nonalcoholic fatty liver disease: Risk factors and long-term outcomes for benign versus aggressive disease. Gastroenterology. 1998;114:1413–1419. [Google Scholar]
- 6.Wieckowska A, Feldstain AE. Diagnosis of nonalcoholic fatty liver disease: invasive versus noninvesive. Semin Liver Dis. 2008;28:386–395. doi: 10.1055/s-0028-1091983. [DOI] [PubMed] [Google Scholar]
- 7.Wieckowska A, McCullough AJ, Feldstein AE. Noninvasive diagnosis and monitoring of nonalcoholic steatohepatitis: present and future. Hepatology. 2007;46:582–589. doi: 10.1002/hep.21768. [DOI] [PubMed] [Google Scholar]
- 8.Ratziu V, Charlotte F, Heurtier A, Gombert S, Giral P, Bruckert E, et al. Sampling variability of liver biopsy in nonalcoholic fatty liver disease. Gastroenterology. 2005;128:1898–1906. doi: 10.1053/j.gastro.2005.03.084. [DOI] [PubMed] [Google Scholar]
- 9.Takemoto R, Nakamuta M, Aoyagi Y, Tatsuya F, Yasutake K, Koga K, et al. Validity of FibroScan values for predicting hepatic fibrosis stage in patients with chronic HCV infection. Journal Diangosis Disease. 2009;10:145–148. doi: 10.1111/j.1751-2980.2009.00377.x. [DOI] [PubMed] [Google Scholar]
- 10.Foucher J, Castera L, Berhard PH. Prevalence and factors associated with failure of liver stiffness measurement using FibroScan in a prospective study of 2114 examinations. European Journal of Gastroenterology and Hepatology. 2006;18:411–412. doi: 10.1097/00042737-200604000-00015. [DOI] [PubMed] [Google Scholar]
- 11.Yoneda M, Yoneda M, Mawatari H, Fujita K, Endo H, Iida H, et al. Noninvasive assessment of liver fibrosis by measurement of stifness in patients with nonalcoholic fatty liver disease (NAFLD) Digestive and Liver Disease. 2008;40:371–378. doi: 10.1016/j.dld.2007.10.019. [DOI] [PubMed] [Google Scholar]
- 12.Wong V, Vergnoil J, Wong G, Foucher J, Chan H, Le Bail B, et al. Diagnosis of Fibrosis and Cirrhosis Using Liver Stiffness Measurement in Nonalcoholic Fatty Liver Disease. Hepatology. 2010;51:454–462. doi: 10.1002/hep.23312. [DOI] [PubMed] [Google Scholar]
- 13.Yoneda M, Suzuki K, Kato S, Fujita K, Nozaki Y, Hosono K, Saito S, Nakajima A. Nonalcoholic Fatty Liver Disease: US-based Acoustic Radiation Force Impulse Elastography. Radiology. 2010;256:640–647. doi: 10.1148/radiol.10091662. [DOI] [PubMed] [Google Scholar]
- 14.Sarvazyan A, Rudenko OV, Swanson SD, Fowlkes JB, Emelianov SY, et al. Shear wave elasticity imaging: A new ultrasonic technology of medical diagnostics. Ultrasound in Medicine and Biology. 1998;24:1419–1435. doi: 10.1016/s0301-5629(98)00110-0. [DOI] [PubMed] [Google Scholar]
- 15.Palmeri ML, Wang MH, Dahl JJ, Frinkley KD, Nightingale KR. Quantifying hepatic shear modulus in vivo using acoustic radiation force. Ultrasound in Medicine and Biology. 2008;34:546–558. doi: 10.1016/j.ultrasmedbio.2007.10.009. [DOI] [PMC free article] [PubMed] [Google Scholar]
- 16.Palmeri ML, McAleavey SA, Fong KL, Trahey GE, Nightingale KR. Dynamic mechanical response of elastic spherical inclusions to excitation by impulsive acoustic radiation force. IEEE Trans Ultrason Ferroelectr Freq Control. 2006;53:2065–2079. doi: 10.1109/tuffc.2006.146. [DOI] [PMC free article] [PubMed] [Google Scholar]
- 17.Bercoff J, Tanter M, Fink M. Supersonic shear imaging: a new technique for soft tissue elasticity mapping. IEEE Trans Ultrason Ferroelectr Freq Control. 2004;51:396–409. doi: 10.1109/tuffc.2004.1295425. [DOI] [PubMed] [Google Scholar]
- 18.Sandrin L, Tanter M, Gennisson J, Catheline S, Fink M. Shear elasticity probe for soft tissues with 1-D transient elastography. IEEE Trans Ultrason Ferroelectr Freq Control. 2002;49:436–446. doi: 10.1109/58.996561. [DOI] [PubMed] [Google Scholar]
- 19.Wang M, Palmeri ML, Rotemberg VM, Rouze NC, Nightingale KR. Improving the robustness of time-of-flight based shear wave speed reconstruction methods using RANSAC in human liver in vivo. Ultrasound in Medicine and Biology. 2010;36:802–813. doi: 10.1016/j.ultrasmedbio.2010.02.007. [DOI] [PMC free article] [PubMed] [Google Scholar]
- 20.Loaeza-del-Castillo A, Paz-Pineda F, Oviedo-Cardenas E, Sanchez-Avilia F, Vargas-Vorackova F. AST to platelet ratio index (APRI) for the noninvasive evaluation of liver fibrosis. Annals of Hepatology. 2008;7:350–357. [PubMed] [Google Scholar]
- 21.Wai C, Greenson J, Fontana R, Kalbfleisch J, Marrero J, Conjeevaram H, Lok A. A simple noninvasive index can predict both significant fibrosis and cirrhosis in patients with chronic hepatitis C. Hepatology. 2003;38:518–526. doi: 10.1053/jhep.2003.50346. [DOI] [PubMed] [Google Scholar]
- 22.Kleiner DE, Brunt EM, Van Natta M, Behling C, Contos MJ, Cummings OW, et al. Design and validation of a histological schoring system for nonalcoholic fatty liver disease. Hepatology. 2005;41:1313–1321. doi: 10.1002/hep.20701. [DOI] [PubMed] [Google Scholar]
- 23.Millonig G, Friedrich S, Adolfl S, Fonouni H, Golriz M, Mehrabi A, et al. Liver stiffness is directly influenced by central venous pressure. Journal of Hepatology. 2010;52:206–210. doi: 10.1016/j.jhep.2009.11.018. [DOI] [PubMed] [Google Scholar]
- 24.Frulio N, Laumonier H, Balabaud C, Trillaud H, Bioulac-Sage P. Hepatic congestion plays a role in liver stiffness. Hepatology. 2009;50:1674–1675. doi: 10.1002/hep.23109. [DOI] [PubMed] [Google Scholar]
- 25.Rifai K, Bahr M, Maderacke I. Acoustic radiation force imaging (ARFI) as a new method of ultrasonographic elastrography allows accurate and flexible assessment of of liver stiffness. J Hepatol. 2009;50S1:S88. [Google Scholar]
- 26.Lupsor M, Badea R, Stefanescu H, Sparchez Z, Branda H, Serban A, et al. Performance of a new elastographic methods (ARFI technology) compared to unidimensional transient elastography in the noninvasive assement of chronic hepatitis C. Preliminary results. J Gastrointestin Liv Dis. 2009;18:303–310. [PubMed] [Google Scholar]
- 27.Friedrich-Rust M, Wunder K, Kriener S, Sotoudeh F, Richter S, Bojunga J, et al. Liver fibrosis in viral hepatitis: Noninvasive assessment with acoustic radiation force impulse imaging versus transient elastography. Radiology. 2009;252:595–604. doi: 10.1148/radiol.2523081928. [DOI] [PubMed] [Google Scholar]
- 28.Huwart L, Peeters F, Sinkus R, Annet L, Salameh N, ter Beek LC, et al. Liver Fibrosis: non-invasive assessment with MR elastography. NMR Biomed. 2006;19:173–179. doi: 10.1002/nbm.1030. [DOI] [PubMed] [Google Scholar]
- 29.Rouviere O, Yin M, Dresner A, Rossman PJ, Burgart LJ, Fidler JL, et al. MR elastography of the liver: preliminary results. Radiology. 2006;240:440–448. doi: 10.1148/radiol.2402050606. [DOI] [PubMed] [Google Scholar]
- 30.Bercoff J. ShearWave Elastography (White Paper) SuperSonic Imagine. 2008 [Google Scholar]
- 31.Muller M, Gennisson JL, Deffieux T, Tanter M, Fink M. Quantitative viscoelasticity mapping of human liver using supershonic shear imaging: preliminary in vivo feasibility study. Ultrasound in Medicine and Biology. 2009;35:219–229. doi: 10.1016/j.ultrasmedbio.2008.08.018. [DOI] [PubMed] [Google Scholar]
- 32.Sandrin L, Miette V. Vibration-Controlled Transient Elastography VCTE™ (White Paper) EchoSens™. 2010 [Google Scholar]


