

Abstract
To investigate the local mechanical forces associated with intravascular pillars and vessel pruning, we studied the conducting vessels in the extraembryonic circulation of the chick embryo. During the development days 12–16, intravascular pillars and blood flow parameters were identified using fluorescent vascular tracers and digital time-series video reconstructions. The geometry of selected vessels was confirmed by corrosion casting and scanning electron microscopy. Computational simulations of pruning vessels suggested that serial pillars form along pre-existing velocity streamlines; blood pressure demonstrated no obvious spatial relationship with the intravascular pillars. Modeling a Reynolds number of 0.03 produced 4 pillars at approximately 20um intervals matching the observed periodicity. In contrast, a Reynolds number of 0.06 produced only 2 pillars at approximately 63um intervals. Our modeling data indicated that the combination of wall shear stress and gradient of shear predicted the location, direction and periodicity of developing pillars.
Introduction
The effect of blood flow on the structure of the network remains a fundamental biologic question in microvascular development (Jones et al., 2006). In early embryogenesis, vessels within the embryo proper develop before the heartbeat. A definable aorta, segments of the vitelline veins and parts of the cardinal veins develop before the onset of an active circulation (Thoma, 1893b; Sabin, 1917). The extraembryonic area, present as an “indifferent” network of capillaries (Chapman, 1918), undergoes limited development in the absence of blood flow (Manner et al., 1995; Wakimoto et al., 2000). In later embryogenesis, the onset of a heartbeat and active blood flow is associated with dramatic changes in both embryonic and extraembryonic vessels (Romanoff, 1960).
Attempts to define the influence of blood flow on CAM vessel structure have largely focused on the capillary plexus. As the primary exchange bed, the capillary plexus serves as an ex ovo lung, (Hamburger and Hamilton, 1951; Rahn et al., 1974; Rizzo et al., 1995) suggesting that the capillary network structure is influenced by gas exchange function in addition to blood flow (Tanaka et al., 1986; Defouw, 1988). In contrast, branching vessels leading to and from the capillary network serve a more limited function as conducting vessels (Weibel, 1969). Identified by the centripetal naming convention in which 1st, 2nd and 3rd order vessels are progressively distant from the capillary network (Fenton and Zweifach, 1981; Dimitropoulou et al., 1998), these branching pre- and post-capillary vessels adapt to the increasing blood flow during tissue growth. Ausprunk et al. has demonstrated a decrease in the average length of the pre- and post-capillary branching vessels for more than 4 days after the cessation of capillary angiogenesis (Ausprunk et al., 1974). Defouw et al. suggested that the shortening of the 1st to 3rd order vessels was the result of active structural remodeling (Defouw et al., 1989). These adaptive changes in extra-embryonic vessels are coincident with the ongoing increase in blood flow associated with tissue growth and differentiation.
A distinctive mechanism of structural remodeling in CAM and yolk sac vessels is intussusceptive branching morphogenesis; a process characterized by an intravascular tissue island or “pillar”(Djonov et al., 2000). A structure initially described in the rat lung (Caduff et al., 1986; Burri and Tarek, 1990), expansion or growth of the intravascular pillar can produce a variety of morphogenetic effects. Growth of the pillar along the axis of the vessel results in vascular duplication (Konerding et al., 2010); growth of the pillar toward the vertex of a vessel bifurcation results in angle remodeling (Djonov et al., 2003). A particularly dramatic morphogenetic effect is produced when growth or expansion of the pillar results in pruning or regression of a branching vessel. Although pillar-dependent vascular pruning has been observed in a variety of developmental stages (Djonov et al., 2003), the mechanism of pruning remains unclear.
To define the influence of intravascular flow fields on 2nd and 3rd order extra-embryonic microvessels, we studied microvascular regression, or pruning, associated with intravascular pillars. Using intravital microscopy imaging data, 3-D computational simulations of the regressing vessel and contiguous vessel segments were performed. Our modeling suggests that intravascular pillars, constrained by regions of high shear stress, produce progressive flow obstruction in the regressing segment. Further, the direction of pillar development and its periodicity may reflect both the magnitude and gradient of wall shear stress.
Methods
Eggs
Specific pathogen-free fertilized White Leghorn chicken eggs (G. gallus domesticus) were obtained from Charles River Laboratories (Wilmington, MA). The care of the animals was consistent with guidelines of the American Association for Acreditation of Laboratory Animal Care (Bethesda, MD).
Ex ovo culture
For all experiments, a modified, ex ovo (shell-less) culture method was used (Tufan and Satiroglu-Tufan, 2005). Briefly, the eggs were kept in an RCOM 20 digital incubator (GimHae, Korea) at 37.5°C and 70% humidity with automatic turning for 3 days. On embryonic development day (EDD) 3, the eggs were sprayed with 70% ethanol, air-dried in a laminar flow hood and explanted into a 20×100mm Petri dish (Falcon, BD Biosciences, San Jose, CA). The ex vivo cultures were maintained in a humidified 2% CO2 incubator at 37.5°C.
Intravital microscopy system
The extraembryonic vessels were imaged using a Nikon Eclipse TE2000 inverted epifluorescence microscope using Nikon Plan Apo 10x and Plan Fluor 20x objectives. The microscope was custom-fitted with an insulated 37°C convective warming unit with moderate relative humidity (Jones et al., 2002). An X-Cite (EXFO, Vanier, Canada) 120 watt metal halide light source and a liquid light guide were used to illuminate the CAM. Excitation and emission filters (Chroma, Rockingham, VT) in separate LEP motorized filter wheels were controlled by a MAC5000 controller (Ludl, Hawthorne, NY) and MetaMorph 7.6 software (Molecular Devices, Downingtown, PA). The 14-bit fluorescent images were digitally recorded with an electron multiplier CCD (EMCCD) camera (C9100-02, Hamamatsu, Japan). Images were routinely obtained at frame rates exceeding 50 fps with 2×2 binning. The images were recorded in image stacks comprising 100 to 500 frames of video sequences on a Dell Precision workstation (3.06 GHz dual Xeon processors, 15,000rpm ultra-SCSI hard drives, 4gb RAM and an Nvidia Quadro 3450 graphics card with 512mb memory). The CAMs at EDD13 thru 17were imaged with intermittent time-lapse videos over 6 to 24 hour time period.
Fluorescent tracers
The fluorescent plasma marker used for intravital imaging was a 5% fluorescein isothiocyanate (FITC)-dextran (MW 2,000kDa; Sigma-Aldrich, St. Louis, MO) solution prepared in normal saline immediately prior to injection. In some intravital microscopy experiments, neutrally-charged, polystyrene spheres were injected with the plasma marker (Ravnic et al., 2007). The 0.5um microspheres were labeled with derivatives of the BODIPY fluorochrome (ex 488nm, em 510nm) using organic solvents (Invitrogen, Eugene, OR). The plasma marker and intravascular tracer solution was injected into the CAM circulation using a micro-fine 0.3ml insulin syringe with a 30G needle (BD, Franklin Lakes, NJ).
Time-series flow visualization
The stream-acquired images were stacked to create a time series of 100 or 500 consecutive frames. The stacks were systematically analyzed to ensure the absence of motion artifact. The stack “maximum” operation selected the highest intensity value for each pixel location throughout the time series. Conversely, the stack “minimum” operation selected the lowest intensity value for each pixel location. Other filters such as the “median” operation were similarly applied. The resultant image produced a time series reconstruction of the vessel during the time interval of the image stack. Processed image snacks were used to identify intravascular pillars (Lee et al., 2010) as well as to facilitate morphometric measurements such as area, length, orientation, perimeter, shape factor, hole area and prolate volume (MetaMorph 7.6; Molecular Devices).
Exclusion zone
The plasma marker exclusion zone was determined by digitally recombining a source vessel video image stack. Using a maximum and minimum algorithm, the maximum or minimum intensity value at each pixel location in the source field was identified. The minimum stack image was digitally subtracted from the maximum stack image with the resulting vessel image reflecting intravascular fluorescence excluded from the flow of stream. The residual vessel wall fluorescence was defined as the excluded zone. The excluded zone was thresholded and measured both as a continuous variable average over the length of the inter-branch segment as well as a discrete variable measured at intervals corresponding to the vessel diameter. Agreement between the measures was typically within 10%.
Mural irregularity
The irregularity of the vessel wall was measured by digital combination of the source video sequence using the MetaMorph 7.6 best focus filter. The resultant image was processed using the sharpen algorithm and thresholded. The longitudinal perimeter of each vessel segment was measured, divided by 2 and expressed as a ratio relative to the axial length of the vessel segment.
Time-series analysis
Flow patterns were demonstrated using time-series plots created by measuring the intensity values of a region of interest through a time-based series of images. The time-series plots were constructed using the MetaMorph kymograph application (Turhan et al., 2007). The application was used to create a cross-sectional view of grayscale intensity values along a region or “transept” drawn on the image stack (Ravnic et al., 2006). The average pixel intensity across the vessel width was used to track movement in the time-series. The image stack was preprocessed with minimal background subtraction to improve both the signal-to-noise ratio and the sensitivity of motion detection. By convention, the transept distance was plotted on the X-axis and the descending time-series was plotted on the Y-axis.
Corrosion casting and scanning electron microscopy
The CAM vessels were cannulated and perfused with 1–2ml of 37°C saline followed by 1–2ml of buffered 2.5% glutaraldehyde solution (Sigma) and 2–3 ml of polyurethane elastomer, PU4ii (vasQtec, Zurich, Switzerland). After complete polymerization of the resin, the entire CAM was dissected out in warm waterbath. 5% potassium hydroxide was used briefly to macerate any membrane tissue. The CAM corrosion casts were imaged after coating with gold in an argon atmosphere with a Philips ESEM XL30 scanning electron microscope. The casts demonstrated filling of the entire CAM capillary bed without evidence of extravasation or pressure distension.
Finite element mesh (FEM) of vessel bifurcation
The construction of 3D FEM models for non-symmetrical, irregularly shaped 3D bifurcating vessel was performed as previously described (Filipovic et al., 2009). The pillar-wall interface required curved distortion of the mesh to match the morphology of the images from intravital microscopy (Filipovic et al., 2009). Otherwise, geometric measurements provided by intravital microscopy and digital image analysis were represented as faithfully as possible in the FEM model. As automation of the FEM generation was not possible, a customized approach was required for each model. Segmentation was performed on the original 2D intravital microscopy image to obtain 2D polylines of the countours. Subsequently, 2D splines were constructed from the polylines. Finally, a 3D FEM model made of 6 blocks for smooth mesh continuity was created using 3D NURBS (Non-Uniform Rational B-Spline) (Santa-Cruz and Ebrahimi, 2002). In addition, two blocks of finer mesh were used around the pillar region to detect subtle changes in wall shear stress.
Statistical analysis
Significance estimates were based on multiple comparisons of paired data by Student-Newman-Keuls or Mann-Whitney test for non-parametric analysis of variance. The values for vessel and pillar orientation for each bifurcation were exported from MetaMorph and plotted in Excel 2007 (Microsoft, Redmond WA). Pearson correlations to the unamplified control were determined using Systat 12 statistical software (Chicago, IL). The significance level for the sample distribution was defined as P<.05.
Results
Pruning vessel structure
The second and third order conducting vessels in the extraembryonic circulation of chick embryo were examined by fluorescence intravital microscopy. In EDD 13–18 chick embyos (N=62), pruning microvessels were defined by the presence of 4 morphologic features: 1) vessel confluence, 2) two or more intravascular pillars, 3) mural irregularity, and 4) an excluded zone (Figure 1). Regressing vessels were associated with convergent flow (74.9%) and multiple intravascular pillars (91%). Mural irregularity, calculated as the ratio of the vessel perimeter to axial length, was 1.2±0.1-fold greater in regressing vessels than in neighboring interbranch segments (Figure 2A). Similarly, the excluded zone, calculated as the difference between the vessel’s anatomic radius and the radius of the flow stream, was significantly greater in pruning vessel segments than in size-matched controls (Figure 2B).
Figure 1.

Figure 2.

Pillars and blood flow
Within pruning vessel segments, the morphology of both intravascular pillars and endothelial cells was studied by corrosion casting and scanning electron microscopy. The average pillar diameter was 25.1±17.8um with an elongated shape (Shape Factor. 0.34±0.14). In 34 vessel segments, the imprint of endothelial nuclei was sufficiently resolved to evaluate endothelial cell morphology. A comparison of endothelial cell size—calculated as corrosion cast surface area divided by the number of endothelial cell nuclei—showed no significant difference between regressing segments (383±74um2) and size-matched controls (369±84um2). Similarly, nuclear areas were comparable (pruning 31.2±4.5um2; control 31.1±4.2). The shape of the endothelial nuclei trended toward being more elongated (S.F. 0.67±.04) in the vessel segments undergoing pruning than in size-matched controls (S.F. 0.71±.09), but this difference was not statistically significant (p=0.18).
The blood flow associated with intravascular pillars was studied by intravital microscopy. Serial pillars, a series of two or more intravascular pillars, analyzed by time-series reconstructions (Figure 4), were spatially associated with decreased florescence intensity in the regressing segment (Figure 4A-2). Flow velocity—inversely proportional to the slope in space-time plot (Figure 4B) —was influenced by inter-pillar distance: narrow inter-pillar distances (Figure 4B segments a–b and c–d) demonstrated slower flow than wider inter-pillar distances (Figure 4B segment b–c).
Figure 4.

Pillars and mechanical forces
To map the mechanical forces associated with the pruning vascular segment, 3-D finite element models of the vascular bifurcation were constructed using in vivo-derived geometry and measured blood flow parameters. Computational simulations permitted the study of blood flow with and without intravascular pillars. Superimposing blood flow velocity profiles, calculated without intravascular pillars, on the pruning segment suggested that serial pillars form along pre-existing streamlines (Figure 5B, arrow). Blood pressure demonstrated no obvious spatial relationship with the intravascular pillars (Figure 5C). Notably, mapping of wall shear stress demonstrated a region of low wall shear stress, less than 0.3dyn/cm2, in the region of the first intravascular pillar (Figure 5D, arrow).
Figure 5.

Computational modeling of the vessel bifurcation with intravascular pillars demonstrated a highly resolved map of wall shear stress (Figure 6). The irregular walls demonstrated some variability in wall shear stress; however, modeling performed with exaggerated mural irregularities did not demonstrate an obvious spatial relationship with pillar location (not shown). Regions of high wall shear stress were most notable on the intravascular pillars. The highest wall shear stress was mapped to the pillar surface exposed to the dominant flow stream (Figure 6). In contrast, the inter-pillar surfaces demonstrated the lowest shear stress (τ <0.6).
Figure 6.
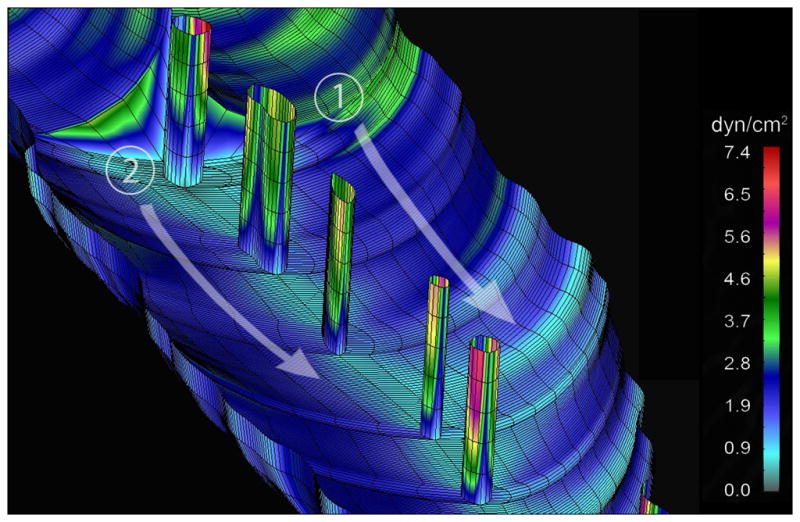
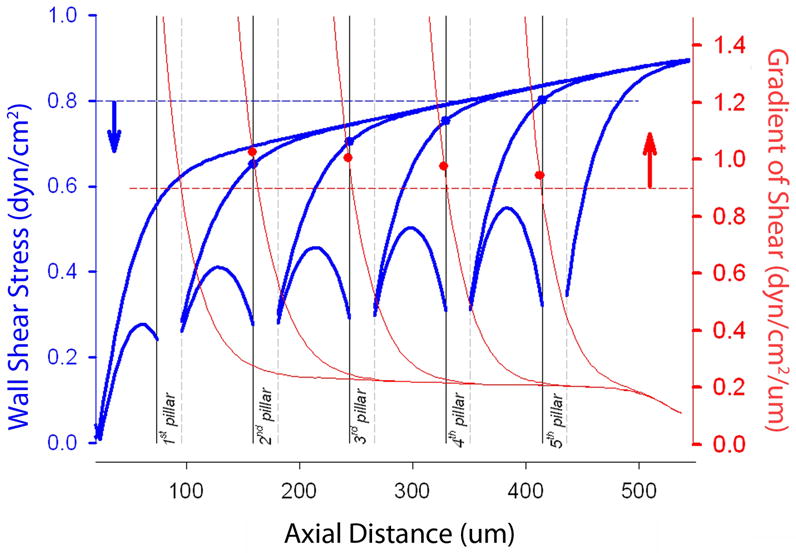
Pillar progression and periodicity
Computational modeling was used to study both the direction of pillar progression and potential explanations for pillar periodicity. Assuming pillars form sequentially, pillars can theoretically progress either proximally or distally relative to the flow stream. When wall shear stress alone was calculated, there was no significant difference in shear maps whether pillar progression occurred proximally or distally. Because of endothelial cell responsiveness to spatial gradients of shear (LaMack and Friedman, 2007), we also calculated dτ/dx for both directions of pillar progression. When pillars were assumed to develop downstream, in the direction of flow, pillar location was consistently the following:
| (1) |
In contrast, calculations assuming proximal pillar progression--that is, pillars appearing “against” the flow stream--resulted in unphysiologic shear gradients (both positive and negative). Finally, we analyzed the effect of flow velocity on pillar progression. Assuming our experimentally derived parameters (Eq 1), a Reynolds number of 0.03 produced 4 pillars at approximately 20um intervals. A Reynolds number of 0.06 produced only 2 pillars at approximately 63um intervals. A Reynolds number of 0.3 produced no pillars because wall shear stress was always ≫1.1τ.
Discussion
In this report, we studied the local mechanical forces associated with intravascular pillars and vessel pruning in 2nd and 3rd order conducting vessels of the extraembryonic circulation. Using 3-D computational flow simulations, we investigated the physiologic forces with and without intravascular pillars. Our analysis suggests that pillars develop and extend along flow streamlines; that is, pillars are constrained by high wall shear stress and extend along regions of low wall shear stress. Further, the periodicity of pillar development may reflect the spatial gradient of shear produced by the antegrade flow stream.
The word “pruning” has been applied to a variety of subtractive processes not limited to angiography-defined diseases (Schrire et al., 1965)(Cavaluzzi12544)(McCormick and Cho, 1977), computational algorithms (Kassab et al., 1994), and morphogenetic modeling (Nguyen et al., 2006). Here, pruning describes the local morphologic relationships and mechanical forces associated with the regression of 2nd and 3rd order vessels in the extraembryonic membrane. Although our focus was limited to the local forces involved in pillar-associated vessel regression, we suspect our findings will be equally relevant to more comprehensive models of tissue growth and network remodeling.
A limitation of intravital microscopic analysis of pillar-dependent vascular pruning is the sensitivity of the ex ovo cultures to changes in temperature, humidity and pH. Even when meticulous culture conditions can be maintained, global changes in blood flow complicate the interpretation of changing structure. For example, decreased blood flow through a pillar series may give the appearance of pillar growth; however, an equally likely possibility is that the decreased blood flow may simply unmask pre-existing mural irregularities. To avoid this confounded interpretation, we used intravital microscopy to define the structure and microhemodynamics of the regressing segment, then applied 3D computational modeling to investigate variations in structure and blood flow.
An empirical observation--in both regressing vessels and contiguous vessel segments--was the presence of thickened and irregular vessel margins. The thickened vessel wall, reminiscent of the “randzone” described by Thoma more than 100 years ago (Thoma, 1893a), was measured after the injection of fluorescent- dextran plasma marker. Based on Intravital microscopy recordings, we measured the difference between a wider anatomic projection of the vessel and a narrower speckled pattern of the flow stream. This marginal florescence--here referred to as the “excluded zone”, because it was excluded from the flow stream--was several-fold greater than control vessels and ten-fold greater than a comparable region in human vessels (Henry and Duling, 1999; Platts and Duling, 2004; Rubio-Gayosso et al., 2006). Although the apparent excluded zone could have been exaggerated by the low hematocrit (Baumann et al., 1983) and prominent cell-depleted wall layer (Popel and Johnson, 2005; Sugihara-Seki and Fu, 2005) in the circulation, the excluded zone in regressing vessels was nonetheless significantly greater than control vessels within the same vascular system. We suspect that the excluded zone in our studies, as well as the randzone in Thoma’s work, represent endothelial-bound carbohydrates or glycocalyx (Ausprunk, 1986). The function of the glycocalyx in regressing vessels is unknown, but a role in mechanotransduction is an intriguing possibility (Tarbell and Pahakis, 2006; Yao et al., 2007).
A related observation was the irregular vessel wall noted in the region of regressing blood vessels. After digital recombination of fluorescence time-series recordings, mural irregularity was measured as the ratio of the vessel perimeter to the axial length of the inter-branch segment. The significance of the mural irregularity remains puzzling. The mural irregularity, widely varied in computational simulations (not shown), produced neither a significant effect on pillar shear stress maps nor an explanation for pillar periodicity. Although both the excluded zone and mural irregularities are intriguing observations, their role in vessel pruning remains unclear.
An intriguing biological feature of multiple intravascular pillars is their periodicity. In pruning microvessels with several intravascular pillars, there is currently no satisfying explanation for the quasi-regular gap between pillars. The possibility that pillars represent retained tissue islands from earlier development is challenged by the distinct scale and distant location of the conducting vessel pillars relative to the capillary plexus. Another possibility is that intravascular pillars are remnants of an earlier, and incomplete, pruning process. This possibility, however, does not account for the initial process giving rise to the pillars nor the presence of multiple pillars in series. Because of the limitations of these alternative explanations, and based on our observations of pillars in both adult chronic inflammation (Konerding et al., 2010) and the CAM (Lee et al., 2010), we have postulated that 1) intravascular pillars form in the conducting vessels, and 2) their formation is sequential.
Spatial gradients of wall shear stress are relevant to a variety of nonrandom and localized structural changes in the vascular system; structural changes that range from the focal lesions of atherosclerotic disease (Davies, 2009) to the periodicity of intravascular pillars in extraembryonic vessels of chick embryos. Endothelial cell responses to spatial gradients of wall shear stress have been studied in a wide variety of conditions in vitro (White et al., 2001; Barbee, 2002; Blackman et al., 2002; Hsiai et al., 2002; McKinney et al., 2006; Shen et al., 2008; Szymanski et al., 2008; Farcas et al., 2009). In general, these studies have suggested endothelial cell responsiveness to shear gradients and even differential transcriptional responses to different aspects of the shear field (LaMack and Friedman, 2007). In vitro studies have an underlying assumption that the spatial distribution of in vitro shear gradients reflects a scale that exists in vivo; that is, a physiologically relevant spatial gradient detected by individual endothelial cells. Alternatively, the detection of larger spatial gradients is plausible, but would require information transfer between endothelial cells (Secomb and Pries, 2002).
The extraembryonic vessels provide potential insights into the spatial gradients of shear in vivo. The nonrandom and periodic distribution of intravascular pillars is consistent with the integral scale of the CAM endothelial cells: intravital microscopy demonstrated pillars at approximately 20um intervals and corrosion casting demonstrated endothelial cell surface area in the range of 380um2. The spatial gradients also provide a potential source of directionality in the sequence of pillar development. Because of the predominance of viscous forces over inertial forces in the extraembryonic vessels (low Reynolds number flow), wall shear stress alone does not predict the direction of pillar formation; specifically, the map of wall shear stress is the same whether the sequence of pillar formation proceeds with the flow stream (distally) or against the flow stream (proximally). In contrast, the spatial gradient of shear stress in our studies predicted the downstream development of sequential pillars. Based on flow parameters derived from pruning vessels, the combination of wall shear stress and the gradient of shear predicted both the location and direction of developing pillars. We anticipate that these predictions will be tested in future studies.
Finally, an interesting feature of the CAM network was the complex adaptive response of the microcirculation to experimental manipulations. Although not reported here, photodynamic occlusion of vessels spatially related to the pruning vessels resulted in unpredictable flow patterns. Vascular occlusion was frequently associated with not only wide variation in blood flow velocity, but also flow reversal and oscillatory flow. The response to focal occlusion was reminiscent of the flow patterns observed after segmental occlusions in other microcirculatory networks (Miele et al., 2009). Future studies will benefit from network computational models that can accurately simulate perturbations in system components as well as spatial statistics capable of characterizing the variable flow patterns across the network.
Figure 3.

Figure 7.
Acknowledgments
Supported in part by NIH Grant HL94567 and HL75426
Abbreviations
- 2D
2-dimensional
- 3D
3-dimensional
- CAM
chick chorioallantoic membrane
- EDD
embryonic development day
- FITC-dextran
Fluorescein isothiocyanate-dextran
- FEM
finite element mesh
- SF
shape factor
References
- Ausprunk DH. Distribution of hyaluronic-acid and sulfated glycosaminoglycans during blood-vessel development in the chick chorioallantoic membrane. American Journal of Anatomy. 1986;177:313–331. doi: 10.1002/aja.1001770304. [DOI] [PubMed] [Google Scholar]
- Ausprunk DH, Knighton DR, Folkman J. Differentiation of vascular endothelium in the chick chorioallantois: a structural and autoradiographic study. Dev Biol. 1974;38:237–248. doi: 10.1016/0012-1606(74)90004-9. [DOI] [PubMed] [Google Scholar]
- Barbee KA. Role of subcellular shear-stress distributions in endothelial cell mechanotransduction. Ann Biomed Eng. 2002;30:472–482. doi: 10.1114/1.1467678. [DOI] [PubMed] [Google Scholar]
- Baumann R, Padeken S, Haller EA, Brilmayer T. Effects of hypoxia on oxygen-affinity, hemoglobin pattern, and blood-volume of early chicken embryos. Am J Physiol Heart Circ Physiol. 1983;244:R733–R741. doi: 10.1152/ajpregu.1983.244.5.R733. [DOI] [PubMed] [Google Scholar]
- Blackman BR, Garcia-Cardena G, Gimbrone MA., Jr A new in vitro model to evaluate differential responses of endothelial cells to simulated arterial shear stress waveforms. J Biomech Eng. 2002;124:397–407. doi: 10.1115/1.1486468. [DOI] [PubMed] [Google Scholar]
- Burri PH, Tarek MR. A novel mechanism of capillary growth in the rat pulmonary microcirculation. Anat Rec. 1990;228:35–45. doi: 10.1002/ar.1092280107. [DOI] [PubMed] [Google Scholar]
- Caduff JH, Fischer LC, Burri PH. Scanning electron microscope study of the developing microvasculature in the postnatal rat lung. Anat Rec. 1986;216:154–164. doi: 10.1002/ar.1092160207. [DOI] [PubMed] [Google Scholar]
- Chapman WB. The effect of the heart-beat upon the development of the vascular system in the chick. American Journal of Anatomy. 1918;23:175–203. [Google Scholar]
- Davies PF. Hemodynamic shear stress and the endothelium in cardiovascular pathophysiology. Nature Clinical Practice Cardiovascular Medicine. 2009;6:16–26. doi: 10.1038/ncpcardio1397. [DOI] [PMC free article] [PubMed] [Google Scholar]
- Defouw DO. Structural heterogeneity within the pulmonary microcirculation of the normal rat. Anat Rec. 1988;221:645–654. doi: 10.1002/ar.1092210210. [DOI] [PubMed] [Google Scholar]
- Defouw DO, Rizzo VJ, Steinfeld R, Feinberg RN. Mapping of the microcirculation in the chick chorioallantoic membrane during normal angiogenesis. Microvasc Res. 1989;38:136–147. doi: 10.1016/0026-2862(89)90022-8. [DOI] [PubMed] [Google Scholar]
- Dimitropoulou C, Malkusch W, Fait E, Maragoudakis ME, Konerding MA. The vascular architecture of the chick chorioallantoic membrane: sequential quantitative evaluation using corrosion casting. Angiogenesis. 1998;2:255–263. doi: 10.1023/A:1009210918738. [DOI] [PubMed] [Google Scholar]
- Djonov V, Baum O, Burri PH. Vascular remodeling by intussusceptive angiogenesis. Cell Tissue Res. 2003;314:107–117. doi: 10.1007/s00441-003-0784-3. [DOI] [PubMed] [Google Scholar]
- Djonov V, Schmid M, Tschanz SA, Burri PH. Intussusceptive angiogenesis: its role in embryonic vascular network formation. Circ Res. 2000;86:286–292. doi: 10.1161/01.res.86.3.286. [DOI] [PubMed] [Google Scholar]
- Farcas MA, Rouleau L, Fraser R, Leask RL. The development of 3-D, in vitro, endothelial culture models for the study of coronary artery disease. Biomedical Engineering. 2009 doi: 10.1186/1475-925X-8-30. Online 8. [DOI] [PMC free article] [PubMed] [Google Scholar]
- Fenton BM, Zweifach BW. Microcirculatory model relating geometrical variation to changes in pressure and flow rate. Ann Biomed Eng. 1981;9:303–321. [Google Scholar]
- Filipovic N, Tsuda A, Lee GS, Miele L, Lin M, Konerding MA, Mentzer SJ. Computational flow dynamics in a geometric model of intussusceptive angiogenesis. Microvasc Res. 2009;78:286–293. doi: 10.1016/j.mvr.2009.08.004. [DOI] [PMC free article] [PubMed] [Google Scholar]
- Hamburger V, Hamilton HL. A series of normal stages in the development of the chick embryo. J Morphol. 1951;88:49. [PubMed] [Google Scholar]
- Henry CBS, Duling BR. Permeation of the luminal capillary glycocalyx is determined by hyaluronan. American Journal of Physiology-Heart and Circulatory Physiology. 1999;277:H508–H514. doi: 10.1152/ajpheart.1999.277.2.H508. [DOI] [PubMed] [Google Scholar]
- Hsiai TK, Cho SK, Honda HM, Hama S, Navab M, Demer LL, Ho CM. Endothelial cell dynamics under pulsating flows: Significance of high versus low shear stress slew rates (delta tau/delta t) Ann Biomed Eng. 2002;30:646–656. doi: 10.1114/1.1484222. [DOI] [PubMed] [Google Scholar]
- Jones EA, Crotty D, Kulesa PM, Waters CW, Baron MH, Fraser SE, Dickinson ME. Dynamic in vivo imaging of postimplantation mammalian embryos using whole embryo culture. Genesis. 2002;34:228–235. doi: 10.1002/gene.10162. [DOI] [PubMed] [Google Scholar]
- Jones EAV, le Noble F, Eichmann A. What determines blood vessel structure? Genetic prespecification vs. hemodynamics. Physiology. 2006;21:388–395. doi: 10.1152/physiol.00020.2006. [DOI] [PubMed] [Google Scholar]
- Kassab GS, Lin DH, Fung YC. Consequences of pruning in morphometry of coronary vasculature. Ann Biomed Eng. 1994;22:398–403. doi: 10.1007/BF02368246. [DOI] [PubMed] [Google Scholar]
- Konerding MA, Turhan A, Ravnic DJ, Lin M, Fuchs C, Secomb TW, Tsuda A, Mentzer SJ. Inflammation-induced intussusceptive angiogenesis in murine colitis. Anat Rec. 2010 doi: 10.1002/ar.21110. In press. [DOI] [PMC free article] [PubMed] [Google Scholar]
- LaMack JA, Friedman MH. Individual and combined effects of shear stress magnitude and spatial gradient on endothelial cell gene expression. American Journal of Physiology-Heart and Circulatory Physiology. 2007;293:H2853–H2859. doi: 10.1152/ajpheart.00244.2007. [DOI] [PubMed] [Google Scholar]
- Lee GS, Filipovic N, Miele LF, Simpson DC, Lin M, Konerding MA, Tsuda A, Mentzer SJ. Blood flow shapes intravascular pillar geometry in the chick chorioallantoic membrane. Journal of Angiogenesis Research. 2010 doi: 10.1186/2040-2384-2-11. In press. [DOI] [PMC free article] [PubMed] [Google Scholar]
- Manner J, Seidl W, Steding G. Formation of the cervical flexure: An experimental study on chick embryos. Acta Anatomica. 1995;152:1–10. doi: 10.1159/000147677. [DOI] [PubMed] [Google Scholar]
- McCormick TL, Cho KJ. Angiographic findings in renal amyloidosis. AJR Am J Roentgenol. 1977;129:855–858. doi: 10.2214/ajr.129.5.855. [DOI] [PubMed] [Google Scholar]
- McKinney VZ, Rinker KD, Truskey GA. Normal and shear stresses influence the spatial distribution of intracellular adhesion molecule-1 expression in human umbilical vein endothelial cells exposed to sudden expansion flow. J Biomech. 2006;39:806–817. doi: 10.1016/j.jbiomech.2005.02.002. [DOI] [PubMed] [Google Scholar]
- Miele LF, Turhan A, Lee GS, Lin M, Ravnic DJ, Tsuda A, Konerding MA, Mentzer SJ. Blood flow patterns spatially associated with platelet aggregates in murine colitis. Anat Rec. 2009;292:1143–1153. doi: 10.1002/ar.20954. [DOI] [PMC free article] [PubMed] [Google Scholar]
- Nguyen TH, Eichmann A, Le Noble F, Fleury V. Dynamics of vascular branching morphogenesis: The effect of blood and tissue flow. Physical Review E. 2006;73:14. doi: 10.1103/PhysRevE.73.061907. [DOI] [PubMed] [Google Scholar]
- Platts SH, Duling BR. Adenosine A(3) receptor activation modulates the capillary endothelial glycocalyx. Circ Res. 2004;94:77–82. doi: 10.1161/01.RES.0000108262.35847.60. [DOI] [PubMed] [Google Scholar]
- Popel AS, Johnson PC. Microcirculation and hemorheology. Annual Review of Fluid Mechanics. 2005;37:43–69. doi: 10.1146/annurev.fluid.37.042604.133933. [DOI] [PMC free article] [PubMed] [Google Scholar]
- Rahn H, Paganelli CV, Ar A. Avian egg: air-cell gas tension, metabolism and incubation-time. Respiration Physiology. 1974;22:297–309. doi: 10.1016/0034-5687(74)90079-6. [DOI] [PubMed] [Google Scholar]
- Ravnic DJ, Tsuda A, Turhan A, Zhang Y-Z, Pratt JP, Huss HT, Mentzer SJ. Multi-frame particle tracking in intravital imaging: defining lagrangian coordinates in the microcirculation. BioTechniques. 2006;41:597–601. doi: 10.2144/000112262. [DOI] [PubMed] [Google Scholar]
- Ravnic DJ, Zhang Y-Z, Turhan A, Tsuda A, Pratt JP, Huss HT, Mentzer SJ. Biological and optical properties of fluorescent nanoparticles developed for intravascular imaging. Microsc Res Tech. 2007;70:776–781. doi: 10.1002/jemt.20463. [DOI] [PubMed] [Google Scholar]
- Rizzo V, Kim D, Duran WN, DeFouw DO. Differentiation of the microvascular endothelium during early angiogenesis and respiratory onset in the chick chorioallantoic membrane. Tissue Cell. 1995;27:159–166. doi: 10.1016/s0040-8166(95)80018-2. [DOI] [PubMed] [Google Scholar]
- Romanoff AL. The avian embryo: structural and functional development. New York: Macmillan; 1960. External membranes; pp. 1140–1151. [Google Scholar]
- Rubio-Gayosso I, Platts SH, Duling BR. Reactive oxygen species mediate modification of glycocalyx during ischemia-reperfusion injury. American Journal of Physiology-Heart and Circulatory Physiology. 2006;290:H2247–H2256. doi: 10.1152/ajpheart.00796.2005. [DOI] [PubMed] [Google Scholar]
- Sabin FR. Development of the primitive vessels of the chick and of the pig. Contributions to Embryology. 1917;6:63–U16. [Google Scholar]
- Santa-Cruz D, Ebrahimi T. Coding of 3D virtual objects with NURBS. Signal Processing. 2002;82:1581–1593. [Google Scholar]
- Schrire V, Vogelpoel L, Beck W, Nellen M, Swanepoel A. Ventricular septal defect: the clinical spectrum. Br Heart J. 1965;27:813–828. doi: 10.1136/hrt.27.6.813. [DOI] [PMC free article] [PubMed] [Google Scholar]
- Secomb TW, Pries AR. Information transfer in microvascular networks. Microcirculation. 2002;9:377–387. doi: 10.1038/sj.mn.7800146. [DOI] [PubMed] [Google Scholar]
- Shen CJ, Fu JP, Chen CS. Patterning Cell and Tissue Function. Cellular and Molecular Bioengineering. 2008;1:15–23. [Google Scholar]
- Sugihara-Seki M, Fu BMM. Blood flow and permeability in microvessels. Fluid Dynamics Research. 2005;37:82–132. [Google Scholar]
- Szymanski MP, Metaxa E, Meng H, Kolega J. Endothelial cell layer subjected to impinging flow mimicking the apex of an arterial bifurcation. Ann Biomed Eng. 2008;36:1681–1689. doi: 10.1007/s10439-008-9540-x. [DOI] [PMC free article] [PubMed] [Google Scholar]
- Tanaka NG, Sakamoto N, Tohgo A, Nishiyama Y, Ogawa H. Structural heterogeneity within the pulmonary microcirculation of the normal rat Inhibitory effects of anti-angiogenic agents on neovascularization and growth of the chorioallantoic membrane (CAM). The possibility of a new CAM assay for angiogenesis inhibition. Experimental Pathology. 1986;30:143–150. doi: 10.1016/s0232-1513(86)80087-1. [DOI] [PubMed] [Google Scholar]
- Tarbell JM, Pahakis MY. Mechanotransduction and the glycocalyx. J Intern Med. 2006;259:339–350. doi: 10.1111/j.1365-2796.2006.01620.x. [DOI] [PubMed] [Google Scholar]
- Thoma R. Untersuchungen uber die Histogenese und Histomechanik des Gefasssystem. Stuttgart: Verlag; 1893a. Allgemeine histomechanik des gefasssystems; pp. 24–51. [Google Scholar]
- Thoma R. Untersuchungen uber die Histogenese und Histomechanik des Gefasssystem. Stuttgart: Verlag; 1893b. p. 91. [Google Scholar]
- Tufan AC, Satiroglu-Tufan NL. The chick embryo chorioallantoic membrane as a model system for the study of tumor angiogenesis, invasion and development of anti-angiogenic agents. Curr Cancer Drug Targets. 2005;5:249–266. doi: 10.2174/1568009054064624. [DOI] [PubMed] [Google Scholar]
- Turhan A, Konerding MA, Tsuda A, Ravnic DJ, Hanidizar D, Lin MY, Mentzer SJ. Bridging mucosal vessels associated with rhythmically oscillating blood flow in murine colitis. Anat Rec. 2007;291:74–92. doi: 10.1002/ar.20628. [DOI] [PubMed] [Google Scholar]
- Wakimoto K, Kobayashi K, Kuro-o M, Yao A, Iwamoto T, Yanaka N, Kita S, Nishida A, Azuma S, Toyoda Y, Omori K, Imahie H, Oka T, Kudoh S, Kohmoto O, Yazaki Y, Shigekawa M, Imai Y, Nabeshima Y, Komuro I. Targeted disruption of Na+/Ca2+ exchanger gene leads to cardiomyocyte apoptosis and defects in heartbeat. J Biol Chem. 2000;275:36991–36998. doi: 10.1074/jbc.M004035200. [DOI] [PubMed] [Google Scholar]
- Weibel ER. Morphometry of pulmonary circulation. Basel: Karger; 1969. pp. 2–12. [Google Scholar]
- White CR, Haidekker M, Bao X, Frangos JA. Temporal gradients in shear, but not spatial gradients, stimulate endothelial cell proliferation. Circulation. 2001;103:2508–2513. doi: 10.1161/01.cir.103.20.2508. [DOI] [PubMed] [Google Scholar]
- Yao Y, Rabodzey A, Dewey CF. Glycocalyx modulates the motility and proliferative response of vascular endothelium to fluid shear stress. American Journal of Physiology-Heart and Circulatory Physiology. 2007;293:H1023–H1030. doi: 10.1152/ajpheart.00162.2007. [DOI] [PubMed] [Google Scholar]