Abstract
As regulation of CD8 T cell homeostasis is incompletely understood, we investigated the effect of VIP signaling on CD8 T cell activities in vivo. Herein, we show that adoptively transferred CD8 T cells responding to a Listeria monocytogenes infection downregulated VPAC1 expression during primary and secondary expansion. VPAC1 expression was restored during contraction and regained naïve levels in primary, but remained low during secondary, memory generation. VIP co-administration with primary infection suppressed CD8 T cell expansion (≈50%). As VPAC1 is silenced upon CD8 T cell activation, it may therefore play a significant role in their optimal expansion.
Keywords: neuropeptide, neuropeptide receptor, memory T cells, CD8 T cell, VIP, VPAC1
Introduction
Vasoactive Intestinal Peptide (VIP) is delivered by the peripheral nervous system to primary and secondary immune organs (Bellinger et al., 1996; Said and Mutt, 1970). Innate and adaptive immune cells express two G-protein coupled receptors, vasoactive intestinal peptide/pituitary adenylate cyclase activating polypeptide receptor 1 (VPAC1) and VPAC2 (Delgado et al., 2004; Dickson and Finlayson, 2009; Smalley et al., 2009), allowing these cells to respond to the VIP ligand. Originally classified as a vasoactive peptide from the gut (Said, 1974), VIP has been recategorized as an immunosuppressive neuropeptide (Reviewed in (Delgado et al., 2004)). VIP is a neurotransmitter and mitogenic factor for neurons in the brain (Pincus et al., 1990), but is an anti-inflammatory mediator within the immune system (Bellinger et al., 1997; Ottaway and Greenberg, 1984; Xin et al., 1994). In addition to VIP+ nerves, other sources of VIP are thymocytes and activated Th2 CD4 T cells (Delgado et al., 1999a; Vassiliou et al., 2001).
Distinguishing whether VPAC1 or VPAC2 is responsible for VIP’s effects is complicated due to the significant changes in their expression patterns depending on T cell activation status. For example, we have demonstrated that activated T cells downregulate VPAC1 mRNA expression through a Src kinase/ZAP70/JNK mediated mechanism (Vomhof-DeKrey and Dorsam, 2008; Vomhof-DeKrey et al., 2008). Regarding VPAC2, in vitro studies have shown that its mRNA expression is inducible upon T cell activation (Delgado et al., 1996; Voice et al., 2001). These observations were supported in vivo by Metwali et al., where they showed that schistosome infected mice had VPAC2+ T cells present in granulomas, but splenic T cells were VPAC2− (Metwali et al., 2000). However, several other groups have failed to demonstrate VPAC2 upregulation by in vitro activation conditions (Metwali et al., 1996; Qian et al., 2001). Collectively, these discrepancies emphasize the need to study VIP receptor expression in a more physiologically relevant in vivo environment.
A great deal of research over the past decade has uncovered mechanisms by which VIP, binding to either VPAC1 or VPAC2, affect CD4 T cell functions, specifically Th2 humoral immunity (Sharma et al., 2006; Voice et al., 2004; Voice et al., 2001). In contrast, very little data has been collected regarding the effects of VIP on cell-mediated immunity carried out by CD8 T cells. Therefore, in this study, we mapped VPAC1 and VPAC2 levels throughout a primary and secondary Listeria monocytogenes infection in the well established OT-I mouse model (Hogquist et al., 1994). To our knowledge, this is the first report of VIP receptor measurement in an in vivo CD8 T cell immune response. Functionally active VPAC1 receptor protein and mRNA became transiently silenced during CD8 expansion, and was restored during contraction. VPAC2 mRNA, surprisingly, was not detected during primary or secondary infections. Importantly, VIP co-administration during primary infection resulted in a significant suppression of CD8 T cell expansion (≈50%). Collectively, these data demonstrate that the immunosuppressive effects by VIP in resting antigen-specific CD8 T cells appear to be exclusively transmitted by the VPAC1 receptor.
Materials and Methods
Mice
Wild type C57BL/6J, C57BL/6-Tg (TcraTcrb)1100Mjb/J (OT-I), and B6.PL-Thy1a/CyJ (Thy1.1) mice were purchased from Jackson Laboratories (Bar Harbor, ME) and housed at NDSU. All animal studies were conducted with prior approval from the NDSU Institutional Animal Care and Use Committee, which sets best practice standards for the university under the guidance of the Office of Laboratory Animal Welfare.
Bacteria
act A− Listeria monocytogenes-OVA (LM-OVA) (Pope et al., 2001) was grown in TSB broth + 500 µg streptomycin, and then ~1 × 10⁷ LM-OVA cells were injected retro-orbitally into recipient mice. Listeria-infected mice were housed under appropriate biosafety conditions. Mice between 6–28 weeks of age were used.
Flow cytometry
The following antibodies were utilized: CD44 (clone IM7, Biolegend), CD25 (clone PC61.5, eBioscience, San Diego, CA; clone 3C7, Biolegend), CD8a (clone 53-6.7, eBioscience), CD4 (clone RM4-4 or GK1.5, Biolegend), CD90.1 (clone OX-7, Biolegend), CD62L (clone MEL-14, Biolegend), CD127 (clone SB/199, Biolegend), TCR Vα2 (clone B20.1, Biolegend), CD69 (clone H1.2F3, Biolegend) and isotype controls IgG2aκ, IgG1κ, IgG2bκ and IgG (clones RTK2758, MOPC-21, eB149/10H5 and HTK888; Biolegend). At specific time points, splenocytes were stained with identifying (CD8 or CD4 or CD90.1) and activation marker (CD25, CD69, CD62L, or CD127) antibodies in order to numerate and determine the activation state of the Thy1.1+/OT-I cells or polyclonally activated CD4 and CD8 T cells. For mVPAC1 antibody staining, total splenocytes (3 × 10⁶) were resuspended in 100 µl PBS/0.5% BSA using 5 ml Falcon tubes and incubated with 1:100 melon gel (Bio-Rad, Hercules, CA) purified α-mVPAC1 polyclonal antibody (Aldevron, Fargo, ND) or rabbit serum for 30 min at 4°C in the dark. Cells were washed twice with 1 ml PBS/0.5% BSA, centrifuged for 5 min at 500xg, supernatants aspirated off and incubated with secondary, PE-goat anti-rabbit IgG for 15 min at 4°C in the dark. Cells were washed twice with 1 ml PBS/0.5% BSA, centrifuged for 5 min at 500xg, and resuspended in 300 µl PBS/0.5% BSA. Flow cytometry was performed on a FACSCalibur (Becton Dickinson, Franklin Lakes, NJ) or an Accuri C6 Cytometer (Ann Arbor, MI).
Polyclonal Activation
C57Bl/6J mice were retro-orbitally injected with 10 or 50 µg anti-CD3 (Biolegend) or Armenian Hamster isotype (Biolegend, San Diego, CA) (Bemelmans et al., 1994). Twenty-four (24) hr later, mice were euthanized by rapid cervical dislocation and spleens harvested. Spleens were minced in RPMI with 10% defined FBS (Hyclone, Logan, UT) and 1% penicillin/streptomycin at room temperature. Dispersed splenocytes were passed through a 70 µm sieve (BD Biosciences, San Jose, California) and centrifuged at 500xg for 5 min. Splenocytes were stained with anti-CD4 or anti-CD8α magnetic beads and isolated by magnetic bead technology using an AutoMACs instrument (Miltenyi Biotec, Bergisch Gladbach, Germany) with the Possel (positive selection) program. Splenocytes were applied to the instrument twice as described by the manufacturer. Typical purity was >90% as determined by flow cytometry using anti-CD4 (clone RM4-4, Biolegend) or anti-CD8a (clone 53-6.7, eBioscience).
Adoptive Transfers
Donor Thy1.1+/OT-I mice were genotyped by flow cytometry using antibodies specific for CD90.1 and TCR Vα2. Donor mice were retro-orbitally bled and approximately 500 Thy1.1+/OT-I cells were adoptively transferred to naïve, C57BL/6J (Thy1.2) mice. One day post transfer, mice were immunized with 1 × 10⁷ LM-OVA.
Purification of Thy1.1+ Adoptively Transferred T Cells
At different times post-infection (p.i.), mice were euthanized by rapid cervical dislocation and splenocytes were isolated as described above. Single cell suspensions were stained with anti-CD90.1 magnetic beads (Thy1.1) and isolated on an AutoMacs as described above. Typical purity was ≥90% by flow cytometry as described above with 2–3 applications over the magnetic column.
RNA isolation and qRT-PCR
Total RNA from enriched CD8+, CD4+ or CD90.1+ T cells was isolated by sequential passes through a QIAshredder spin column followed by an RNeasy Micro column with on-column DNase I treatment as described by the manufacturer (Qiagen, Valencia, CA). After total RNA elution and a second DNase treatment (gDNA wipeout), cDNA synthesis was performed using the QuantiTect Reverse Transcription Kit as described by the manufacturer (Qiagen). Real time reactions contained the following, 1x SYBRGreen Master Mix (Applied Biosystems, Inc., Carlsbad, California), 250 nM mVPAC1 (forward, 5’- GAT ATG GCC CTC TTC AAC AAC G-3’; reverse, 5’- GAA GTT GGC CAT GAC GCA AT-3’) or mHPRT (forward, 5’-CTG GTG AAA AGG ACC TCT CG-3’; reverse, 5’-TGA AGT ACT CAT TAT AGC AAG GGC A-3’) or 400 nM mVPAC2 (forward, 5’-CCA GAT GTT GGT GGC AAT GA-3’, reverse, 5’-GTA TGT GGA TGA GAT GCC AAT AGG-3’) primers and a 1/16 dilution of cDNA. The final volume of the reactions was 20 µl, and dissociation curves confirmed a single amplification species.
Intracellular cAMP Competitive ELISA
Naïve, CD8+ T cells and Day 5, Thy1.1+/OT-I cells p.i. were isolated as described above. Approximately, 5 × 10⁶ cells/ml were seeded in a 96 well plate (100 µl), were pretreated with phosphodiesterase inhibitor (750µM), 3-isobutyl-1-methylxanthine (Sigma, St. Louis, MO), and then treated with VIP (10−7 M) or water control for 15 minutes at 37°C. Cells were lysed with 0.1 M HCl and the intracellular cAMP concentration (i[cAMP]) was measured by a competitive ELISA kit following the manufacturer’s protocol (Cayman Chemical Company, Ann Arbor, MI). A cAMP standard curve was performed with all experiments showing linearity in a range of (0.5–500 pmol/ml). All unknown absorbance values were collected within this range using duplicate, replicates.
Statistics
All qPCR and i[cAMP] data are presented as means ±SEM and experiments are conducted at least 2–6 independent times unless otherwise mentioned in the figure legend. A two way t-test analysis was performed by the Origin® graphical software program to determine statistical significance (p≤ 0.05), and is noted in the figure legends by asterisk symbols. Flow cytometry data is presented as representative for the indicated number of independent experiments.
Results
VIP receptor expression levels are downregulated during in vivo anti-CD3 treatment
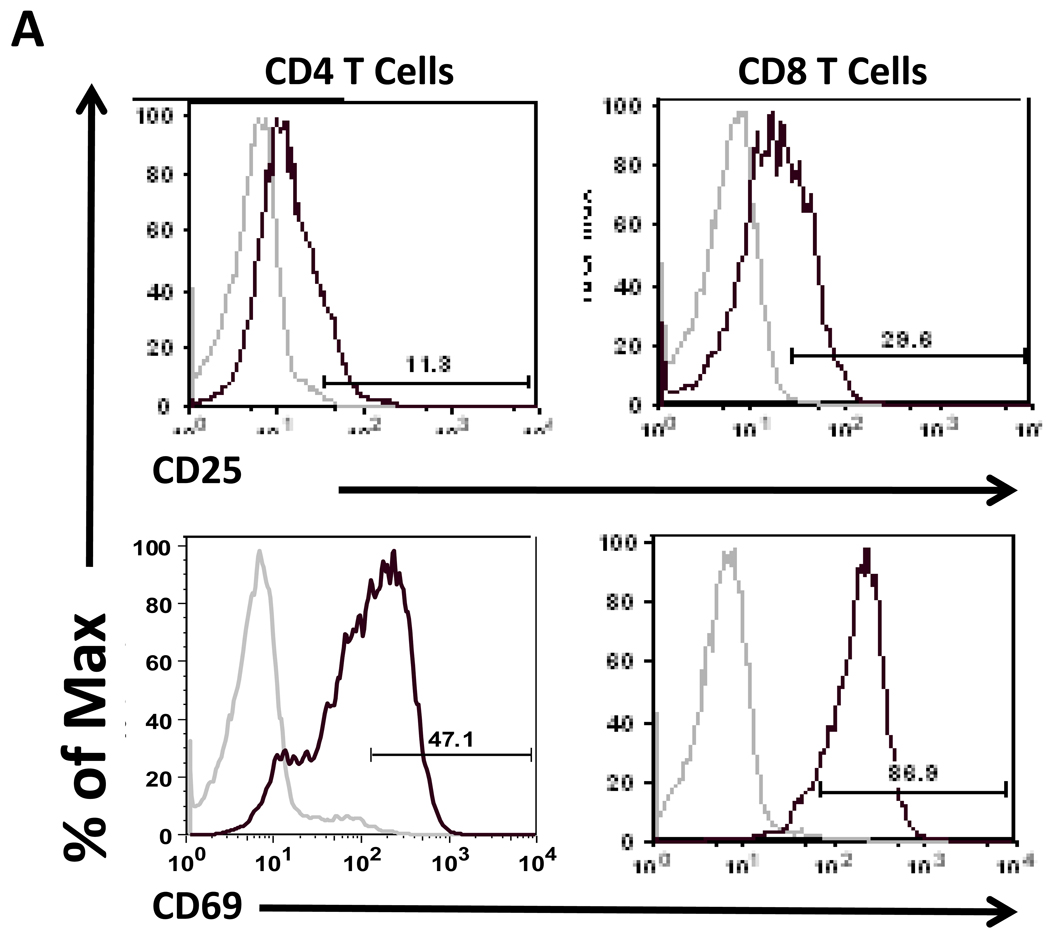
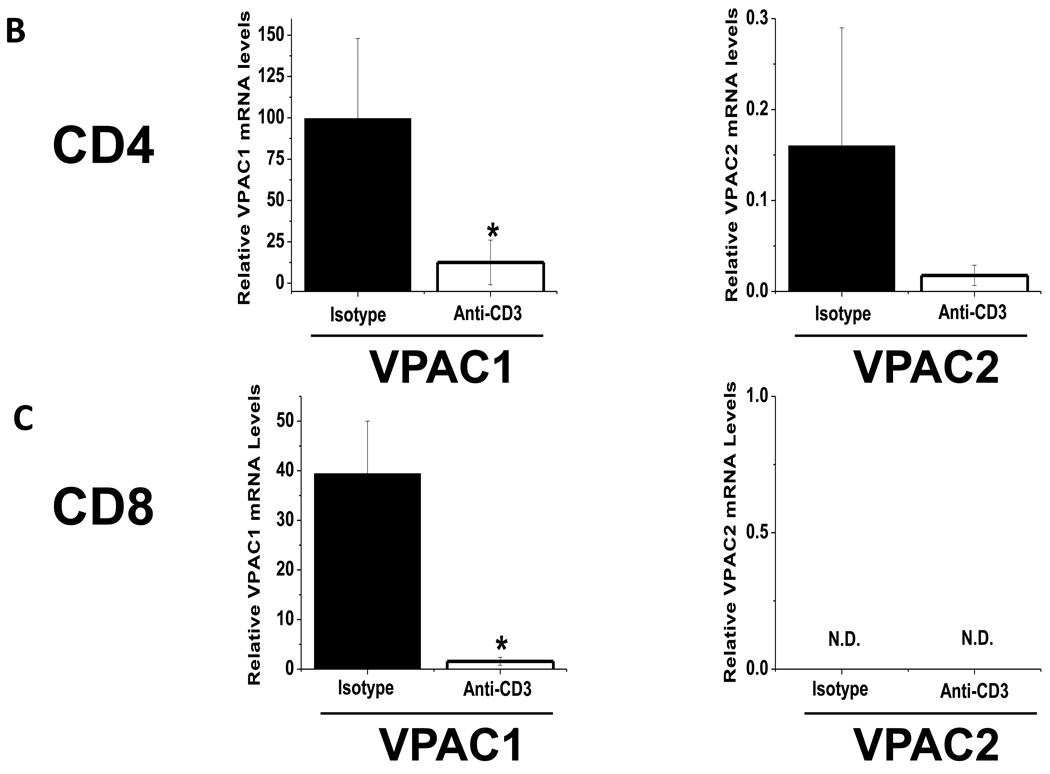
Previously, we reported an upregulation of VPAC1 mRNA levels after 24 hours in culture, which was blocked by T cell activation (Vomhof-DeKrey et al., 2008). These results indicated that TCR signaling blocks the increase of VPAC1 expression due to culture conditions, rather than actively downregulating its expression as others have reported (Lara-Marquez et al., 2001; Lara-Marquez et al., 2000). Therefore, as VPAC1 is prone to fluctuations dependent on its environment, the focus of this study was to access VIP receptor expression in vivo. To this end, we performed in vivo polyclonal T cell activation by intravenous administration of anti-CD3 antibody into C57Bl/6 mice (Bemelmans et al., 1994; Hirsch et al., 1989; Pope et al., 2001). CD4 and CD8 T cells were magnetically isolated 24 hours later, and CD25 and CD69 activation markers were assessed by flow cytometry to confirm an activated phenotype (Fig. 1A) (D'Souza et al., 2008). VPAC1 and VPAC2 mRNA levels were measured by qRT-PCR. Figure 1B shows that the basal levels of VPAC1 dwarfed that of VPAC2 in CD4 T cells by nearly three orders of magnitude (compare axes between left and right panels). Polyclonal in vivo activation by anti-CD3 treatment resulted in ≈90% downregulation of VPAC1 and VPAC2 mRNA levels. In Figure 1C, CD8 T cells demonstrated exclusive VPAC1 expression at ≈25% of the level found in CD4 T cells, and showed a similar decrease in VPAC1 expression upon activation (97%). However, CD8 T cells failed to express detectable VPAC2 levels in naïve or activated cells. In summary, VPAC1 is downregulated at the mRNA level in T cells by in vitro and in vivo activating conditions. Surprisingly, the “inducible” VPAC2 receptor mRNA was not upregulated in our in vivo activation assay as previously reported by others using in vitro activation conditions (Delgado et al., 1996; Voice et al., 2001). Moreover, due to the absence of VPAC2 expression in CD8 T cells, VPAC1 may exclusively transmit VIP signals in these cells and modulate their cellular activities (Delgado and Ganea, 2000b).
Figure 1. VIP receptor mRNA levels are downregulated by in vivo activation conditions.
Mice were retro-orbitally injected with 10 µg of Armenian hamster isotype control antibody, or anti-CD3 for 24 hours followed by magnetic bead isolation of splenic T cells and qRT-PCR analysis (Materials and Methods). Data is representative of 2–4 experiments utilizing at least four mice per experiment. A. Flow cytometric analysis of indicated activation markers for isotype control (grey line) or anti-CD3 treated mice (black line) in CD4 and CD8 T cells. Gate frequencies are percent positive of total population. B–C. qPCR measurements for VIP receptor mRNA expression normalized to HPRT from isotype control, or anti-CD3 treatment for hours. Relative levels of VIP receptor expression in CD4 cells (B) and CD8 T cells (C) are shown. Left panels show VPAC1 expression and right panels show VPAC2, however VPAC2 was not detected (N.D.) in CD8 T cells as indicated.
Employment of an in vivo antigen-specific CD8 T cell adoptive transfer model to analyze VPAC1/2 expression during an infection
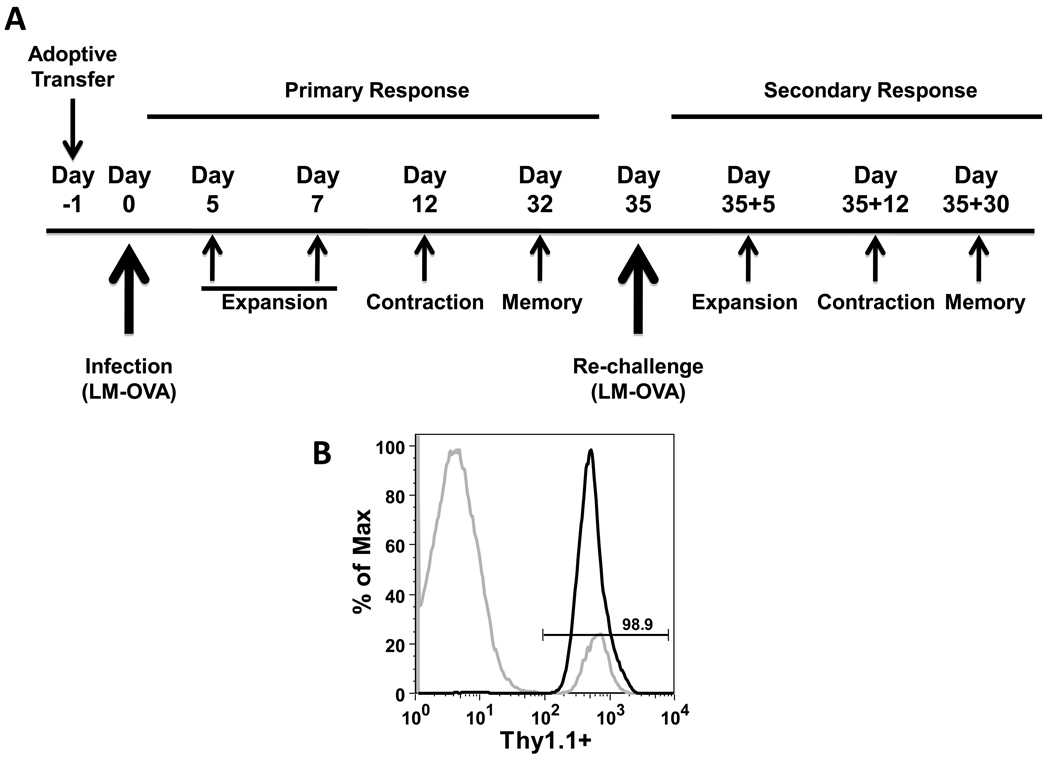
To further validate authentic downregulation of the antiproliferative VPAC1 receptor during T cell activation, and to extend these observations throughout an immune response, we decided to utilize an in vivo adoptive transfer model focusing on an antigen-specific CD8 T cell response to a bacterial infection. The decision to choose CD8 T cells for this study was primarily due to the exclusive expression of VPAC1 in CD8 T cells, and the dramatic decrease in VPAC1 mRNA expression detected after in vivo anti-CD3 treatment (Fig. 1C). To accomplish this task, we crossed CD8 OT-I transgenic mice originally developed by Carbone’s group (Hogquist et al., 1994), with congenic mice expressing Thy1.1+ (CD90.1). Approximately five hundred transgenic Thy1.1+/OT-I cells were adoptively transferred into Thy1.2 C57Bl/6J recipient mice so that they could be traced and isolated using the Thy1.1 allelic marker (Haring et al., 2005). One day after the adoptive transfer, the recipient mice were infected with a recombinant, attenuated, Listeria monocytogenes strain, lacking the actA− gene that allows cell-to-cell spread, and expressing ovalbumin (LM-OVA) (Pope et al., 2001). At various days post infection (p.i.), splenic Thy1.1+/OT-I cells were isolated during expansion, contraction and memory phases during primary and secondary infections to conduct various end-point analyses concerning the expression and function of VPAC1 and VPAC2 receptors (Fig. 2A).
Figure 2. Schematic representation of LM-OVA infection time line and example of Thy1.1+/OT-I purification.
A. One day prior to infection with LM-OVA, approximately 500 Thy1.1+/OT-I CD8 T cells were adoptively transferred by retro-orbital injection into recipient Thy1.2+ C57Bl/6J mice. Primary and secondary infections were monitored by purifying CD8 OT-I (Thy1.1+) cells at the indicated days post infection (p.i.). CD8 T cell expansion, contraction and memory phases are indicated for primary and secondary responses. B. Representative magnetic bead purification of CD8+CD90.1+ (Thy 1.1+) adoptively transferred T cells isolated from recipient mice on day 5 p.i. (Materials and Methods). Data is representative of 4 independent experiments of at least 3 mice each. A two-tailed, paired student T test was conducted to determine statistical significance (* indicates a p≤0.05).
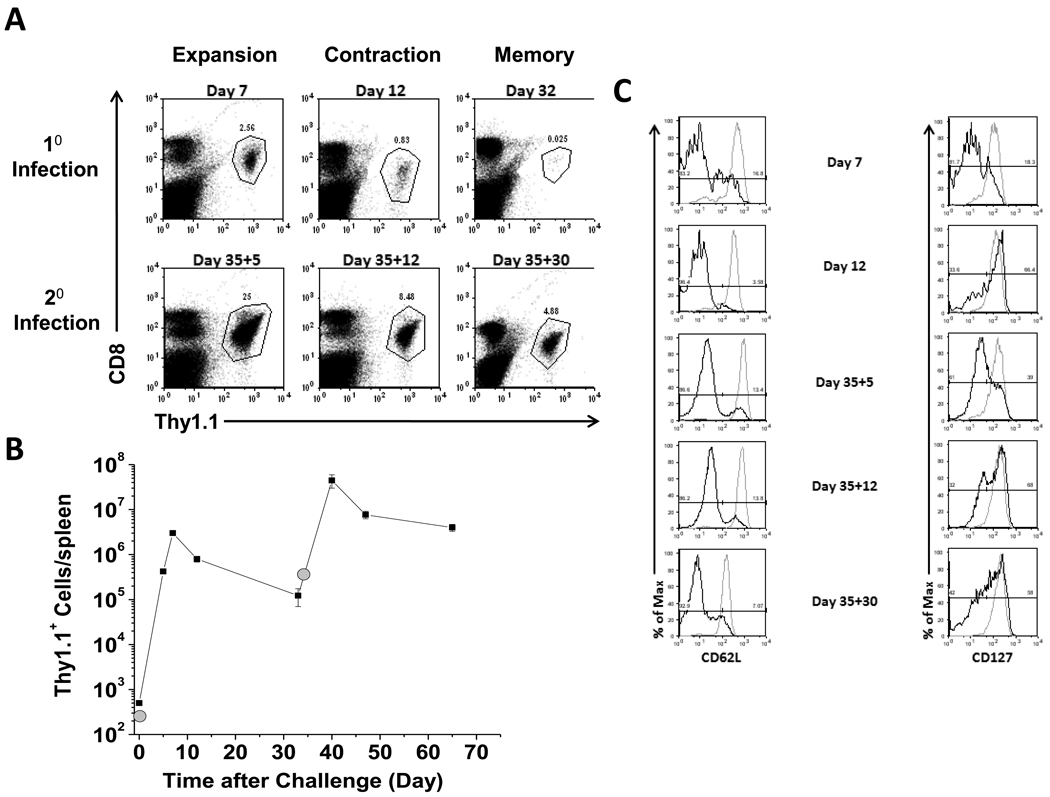
Typical purity after magnetic bead isolation of Thy1.1+/OT-I cells was ≥ 90% (Fig. 2B), and proper kinetics of proliferation of Thy1.1+/OT-I cells after infection with 1.0 × 10⁷ attenuated LM-OVA cells were observed as shown in Figure 3A . The Thy1.1+/OT-I cells logarithmically increased in number peaking at day 7 (expansion) representing 2.56% of the total splenocyte population. Contraction (day 12 p.i.) and memory cell generation (day 32 p.i.) showed a steady decline in Thy1.1+/OT-I cells representing only 0.025% of the total splenocyte population by day 32 p.i. Upon re-challenge with LM-OVA, the memory Thy1.1+/OT-I cell population quickly expanded and peaked at Day 35+5 and was approximately one log greater in cell number than the primary immune response peak (Fig. 3A and 3B). These activated primary memory Thy1.1+/OT-I cells contracted through Day 35+12 and by Day 35+30 made up 4.88% of the total splenocyte population. In addition to demonstrating proper CD8 T cell kinetics, we also assessed the expression of activation markers CD25 and CD69 (data not shown), and CD62L and CD127 (Fig. 3C). CD62L and CD127 were downregulated during expansion indicating that the cells were therefore displaying a characteristic effector phenotype (Badovinac et al., 2007). These two receptors were subsequently upregulated and re-expressed on the cell surface by Day 32 p.i. (data not shown). After re-challenge, the memory Thy1.1+/OT-I cells downregulated CD62L and CD127 markers (Day 35+5). CD127 expression returned in the secondary memory cells whereas the CD62L expression remained low (Fig. 3C), therefore resulting in a characteristic secondary memory cell phenotype (Jabbari and Harty, 2006; Jameson and Masopust, 2009). These results show that we were able to successfully transfer Thy1.1+/OT-I cells into recipient mice and demonstrate typical CD8 T cell proliferation kinetics that displayed an appropriate activation phenotype (Badovinac et al., 2007).
Figure 3. Appropriate kinetics and activation profile of adoptively transferred OT-I mice.
A. Splenocytes were collected at the indicated times p,i, that corresponded to expansion, contraction, and memory time points following primary and secondary infections. Representative dot plots are shown of anti-Thy 1.1 and anti-CD8 staining. Gate frequencies are percent positive of the total splenocyte populations. B. Total cell number of Thy.1.1+ CD8 T cells per spleen throughout primary and secondary responses represented by a line graph versus days after challenge. Gray circles indicate when mice were infected with LM-OVA. C. Histogram plots showing staining of splenocytes collected from recipient mice isolated at the indicated days p.i.. Cells were stained for two activation markers as indicated and analyzed by flow cytometry. Gray lines represent the unactivated endogenous CD8+ population, and black lines represent the Thy1.1+ CD8 T cells at the indicated day p.i.. Gate frequencies are percent positive of previously gated Thy1.1−/CD8hi cells (gray lines) or previously gated Thy1.1+/CD8+ cells (black lines). All data is representative from 2–4 independent experiments using three mice per experiment.
VPAC1 mRNA expression pattern in antigen-specific CD8 T cells responding to primary and secondary infections
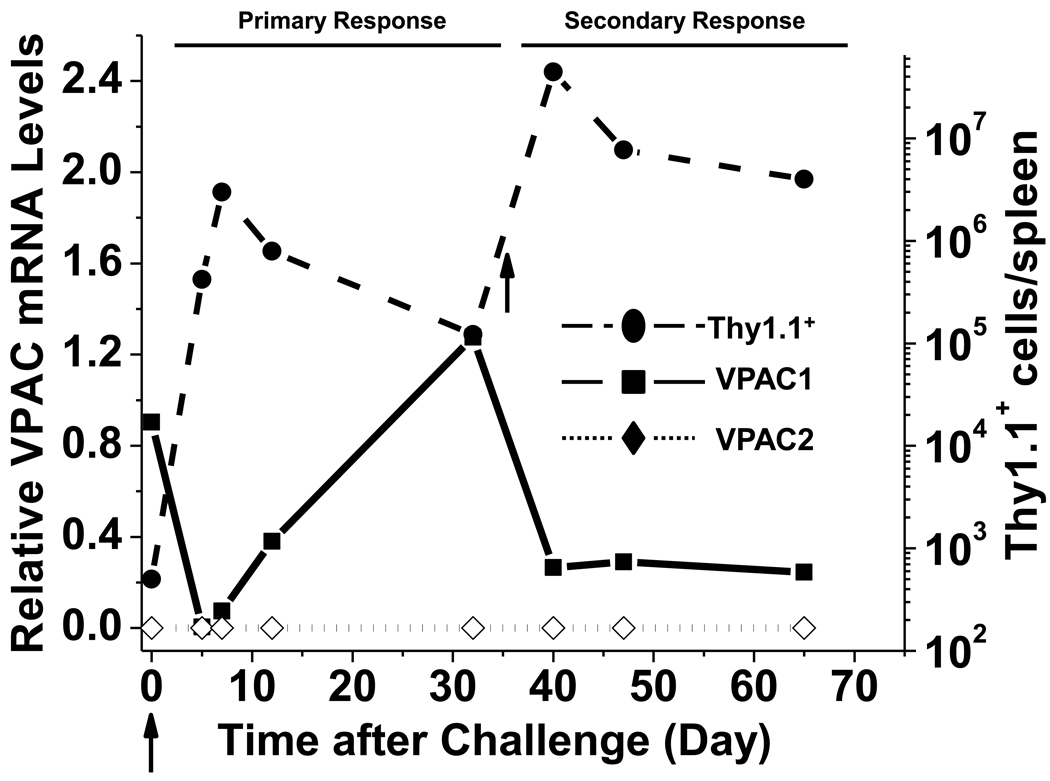
We used the OT-I in vivo model system to map the expression profile of VPAC1 and VPAC2 throughout a CD8 T cell immune response. At various time points during a primary and secondary LM-OVA infection, Thy1.1+/OT-I cells were magnetically enriched, and VPAC1 and VPAC2 expression levels were measured by qPCR. Excitingly, our results measured a 163-fold downregulation of VPAC1 mRNA levels at day 5 p.i. (Fig. 4). VPAC1 levels were slowly restored during the contraction phase (Day 12 p.i.) returning to levels detected in naïve T cells by the memory phase (Day 32 p.i.). Re-challenge with LM-OVA resulted in a similar, but more moderate downregulation (5-fold) during secondary expansion. However, in contrast to the primary response where VPAC1 levels were restored upon contraction, VPAC1 mRNA instead remained low into the secondary memory phase. The inducible VPAC2 receptor was not detected during any time points analyzed from primary or secondary infections. In summary, resting CD8 T cells appear to exclusively express VPAC1, which becomes silenced during the proliferative expansion phase and restored in primary, but not secondary, memory cells. These data make it enticing to speculate that the mechanism for VPAC1 downregulation is linked to the cells entering the cell cycle, as rapidly proliferating CD8 T cells, or secondary memory cells with significantly reduced activation thresholds (Jameson and Masopust, 2009), have 163- and 5-fold lower VPAC1 expression compared to resting, quiescent CD8 T cells.
Figure 4. Mapping of VPAC receptor expression throughout a primary and secondary CD8 T cell response.
Thy.1.1+ CD8 T cells were purified by magnetic beads (Materials and Methods) at various times p.i., and used to measure VPAC1 (square; solid black line) and VPAC2 (diamond; dotted black line) mRNA levels normalized to HPRT as assessed by qPCR. Data is representative of 2–4 independent experiments using three mice per time point per experiment. Total number of Thy.1.1+ CD8 T cells per spleen (right Y-axis) in Figure 3B is also shown (circle; dashed black line) for comparison. Arrows indicate primary and secondary infection with LM-OVA.
Functional VPAC1 receptor protein parallels mRNA silencing during CD8 T cell expansion
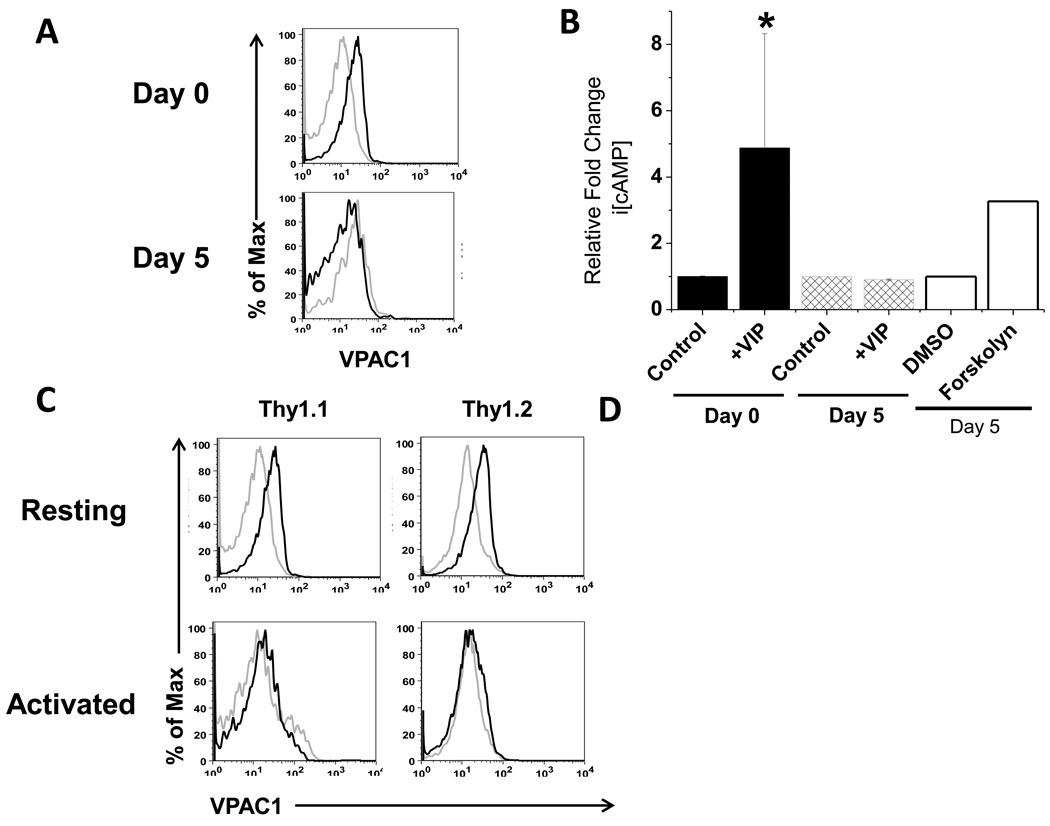
The dramatic downregulation of VPAC1 by day 5 p.i. prompted us to determine the extent to which functional VPAC1 protein was modulated. Thus, we measured VPAC1 protein by flow cytometry and its signaling potential by a competitive ELISA for i[cAMP]. Our data confirmed the presence of functional VPAC1 protein on resting, Thy1.1+/OT-I cells at day 0 that increased i[cAMP] nearly four-fold upon VIP addition. In contrast, at day 5 p.i., no detectable VPAC1 protein was measured, and exogenously added VIP ligand failed to elevate i[cAMP] levels. Furthermore, VPAC1 antibody staining showed detection of protein presented on the plasma membrane of resting endogenous CD8 T cells (CD8high), but little to no detection on endogenous CD8 T cells with reduced CD8 expression (CD8mid), which is consistent with a previously activated phenotype (Fig. 5C) (Badovinac et al., 2007; Rai et al., 2009). Based on these data, we concluded that functional VPAC1 protein on Thy1.1+/OT-I cells is removed from the cell surface by day 5 p.i., suggesting that activated, antigen-specific, CD8 T cells become unresponsive to VIP signaling during the highly proliferative expansion phase.
Figure 5. Functional VPAC1 protein levels are undetectable during peak infection.
A. Thy1.1+CD8 T cells adoptively transferred into Thy1.2+ recipient mice (day 0) and splenocytes from day 5 p.i. were stained with rabbit serum (grey line) and anti-mVPAC1 pAb (black line). Data shown was previously gated on CD8+/Thy1.1+ cells. Representative histogram plots are shown from two independent experiments with similar data using at least three mice per experiment. B. Day 0 and day 5 p.i. Thy1.1+ CD8 T cells were treated for 15 minutes with 10−6 M VIP ligand or vehicle control (water). Forskolin (50 uM) and vehicle control (DMSO) were used as positive and negative controls with day 5 p.i. cells. Cells were assayed directly using a competitive cAMP ELISA (Materials and Methods). A two-tailed, paired student T test was conducted to determine statistical significance (* indicates a p≤0.05 for day 0, vehicle control versus +VIP). Data is presented as averages +/−SEM from two independent experiments. C. Cells were gated on CD8+/Thy1.1 or Thy1.2, and incubated anti-CD44 and rabbit serum (grey line) or anti-mVPAC1 pAb (black line). Protein expression was compared between resting (CD44low/CD8high) and activated (CD44high/CD8mid) Thy1.1+ versus Thy1.2+ CD8+ T cells.
Co-administration of VIP suppresses the magnitude of antigen-specific CD8 T cell expansion
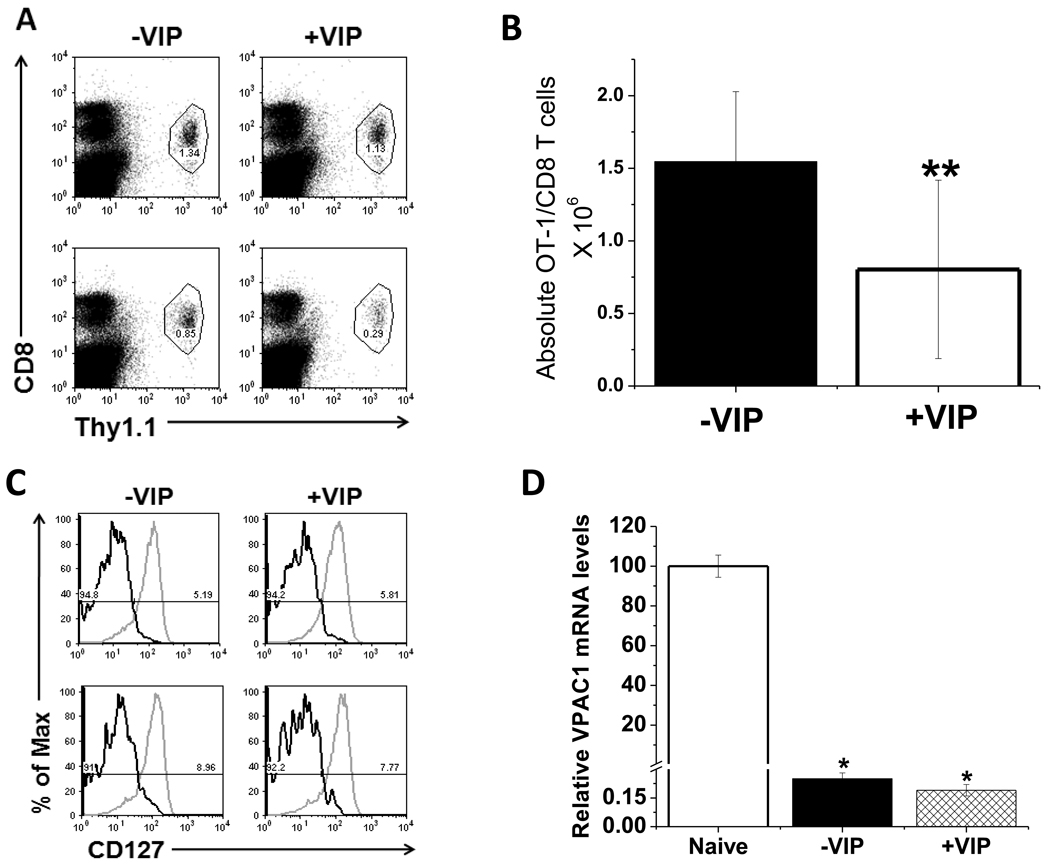
The present study supports a mechanism by which expanding, antigen-specific CD8 T cells become unresponsive to the VIP ligand by downregulating VPAC1 expression. This observation suggested to us that VIP may suppress the extent of CD8 T cell expansion, if it were present within the microenvironment during antigen presenting cell activation. To test this hypothesis, we co-administered VIP with LM-OVA and measured the percentage of Thy1.1+/OT-I cells per spleen at day 5 post infection. Figure 6A shows a reduction antigen-specific CD8 cells in mice treated with VIP. The decrease in the absolute number of OT-I/CD8 cells is shown in Fig. 6B. When we evaluated the activation markers (Fig. 6C) or VPAC1 mRNA(Fig. 6D), VIP treatment had little to no effect on their expression levels in comparison to the recipient mice treated with LM-OVA+ PBS. These data suggest that the VIP neuropeptide may play a role in suppressing the extent of CD8 T cell expansion through an unknown mechanism.
Figure 6. Exogenously administered VIP suppresses CD8 T cell expansion.
Thy1.1+ CD8 T cells were adoptively transferred into recipient mice 1 day prior to LM-OVA infection +/− administration of 5 nmols of VIP by i.v. injection. Mice were sacrificed on day 5 p.i. A. The percentage of gated Thy1.1+ CD8 T cells from mice receiving VIP (+VIP) versus PBS vehicle control (−VIP) were measured by flow cytometry. Dot plots are representative of four mice analyzed in two independent experiments (top row = 1st experiment, bottom row = 2nd experiment). Gate frequencies are of total splenocyte population. B. Total numbers of OT-I/CD8 T cells −VIP and +VIP treatment at day 5 p.i.. A two-tailed, paired student T test was conducted to determine statistical significance (** indicates a p≤0.1). C. CD127 expression on OT-I/CD8 T cells treated with LM-OVA −/+VIP at 5 days p.i. is shown. Grey lines represent isotype control, and black lines represent anti-CD127 staining from two independent experiments with four mice each (n=1 top, n=2 bottom). D. VPAC1 mRNA levels normalized to HPRT (day 5 p.i.). qPCR data is presented as averages +/− SEM.
Discussion
In this study, we have extended the fundamental knowledge base, collected initially by in vitro studies, of VIP receptor expression changes in T lymphocytes (Jiang et al., 1998; Lara-Marquez et al., 2001; Vomhof-DeKrey and Dorsam, 2008). To accomplish this, we mapped the expression profile of VPAC1 and VPAC2 mRNA during primary and secondary Listeria monocytogenes infections. To our knowledge, this is the first study to quantitatively measure VIP receptor mRNA levels throughout the expansion, contraction and memory phases of an in vivo CD8 immune response.
Herein, we show that both CD4 and CD8 resting T cells from C57Bl/6J mice expressed VPAC1. While VPAC1 levels were much higher than VPAC2 in CD4 cells, no VPAC2 was detected in resting CD8 cells (Figures 1B and 1C). These data are similar to previous reports which observed high levels of VPAC1 in both human and mouse T cells as assessed by Northern analysis (Sreedharan et al., 1995), RNase Protection (Johnson et al., 1996), traditional RT-PCR (Jiang et al., 1998) and qRT-PCR (Dorsam, 2010) (Lara-Marquez et al., 2001). In addition, our results show that readily detectable levels of VPAC1 in C57Bl/6 is consistent with VPAC1 levels reported in Balb/C mouse strains (Jiang et al., 1998; Qian et al., 2001). In contrast, there have been discrepancies regarding VPAC2 expression in resting T cells. Using splenic Balb/c CD4 and CD8 T cells, one study detected VPAC2 expression, whereas, another report found VPAC2 undetectable (Jiang et al., 1998; Qian et al., 2001). Different experimental procedures might explain these results, and/or the age of the mice used for the studies, as concluded by the authors who failed to detect VPAC2 expression. We showed that VPAC2 is not detected in C57Bl/6 CD8 T cells; however, the expression of this receptor has been detected in human T lymphocytes (Lara-Marquez et al., 2001). This species discrepancy may be due to the fact that human T cells are isolated from peripheral blood, and mouse T cells are isolated from the spleen (Vomhof-DeKrey et al., 2008). Nonetheless, we can conclude that VPAC1 is the predominant VIP receptor expressed on resting T lymphocytes from C57Bl/6J mice, and CD8 T cells appear to exclusively express VPAC1.
To date, VPAC1 has been coined the constitutive VIP receptor in T lymphocytes as in vitro anti-CD3/CD28 treatment does not change its mRNA expression as assessed by semi-quantitative RT-PCR (Delgado et al., 1996; Delgado et al., 2004). Whereas, VPAC2 is referred to as the inducible VIP receptor as some in vitro and in vivo T cell activation treatments cause an elevation of its steady-state mRNA (Delgado et al., 1996; Delgado et al., 2004). However, the present study has gathered in vivo evidence to strongly challenge these categorized descriptions. Both polyclonal T cell activation induced by retro-orbital administration of anti-CD3, and in vivo infection with a Th1 pathogen revealed two important findings that we propose can be used to more accurately describe the expression profile of VIP receptors during T cell signaling (e.g. activation). First, VPAC1 mRNA was significantly downregulated by polyclonal activation (≈90%), and VPAC1 mRNA and protein were essentially silenced during the expansion phase of antigen-specific CD8 T cells (99.5%). These data suggest that the expression plasticity of VPAC1 is much more dynamic during T cell activation than originally thought. O’Doriso’s group has observed a similar downregulation of human VPAC1 mRNA in anti-CD3/PMA treated blood CD4 T cells that was inversely related to the magnitude of IL-2 expression (Lara-Marquez et al., 2001). Therefore, we propose VPAC1 should only be referred to as the constitutive VIP receptor in resting T cells.
Regarding VPAC2 expression, our data demonstrated that this receptor was consistently undetectable during in vitro and in vivo CD8 T cell activation (and throughout primary and secondary infections), and VPAC2 expression detected in CD4 T cells did not increase, but rather decreased after polyclonal activation. Such a downregulation in VPAC2 mRNA has also been observed by Delgado et al., albeit using a semi-quantitative RT-PCR method (Jiang et al., 1998). In contrast, Voice et al. showed VPAC2 upregulation at the mRNA level in CD4 T cells when treated in culture with anti-CD3/CD28, but not until 96 hours post treatment (Voice et al., 2004). Furthermore, Metwali et al. demonstrated that VPAC2 is upregulated in activated T cells within a granuloma, but not in resting or anti-CD3/CD28 treated splenic T cells (Metwali et al., 2000), and strengthens the argument that VPAC2 upregulation is dependent on in vivo microenvironment, rather than activation status alone. Therefore, it is reasonable to suggest that VPAC2 is an inducible receptor in activated CD4 T cells, or during a Th2 polarized immune reaction, but not in antigen-specific activated CD8 T cells responding to a Th1 pathogen.
We originally sought to determine which VIP receptor directly transmits VIP effects in activated CD8 T cells in vivo. However, after showing that VPAC2 was undetectable and that VPAC1 was transiently silenced, we demonstrated that this population is ostensibly unresponsive to VIP. We propose that the removal of functional, anti-proliferative VPAC1 protein from proliferating, highly activated cells is essential for optimal T cell response kinetics. In addition, high VPAC1 expression both prior to and after resolution of a primary infection presents a strong argument for VIP/VPAC1 signaling to limit clonal expansion and activation in CD8 T cells. A similar suggestion was made by O’Dorisio’s group for CD4 T cells (Lara-Marquez et al., 2001).
Co-administration of VIP with LM-OVA resulted in suppression of CD8 T cell expansion. The mechanism by which this effect is mediated is currently unknown, and several possible hypotheses are suggested. One mechanism could be through VPAC1 signaling on the CD8 T cells directly. These direct VIP effects may decrease CD8 T cell expansion by modulating proliferation, apoptosis and chemotaxis. Regarding possible indirect effects, VIP may cause downregulation of co-stimulatory receptors on antigen presenting cells (Delgado et al., 2000), downregulation of proinflammatory and signal 3 cytokine expression (Delgado and Ganea, 2000a; Delgado et al., 1999b) or possibly cause increases regulatory T cells (Pozo et al., 2009). Thus, it is a major future goal to investigate the mechanism(s) by which VPAC1 is downregulated and VIP suppresses CD8 T cell expansion.
Lastly, we showed that VPAC1 levels in resting and primary memory cells were comparable, while secondary memory cells had five fold less VPAC1 expression. This intriguing discovery prompted us to hypothesize that repeated exposure of a memory cell to an antigen may alter its sensitivity to VIP, and consequently alter trafficking to immune compartments. This supposition is put forth due to two main reasons. First, VPAC1 has been shown to induce chemotaxis in resting T cells by in vitro and in vivo analyses (Johnston et al., 1994; Ottaway, 1984). Second, the observed in vivo VPAC1 expression profile in primary and secondary infections paralleled that of the chemotactic receptor, L-selectin (CD62L). L-selectin is paramount in allowing T cell entry into lymph nodes, and recurring activation downregulates CD62L expression preventing further trafficking into the lymph system (Lefrancois, 2006). Perhaps VPAC1 functions in a similar capacity to L-selection, such that primary, but not secondary, memory CD8 T cells will actively be recruited to compartments with high density of VIP+ nerves, including the mucosa associated lymphoid tissues of the pulmonary and gastrointestinal systems.
In conclusion, we have demonstrated that 1) the downregulation in VPAC1 expression is inversely correlated with CD8 T cell expansion, 2) at the activation peak, CD8 T cells are unresponsive to VIP, 3) VIP effects on CD8 T cell biology are most likely mediated exclusively by VPAC1, and 4) VPAC1 levels in resting and primary memory cells are five-fold higher than those measured in secondary memory T cells. Elucidating the mechanism(s) by which VPAC1 receptors regulate CD8 T cell expansion will significantly contribute to the field of neuroimmunology by increasing our understanding of the role of this neuropeptide receptor in immunity.
Acknowledgements
We wish to thank Dr. H. Shen for a stock of the act A− Listeria monocytogenes-OVA bacteria. This research was supported by a grant from the National Institutes of Health (NIH) K01 DK064828 from the National Institutes of Diabetes, Digestive and Kidney Diseases (NIDDK) (to G.P.D., principal investigator). This publication was also made possible by the NIH grant P20 RR015566-07 from the National Center of Research Resources (NCRR) (to G.P.D., Co-Investigator). Its contents are solely the responsibility of the authors and do not necessarily represent the official view of NCRR or NIH. This research was conducted, in part, by use of the Core Biology Facility at North Dakota State University.
Footnotes
Publisher's Disclaimer: This is a PDF file of an unedited manuscript that has been accepted for publication. As a service to our customers we are providing this early version of the manuscript. The manuscript will undergo copyediting, typesetting, and review of the resulting proof before it is published in its final citable form. Please note that during the production process errors may be discovered which could affect the content, and all legal disclaimers that apply to the journal pertain.
References
- Badovinac VP, Haring JS, Harty JT. Initial T cell receptor transgenic cell precursor frequency dictates critical aspects of the CD8(+) T cell response to infection. Immunity. 2007;26:827–841. doi: 10.1016/j.immuni.2007.04.013. [DOI] [PMC free article] [PubMed] [Google Scholar]
- Bellinger DL, Lorton D, Brouxhon S, Felten S, Felten DL. The significance of vasoactive intestinal polypeptide (VIP) in immunomodulation. Adv Neuroimmunol. 1996;6:5–27. doi: 10.1016/s0960-5428(96)00008-3. [DOI] [PubMed] [Google Scholar]
- Bellinger DL, Lorton D, Horn L, Brouxhon S, Felten SY, Felten DL. Vasoactive intestinal polypeptide (VIP) innervation of rat spleen, thymus, and lymph nodes. Peptides. 1997;18:1139–1149. doi: 10.1016/s0196-9781(97)00075-2. [DOI] [PubMed] [Google Scholar]
- Bemelmans MH, Abramowicz D, Gouma DJ, Goldman M, Buurman WA. In vivo T cell activation by anti-CD3 monoclonal antibody induces soluble TNF receptor release in mice. Effects of pentoxifylline, methylprednisolone, anti-TNF, and anti-IFN-gamma antibodies. J Immunol. 1994;153:499–506. [PubMed] [Google Scholar]
- D'Souza WN, Chang CF, Fischer AM, Li M, Hedrick SM. The Erk2 MAPK regulates CD8 T cell proliferation and survival. J Immunol. 2008;181:7617–7629. doi: 10.4049/jimmunol.181.11.7617. [DOI] [PMC free article] [PubMed] [Google Scholar]
- Delgado M, Ganea D. Inhibition of IFN-gamma-induced janus kinase-1-STAT1 activation in macrophages by vasoactive intestinal peptide and pituitary adenylate cyclase-activating polypeptide. J Immunol. 2000a;165:3051–3057. doi: 10.4049/jimmunol.165.6.3051. [DOI] [PubMed] [Google Scholar]
- Delgado M, Ganea D. Vasoactive intestinal peptide and pituitary adenylate cyclase-activating polypeptide inhibit T cell-mediated cytotoxicity by inhibiting Fas ligand expression. J Immunol. 2000b;165:114–123. doi: 10.4049/jimmunol.165.1.114. [DOI] [PubMed] [Google Scholar]
- Delgado M, Leceta J, Sun W, Gomariz RP, Ganea D. VIP and PACAP induce shift to a Th2 response by upregulating B7.2 expression. Ann N Y Acad Sci. 2000;921:68–78. doi: 10.1111/j.1749-6632.2000.tb06952.x. [DOI] [PubMed] [Google Scholar]
- Delgado M, Martinez C, Johnson MC, Gomariz RP, Ganea D. Differential expression of vasoactive intestinal peptide receptors 1 and 2 (VIP-R1 and VIP-R2) mRNA in murine lymphocytes. J Neuroimmunol. 1996;68:27–38. doi: 10.1016/0165-5728(96)00063-x. [DOI] [PubMed] [Google Scholar]
- Delgado M, Martinez C, Leceta J, Gomariz RP. Vasoactive intestinal peptide in thymus: synthesis, receptors and biological actions. Neuroimmunomodulation. 1999a;6:97–107. doi: 10.1159/000026369. [DOI] [PubMed] [Google Scholar]
- Delgado M, Munoz-Elias EJ, Gomariz RP, Ganea D. VIP and PACAP inhibit IL-12 production in LPS-stimulated macrophages. Subsequent effect on IFNgamma synthesis by T cells. J Neuroimmunol. 1999b;96:167–181. doi: 10.1016/s0165-5728(99)00023-5. [DOI] [PubMed] [Google Scholar]
- Delgado M, Pozo D, Ganea D. The significance of vasoactive intestinal peptide in immunomodulation. Pharmacol Rev. 2004;56:249–290. doi: 10.1124/pr.56.2.7. [DOI] [PubMed] [Google Scholar]
- Dickson L, Finlayson K. VPAC and PAC receptors: From ligands to function. Pharmacol Ther. 2009;121:294–316. doi: 10.1016/j.pharmthera.2008.11.006. [DOI] [PubMed] [Google Scholar]
- Dorsam ST, Vomhof-Dekrey E, Hermann RJ, Haring JS, Van der Steen T, Wilkerson E, Boskovic G, Denvir J, Dementieva Y, Primerano D, Dorsam GP. Identification of the early VIP-regulated transcriptome and its associated, interactome in resting and activated murine CD4 T cells. Mol Immunol. 47:1181–1194. doi: 10.1016/j.molimm.2010.01.003. [DOI] [PMC free article] [PubMed] [Google Scholar]
- Haring JS, Corbin GA, Harty JT. Dynamic regulation of IFN-gamma signaling in antigen-specific CD8+ T cells responding to infection. J Immunol. 2005;174:6791–6802. doi: 10.4049/jimmunol.174.11.6791. [DOI] [PubMed] [Google Scholar]
- Hirsch R, Gress RE, Pluznik DH, Eckhaus M, Bluestone JA. Effects of in vivo administration of anti-CD3 monoclonal antibody on T cell function in mice. II. In vivo activation of T cells. J Immunol. 1989;142:737–743. [PubMed] [Google Scholar]
- Hogquist KA, Jameson SC, Heath WR, Howard JL, Bevan MJ, Carbone FR. T cell receptor antagonist peptides induce positive selection. Cell. 1994;76:17–27. doi: 10.1016/0092-8674(94)90169-4. [DOI] [PubMed] [Google Scholar]
- Jabbari A, Harty JT. Secondary memory CD8+ T cells are more protective but slower to acquire a central-memory phenotype. J Exp Med. 2006;203:919–932. doi: 10.1084/jem.20052237. [DOI] [PMC free article] [PubMed] [Google Scholar]
- Jameson SC, Masopust D. Diversity in T cell memory: an embarrassment of riches. Immunity. 2009;31:859–871. doi: 10.1016/j.immuni.2009.11.007. [DOI] [PMC free article] [PubMed] [Google Scholar]
- Jiang X, Wang HY, Yu J, Ganea D. VIP1 and VIP2 receptors but not PVR1 mediate the effect of VIP/PACAP on cytokine production in T lymphocytes. Ann N Y Acad Sci. 1998;865:397–407. doi: 10.1111/j.1749-6632.1998.tb11204.x. [DOI] [PubMed] [Google Scholar]
- Johnson MC, McCormack RJ, Delgado M, Martinez C, Ganea D. Murine T-lymphocytes express vasoactive intestinal peptide receptor 1 (VIP-R1) mRNA. J Neuroimmunol. 1996;68:109–119. doi: 10.1016/0165-5728(96)00085-9. [DOI] [PubMed] [Google Scholar]
- Johnston JA, Taub DD, Lloyd AR, Conlon K, Oppenheim JJ, Kevlin DJ. Human T lymphocyte chemotaxis and adhesion induced by vasoactive intestinal peptide. J Immunol. 1994;153:1762–1768. [PubMed] [Google Scholar]
- Lara-Marquez M, O'Dorisio M, O'Dorisio T, Shah M, Karacay B. Selective gene expression and activation-dependent regulation of vasoactive intestinal peptide receptor type 1 and type 2 in human T cells. J Immunol. 2001;166:2522–2530. doi: 10.4049/jimmunol.166.4.2522. [DOI] [PubMed] [Google Scholar]
- Lara-Marquez ML, O'Dorisio MS, Karacay B. Vasoactive intestinal peptide (VIP) receptor type 2 (VPAC2) is the predominant receptor expressed in human thymocytes. Ann N Y Acad Sci. 2000;921:45–54. doi: 10.1111/j.1749-6632.2000.tb06950.x. [DOI] [PubMed] [Google Scholar]
- Lefrancois L. Development, trafficking, and function of memory T-cell subsets. Immunol Rev. 2006;211:93–103. doi: 10.1111/j.0105-2896.2006.00393.x. [DOI] [PubMed] [Google Scholar]
- Metwali A, Blum AM, Li J, Elliott DE, Weinstock JV. IL-4 regulates VIP receptor subtype 2 mRNA (VPAC2) expression in T cells in murine schistosomiasis. FASEB J. 2000;14:948–954. doi: 10.1096/fasebj.14.7.948. [DOI] [PubMed] [Google Scholar]
- Metwali A, Elliott D, Blum AM, Li J, Sandor M, Lynch R, Noben-Trauth N, Weinstock JV. The granulomatous response in murine Schistosomiasis mansoni does not switch to Th1 in IL-4-deficient C57BL/6 mice. J Immunol. 1996;157:4546–4553. [PubMed] [Google Scholar]
- Ottaway CA. In vitro alteration of receptors for vasoactive intestinal peptide changes the in vivo localization of mouse T cells. J Exp Med. 1984;160:1054–1069. doi: 10.1084/jem.160.4.1054. [DOI] [PMC free article] [PubMed] [Google Scholar]
- Ottaway CA, Greenberg GR. Interaction of vasoactive intestinal peptide with mouse lymphocytes: specific binding and the modulation of mitogen responses. J Immunol. 1984;132:417–423. [PubMed] [Google Scholar]
- Pincus DW, DiCicco-Bloom EM, Black IB. Vasoactive intestinal peptide regulates mitosis, differentiation and survival of cultured sympathetic neuroblasts. Nature. 1990;343:564–567. doi: 10.1038/343564a0. [DOI] [PubMed] [Google Scholar]
- Pope C, Kim SK, Marzo A, Masopust D, Williams K, Jiang J, Shen H, Lefrancois L. Organ-specific regulation of the CD8 T cell response to Listeria monocytogenes infection. J Immunol. 2001;166:3402–3409. doi: 10.4049/jimmunol.166.5.3402. [DOI] [PubMed] [Google Scholar]
- Pozo D, Anderson P, Gonzalez-Rey E. Induction of alloantigen-specific human T regulatory cells by vasoactive intestinal Peptide. J Immunol. 2009;183:4346–4359. doi: 10.4049/jimmunol.0900400. [DOI] [PubMed] [Google Scholar]
- Qian BF, Hammarstrom ML, Danielsson A. Differential expression of vasoactive intestinal polypeptide receptor 1 and 2 mRNA in murine intestinal T lymphocyte subtypes. J Neuroendocrinol. 2001;13:818–825. doi: 10.1046/j.1365-2826.2001.00703.x. [DOI] [PubMed] [Google Scholar]
- Rai D, Pham NL, Harty JT, Badovinac VP. Tracking the total CD8 T cell response to infection reveals substantial discordance in magnitude and kinetics between inbred and outbred hosts. J Immunol. 2009;183:7672–7681. doi: 10.4049/jimmunol.0902874. [DOI] [PMC free article] [PubMed] [Google Scholar]
- Said SI. Candidate hormones of the gut. V. Vasoactive intestinal peptide (VIP) Gastroenterology. 1974;67:735–737. [PubMed] [Google Scholar]
- Said SI, Mutt V. Polypeptide with broad biological activity: isolation from small intestine. Science. 1970;169:1217–1218. doi: 10.1126/science.169.3951.1217. [DOI] [PubMed] [Google Scholar]
- Sharma V, Delgado M, Ganea D. Granzyme B, a new player in activation-induced cell death, is down-regulated by vasoactive intestinal peptide in Th2 but not Th1 effectors. J Immunol. 2006;176:97–110. doi: 10.4049/jimmunol.176.1.97. [DOI] [PubMed] [Google Scholar]
- Smalley SG, Barrow PA, Foster N. Immunomodulation of innate immune responses by vasoactive intestinal peptide (VIP): its therapeutic potential in inflammatory disease. Clin Exp Immunol. 2009;157:225–234. doi: 10.1111/j.1365-2249.2009.03956.x. [DOI] [PMC free article] [PubMed] [Google Scholar]
- Sreedharan SP, Huang JX, Cheung MC, Goetzl EJ. Structure, expression, and chromosomal localization of the type I human vasoactive intestinal peptide receptor gene. Proc Natl Acad Sci U S A. 1995;92:2939–2943. doi: 10.1073/pnas.92.7.2939. [DOI] [PMC free article] [PubMed] [Google Scholar]
- Vassiliou E, Jiang X, Delgado M, Ganea D. TH2 lymphocytes secrete functional VIP upon antigen stimulation. Arch Physiol Biochem. 2001;109:365–368. doi: 10.1076/apab.109.4.365.4245. [DOI] [PubMed] [Google Scholar]
- Voice J, Donnelly S, Dorsam G, Dolganov G, Paul S, Goetzl EJ. c-Maf and JunB mediation of Th2 differentiation induced by the type 2 G protein-coupled receptor (VPAC2) for vasoactive intestinal peptide. J Immunol. 2004;172:7289–7296. doi: 10.4049/jimmunol.172.12.7289. [DOI] [PubMed] [Google Scholar]
- Voice JK, Dorsam G, Lee H, Kong Y, Goetzl EJ. Allergic diathesis in transgenic mice with constitutive T cell expression of inducible vasoactive intestinal peptide receptor. FASEB J. 2001;15:2489–2496. doi: 10.1096/fj.01-0671com. [DOI] [PubMed] [Google Scholar]
- Vomhof-DeKrey EE, Dorsam GP. Stimulatory and suppressive signal transduction regulates vasoactive intestinal peptide receptor-1 (VPAC-1) in primary mouse CD4 T cells. Brain Behav Immun. 2008;22:1024–1031. doi: 10.1016/j.bbi.2008.04.006. [DOI] [PMC free article] [PubMed] [Google Scholar]
- Vomhof-DeKrey EE, Hermann RJ, Palmer MF, Benton KD, Sandy AR, Dorsam ST, Dorsam GP. TCR signaling and environment affect vasoactive intestinal peptide receptor-1 (VPAC-1) expression in primary mouse CD4 T cells. Brain Behav Immun. 2008;22:1032–1040. doi: 10.1016/j.bbi.2008.04.005. [DOI] [PMC free article] [PubMed] [Google Scholar]
- Xin Z, Tang H, Ganea D. Vasoactive intestinal peptide inhibits interleukin (IL)-2 and IL-4 production in murine thymocytes activated via the TCR/CD3 complex. J Neuroimmunol. 1994;54:59–68. doi: 10.1016/0165-5728(94)90231-3. [DOI] [PubMed] [Google Scholar]


