Abstract
The interpretation of forensic fingerprint evidence relies on the expertise of latent print examiners. The National Research Council of the National Academies and the legal and forensic sciences communities have called for research to measure the accuracy and reliability of latent print examiners’ decisions, a challenging and complex problem in need of systematic analysis. Our research is focused on the development of empirical approaches to studying this problem. Here, we report on the first large-scale study of the accuracy and reliability of latent print examiners’ decisions, in which 169 latent print examiners each compared approximately 100 pairs of latent and exemplar fingerprints from a pool of 744 pairs. The fingerprints were selected to include a range of attributes and quality encountered in forensic casework, and to be comparable to searches of an automated fingerprint identification system containing more than 58 million subjects. This study evaluated examiners on key decision points in the fingerprint examination process; procedures used operationally include additional safeguards designed to minimize errors. Five examiners made false positive errors for an overall false positive rate of 0.1%. Eighty-five percent of examiners made at least one false negative error for an overall false negative rate of 7.5%. Independent examination of the same comparisons by different participants (analogous to blind verification) was found to detect all false positive errors and the majority of false negative errors in this study. Examiners frequently differed on whether fingerprints were suitable for reaching a conclusion.
Keywords: biometrics, error analysis
The interpretation of forensic fingerprint evidence relies on the expertise of latent print examiners. The accuracy of decisions made by latent print examiners has not been ascertained in a large-scale study, despite over one hundred years of the forensic use of fingerprints. Previous studies (1–4) are surveyed in ref. 5. Recently, there has been increased scrutiny of the discipline resulting from publicized errors (6) and a series of court admissibility challenges to the scientific basis of fingerprint evidence (e.g., 7–9). In response to the misidentification of a latent print in the 2004 Madrid bombing (10), a Federal Bureau of Investigation (FBI) Laboratory review committee evaluated the scientific basis of friction ridge examination. That committee recommended research, including the study described in this report: a test of the performance of latent print examiners (11). The need for evaluations of the accuracy of fingerprint examination decisions has also been underscored in critiques of the forensic sciences by the National Research Council (NRC, ref. 12) and others (e.g., refs. 13–16).
Background
Latent prints (“latents”) are friction ridge impressions (fingerprints, palmprints, or footprints) left unintentionally on items such as those found at crime scenes (SI Appendix, Glossary). Exemplar prints (“exemplars”), generally of higher quality, are collected under controlled conditions from a known subject using ink on paper or digitally with a livescan device (17). Latent print examiners compare latents to exemplars, using their expertise rather than a quantitative standard to determine if the information content is sufficient to make a decision. Latent print examination can be complex because latents are often small, unclear, distorted, smudged, or contain few features; can overlap with other prints or appear on complex backgrounds; and can contain artifacts from the collection process. Because of this complexity, experts must be trained in working with the various difficult attributes of latents.
During examination, a latent is compared against one or more exemplars. These are generally collected from persons of interest in a particular case, persons with legitimate access to a crime scene, or obtained by searching the latent against an Automated Fingerprint Identification System (AFIS), which is designed to select from a large database those exemplars that are most similar to the latent being searched. For latent searches, an AFIS only provides a list of candidate exemplars; comparison decisions must be made by a latent print examiner. Exemplars selected by an AFIS are far more likely to be similar to the latent than exemplars selected by other means, potentially increasing the risk of examiner error (18).
The prevailing method for latent print examination is known as analysis, comparison, evaluation, and verification (ACE-V) (19, 20). The ACE portion of the process results in one of four decisions: the analysis decision of no value (unsuitable for comparison); or the comparison/evaluation decisions of individualization (from the same source), exclusion (from different sources), or inconclusive. The Scientific Working Group on Friction Ridge Analysis, Study and Technology guidelines for operational procedures (21) require verification for individualization decisions, but verification is optional for exclusion or inconclusive decisions. Verification may be blind to the initial examiner’s decision, in which case all types of decisions would need to be verified. ACE-V has come under criticism by some as being a general approach that is underspecified (e.g., refs. 14 and 15).
Latent-exemplar image pairs collected under controlled conditions for research are known to be mated (from the same source) or nonmated (from different sources). An individualization decision based on mated prints is a true positive, but if based on nonmated prints, it is a false positive (error); an exclusion decision based on mated prints is a false negative (error), but is a true negative if based on nonmated prints. The term “error” is used in this paper only in reference to false positive and false negative conclusions when they contradict known ground truth. No such absolute criteria exist for judging whether the evidence is sufficient to reach a conclusion as opposed to making an inconclusive or no-value decision. The best information we have to evaluate the appropriateness of reaching a conclusion is the collective judgments of the experts. Various approaches have been proposed to define sufficiency in terms of objective minimum criteria (e.g., ref. 22), and research is ongoing in this area (e.g., ref. 23). Our study is based on a black box approach, evaluating the examiners’ accuracy and consensus in making decisions rather than attempting to determine or dictate how those decisions are made (11, 24).
Study Description
This study is part of a larger research effort to understand the accuracy of examiner conclusions, the level of consensus among examiners on decisions, and how the quantity and quality of image features relate to these outcomes. Key objectives of this study were to determine the frequency of false positive and false negative errors, the extent of consensus among examiners, and factors contributing to variability in results. We designed the study to enable additional exploratory analyses and gain insight in support of the larger research effort.
There is substantial variability in the attributes of latent prints, in the capabilities of latent print examiners, in the types of casework received by agencies, and the procedures used among agencies. Average measures of performance across this heterogeneous population are of limited value (25)—but do provide insight necessary to understand the problem and scope future work. Furthermore, there are currently no means by which all latent print examiners in the United States could be enumerated or used as the basis for sampling: A representative sample of latent print examiners or casework is impracticable.
To reduce the problem of heterogeneity, we limited our scope to a study of performance under a single, operationally common scenario that would yield relevant results. This study evaluated examiners at the key decision points during analysis and evaluation. Operational latent print examination processes may include additional steps, such as examination of original evidence or paper fingerprint cards, review of multiple exemplars from a subject, consultation with other examiners, revisiting difficult comparisons, verification by another examiner, and quality assurance review. These steps are implemented to reduce the possibility of error.
Ideally, a study would be conducted in which participants were not aware that they were being tested. The practicality of such an approach even within a single organization would depend on the type of casework. Fully electronic casework could allow insertion of test data into actual casework, but this may be complex to the point of infeasibility for agencies in which most examinations involve physical evidence, especially when chain-of-custody issues are considered. Combining results among multiple agencies with heterogeneous procedures and types of casework would be problematic.
In order to get a broad cross-section of the latent print examiner community, participation was open to practicing latent print examiners from across the fingerprint community. A total of 169 latent print examiners participated; most were volunteers, while the others were encouraged or required to participate by their employers. Participants were diverse with respect to organization, training history, and other factors. The latent print examiners were generally highly experienced: Median experience was 10 y, and 83% were certified as latent print examiners. More detailed descriptions of participants, fingerprint data, and study procedures are included in SI Appendix, Materials and Methods.
The fingerprint data included 356 latents, from 165 distinct fingers from 21 people, and 484 exemplars. These were combined to form 744 distinct latent-exemplar image pairs. There were 520 mated and 224 nonmated pairs. The number of fingerprint pairs used in the study, and the number of examiners assigned to each pair, were selected as a balance between competing research priorities: Measuring consensus and variability among examiners required multiple examiners for each image pair, while incorporating a broad range of fingerprints for measuring image-specific effects required a large number of images.
We sought diversity in fingerprint data, within a range typical of casework. Subject matter experts selected the latents and mated exemplars from a much larger pool of images to include a broad range of attributes and quality. Latents of low quality were included in the study to evaluate the consensus among examiners in making value decisions about difficult latents. The exemplar data included a larger proportion of poor-quality exemplars than would be representative of exemplars from the FBI’s Integrated AFIS (IAFIS) (SI Appendix, Table S4). Image pairs were selected to be challenging: Mated pairs were randomly selected from the multiple latents and exemplars available for each finger position; nonmated pairs were based on difficult comparisons resulting from searches of IAFIS, which includes exemplars from over 58 million persons with criminal records, or 580 million distinct fingers (SI Appendix, section 1.3). Participants were surveyed, and a large majority of the respondents agreed that the data were representative of casework (SI Appendix, Table S3).
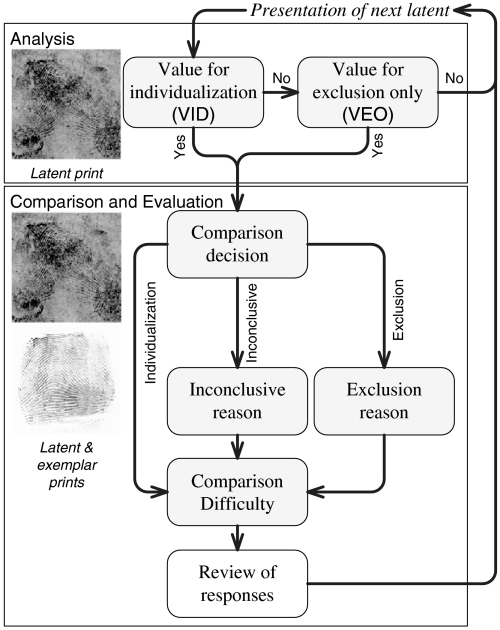
Noblis developed custom software for this study in consultation with latent print examiners, who also assessed the software and test procedures in a pilot study. The software presented latent and exemplar images to the participants, allowed a limited amount of image processing, and recorded their decisions, as indicated in Fig. 1 (SI Appendix, section 1.2). Each of the examiners was randomly assigned approximately 100 image pairs out of the total pool of 744 image pairs (SI Appendix, section 1.3). The image pairs were presented in a preassigned order; examiners could not revisit previous comparisons. They were given several weeks to complete the test. Examiners were instructed to use the same diligence that they would use in performing casework. Participants were assured that their results would remain anonymous; a coding system was used to ensure anonymity during analysis and in reporting.
Fig. 1.
Software workflow. Each examiner was assigned a distinct, randomized sequence of image pairs. For each pair, the latent was presented first for a value decision; if it was determined to be no value, the test proceeded directly to the latent from the next image pair; otherwise, an exemplar was presented for comparison and evaluation (SI Appendix, section 1.5).
Results
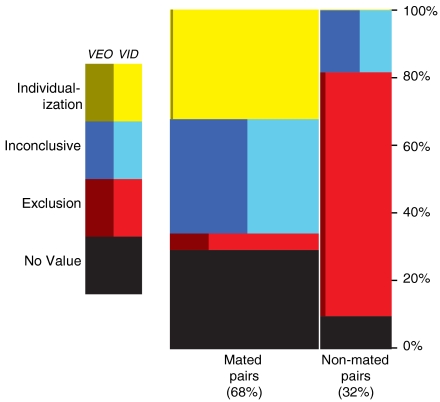
A summary of examiner decisions is shown in Fig. 2. We emphasize that individual examiner decisions are only a part of an overall operational process, which may include verification, quality assurance, and reporting. Our results do not necessarily reflect the performance of this overall operational process.
Fig. 2.
Distribution of 17,121 decisions. 23% of all decisions resulted in no-value decisions (no comparison was performed); comparison decisions were based on latents of VID and of VEO; 7.5% of comparisons of mated pairs resulted in exclusion decisions (false negatives); 0.1% of comparisons of nonmated pairs resulted in individualization decisions (false positives—too few to be visible) (SI Appendix, Table S5).
The true negative rate was greater than the true positive rate. Much of this difference may be explained by three factors: The amount of information necessary for an exclusion decision is typically less than for an individualization decision, examiners operate within a culture where false positives are seen as more serious errors than false negatives (5), and the mated pairs included a greater proportion of poor-quality prints than the nonmated pairs (SI Appendix, section 1.3). Whereas poor-quality latents result in the no-value decisions in Fig. 2, the poor-quality exemplars contribute to an increase in the proportion of inconclusive decisions.
Rates of comparison decisions can be calculated as a percentage of all presentations (PRES), including latents of no value; of comparisons where the latent was of value for individualization (VID); or of all comparisons (CMP), which includes comparisons where the latent was of value for exclusion only (VEO) as well as VID. Because standard operating procedures typically include only VID comparisons, this is our default basis for reporting these rates.
False Positives
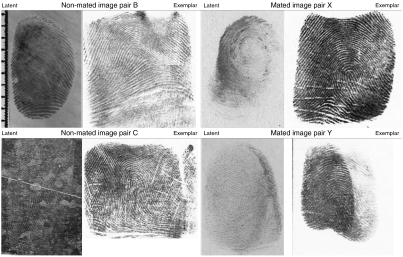
Six false positives occurred among 4,083 VID comparisons of nonmated pairs (false positive rate, FPRVID = 0.1%) (SI Appendix, Tables S5 and S8; confidence intervals are discussed in SI Appendix, section 2.1). The image pairs that resulted in two of the false positives are shown in Fig. 3. Two of the false positive errors involved a single latent, but with exemplars from different subjects. Four of the five distinct latents on which false positives occurred (vs. 18% of nonmated latents) were deposited on a galvanized metal substrate, which was processed with cyanoacrylate and light gray powder. These images were often partially or fully tonally reversed (light ridges instead of dark), on a complex background (Fig. 3, image pair C). It is not known if other complex backgrounds or processing artifacts would have a similar increased potential for error.
Fig. 3.
Examples of fingerprint pairs used in the study that resulted in examiner errors. Pairs B and C resulted in false positive errors: 1 of 30 examiners made an individualization decision on B (24 exclusions); 1 of 26 examiners made an individualization decision on C (22 exclusions). The processing of the latent in C (cyanoacrylate with light gray powder) tonally reversed the image so that portions of ridges were light rather than dark. Pairs X and Y resulted in false negative errors, with no true positives made by any examiner: X was excluded by 13 of 29 examiners, presumably because the latent was deposited with a twisting motion that resulted in misleading ridge flow; Y was excluded by 15 of 18 examiners; the exemplar was particularly distorted. For use in this figure, these images were cropped to reduce background area.
The six errors were committed by five examiners, three of whom were certified (including one examiner who made two errors); one was not certified; one did not respond to our background survey. These correspond to the overall proportions of certifications among participants (SI Appendix, section 1.4). In no case did two examiners make the same false positive error: Five errors occurred on image pairs where a large majority of examiners correctly excluded; one occurred on a pair where the majority of examiners made inconclusive decisions. This suggests that these erroneous individualizations would have been detected if blind verification were routinely performed. For verification to be truly blind, examiners must not know that they are verifying individualizations; this can be ensured by performing verifications on a mix of conclusion types, not merely individualizations. The general consensus among examiners did not indicate that these were difficult comparisons, and only for two of the six false positives did the examiner making the error indicate that these were difficult (SI Appendix, Table S8).
There has been discussion (24, 26, 27) regarding the appropriateness of using qualified conclusions in investigation or testimony. The effects of qualified conclusions could be assessed in this study, as “inconclusive with corresponding features” (SI Appendix, section 1.5). Qualified conclusions potentially yield many additional “leads”: 36.5% of VID comparisons resulted in individualization decisions, and an additional 6.2% resulted in qualified conclusions. However, 99.8% of individualization decisions were mated, as opposed to only 80.6% of qualified conclusions (SI Appendix, section 2). Only one of the six image pairs that resulted in false positives had a plurality of inconclusive decisions, and none had a plurality “with corresponding features.”
False Negatives
False negatives were much more prevalent than false positives (false negative rate: FNRVID = 7.5%) (SI Appendix, Table S5). Including VEO comparisons had no substantial effect: FNRCMP = 7.5%. Eighty-five percent of examiners made at least one false negative error, despite the fact that 65% of participants said that they were unaware of ever having made an erroneous exclusion after training (SI Appendix, section 1.4, no. 25); awareness of previous errors was not correlated with false negative errors on this test. False negatives were distributed across half of the image pairs that were compared. The likelihood of false negatives varied significantly by examiner (discussed further under Examiner Skill, below), and by image pair (SI Appendix, Figs. S3 and S5 C and D). Of the image pairs that were most frequently associated with false negatives, most had distorted latents and/or exemplars that gave an appearance of a different ridge flow pattern.
Verification of exclusions (especially blind verification) is not standard practice in many organizations, in part due to the large number encountered in casework. To investigate the potential benefits of blind verification, we posed the following question: Given a mated image pair, what is the probability, pv, that two examiners would both reach exclusion decisions? If exclusions were equally likely for all image pairs (independence assumption), we would estimate that exclusions by two examiners would occur at the rate  (SI Appendix, Table S5). However, the data show that the independence assumption is not valid: Some mated pairs are more likely to be excluded than others. Because the outcomes of blind verifications are not statistically independent but depend on the image pairs, we estimate pv = 0.85% (SI Appendix, section 11). This suggests that blind verification of exclusions could greatly reduce false negative errors; agency policy would have to balance this benefit with the impact on limited resources.
For exclusions where the latent was VID, examiner assessment of comparison difficulty was a good predictor of accuracy, but even “Very Easy/Obvious” exclusions were sometimes incorrect: Among 450 false negatives where the latent was VID, 13 were rated “Very Easy/Obvious” by 11 distinct examiners (SI Appendix, Fig. S8). Latent value (VEO vs. VID) had no predictive value for false negative errors; however, exclusions were more likely to be true negatives when the latent was VID than when it was VEO. This counterintuitive result is due to the fact that VEO determinations were more often inconclusive, hence most exclusion decisions were associated with VID latents (SI Appendix, Fig. S7).
Posterior Probabilities
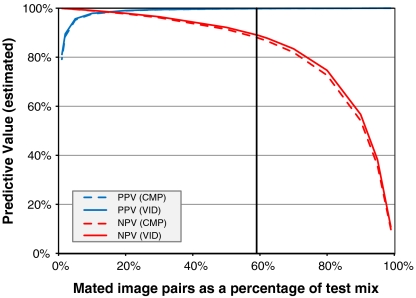
False positive and false negative rates are important accuracy measures, but assume a priori knowledge of true mating relationships, which of course are not known in forensic casework. In practice, knowledge of mating relationships is based solely on examiners’ decisions: It is important to know the likelihood that these decisions are correct. Positive predictive value (PPV) is the percentage of individualization decisions that are true positives; negative predictive value (NPV) is the percentage of exclusion decisions that are true negatives. Fig. 4 depicts PPV and NPV as functions of the prior prevalence of mated pairs among the examinations performed: As the proportion of mated pairs increases, PPV increases and NPV decreases (SI Appendix, section 9). The prior prevalence of mated pair comparisons varies substantially among organizations, by case type, and by how candidates are selected. Mated comparisons are far more prevalent in cases where the candidates are suspects determined by nonfingerprint means than in cases where candidates were selected by an AFIS.
Fig. 4.
PPV and NPV as a function of mate prevalence in workload. The observed predictive values (PPVVID,59% = 99.8% and NPVVID,59% = 88.9% for VID comparisons) correspond to the actual test mix (indicated) where 59% of VID comparisons were mated pairs; other predictive values are calculated as a function of mate prevalence. Sixty-two percent of all comparisons (VEO and VID) were performed on mated pairs, and PPVCMP,62% = 99.8% and NPVCMP,62% = 86.6%.
Consensus
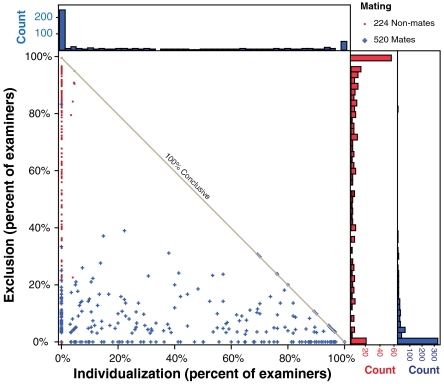
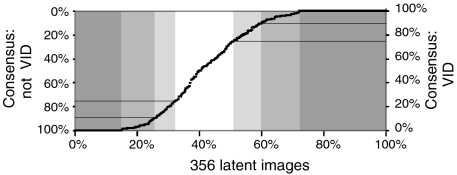
Each image pair was examined by an average of 23 participants. Their decisions can be regarded as votes in a decision space (Fig. 5). Consensus was limited on both mated and nonmated pairs: VID decisions were unanimous on 48% of mated pairs and 33% of nonmated pairs. Votes by latent print examiners also provide a basis for assessing sufficiency for value decisions, as shown in Fig. 6; consensus on individualization and exclusion decisions is shown in SI Appendix, Fig. S6.
Fig. 5.
Decision rates on each image pair. Percentage of examiners making an individualization decision (x axis) vs. exclusion decision (y axis) on each image pair; mean 23 presentations per pair. VEO and no-value decisions are treated as inconclusive. Marginal distributions are shown as histograms. Of mated pair decisions, 10% were unanimous true positives, 38% unanimous inconclusives. Of nonmated pair decisions, 25% were unanimous true negatives, 9% were unanimous inconclusives. Points along diagonal represent pairs on which all examiners reached conclusions. The prevalence of false negatives is evident in the vertical spread of mated pairs; the few false positives are evident in the limited horizontal spread of the nonmated pairs.
Fig. 6.
Examiner consensus on VID decisions, showing the percentage of examiners reaching consensus (y axis) on each latent (x axis). Areas of unanimous (100%), decile (10%, 90%), and quartile (25%, 75%) consensus are marked. For example, at a 90% level of consensus (y axes), examiners agreed that 40% of the latents were VID (interval from 60% to 100% indicated by a horizontal line in upper right) (SI Appendix, Table S11). Such measures of consensus may be useful in developing quantity and quality metrics.
Lack of consensus among examiners can be attributed to several factors. For unanimous decisions, the images were clearly the driving factor: Unusable or pristine prints resulted in unanimous decisions, and therefore different data selection would have affected the extent of consensus. When there was a lack of consensus, much of the variation could be explained by examiner differences: Examiners showed varying tendencies toward no-value or inconclusive decisions, or toward conclusions (SI Appendix, Fig. S4). Examiners differed significantly in conclusion rates, and we see this effect as secondary to image characteristics in explaining lack of consensus. Other factors accounting for lack of consensus include intraexaminer inconsistency and (presumably) test environment (SI Appendix, Fig. S3).
It was not unusual for one examiner to render an inconclusive decision while another made an individualization decision on the same comparison. This result is consistent with previous observations (1, 5, 28). Among all decisions based on mated pairs, 23.0% resulted in decisions other than individualization even though at least one other examiner made a true positive on the same image pair; 4.8% were not individualization decisions even though the majority of other examiners made true positives. This has operational implications in that some potential individualizations are not being made, and contradictory decisions are to be expected.
When examiners reached contradictory conclusions (exclusion and individualization) on a single comparison, the exclusion decision was more frequently in error: 7.7% of independent examinations of conclusions on mates were contradictory, vs. 0.23% on nonmates. Which of the contradictory decisions is more likely to be erroneous depends on the prior prevalence of mated vs. nonmated pairs: Exclusion decisions are more likely to be erroneous except in situations where the prior prevalence of nonmated pairs is very high.
Examiner Skill
The criminal justice system relies on the skill of latent print examiners as expert witnesses. Currently, there is no generally accepted objective measure to assess the skill of latent print examiners. Skill is multidimensional and is not limited to error rates (FPR and FNR), but also includes TPR, true negative rate (TNR), VID and VEO rates, and conclusion rate (CR—the percentage of individualization or exclusion conclusions as opposed to no-value or inconclusive decisions). Any assessment of skill must consider these dimensions. Although most discussions of examiner skill focus on error rates (e.g., ref. 13), the other aspects of examiner skill are important not just to the examiner’s organization, but to the criminal justice system as well; e.g., an examiner who is frequently inconclusive is ineffective and thereby fails to serve justice. Both individual examiners and organizations must strike a proper balance between the societal costs of errors and inappropriate decisions, and the operational costs of detection. Contradictory verification decisions, whether involving erroneous conclusions or inappropriate inconclusive decisions, should be internally documented and addressed through an organization’s continual improvement processes.
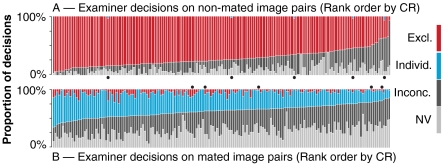
We found that examiners differed substantially along these dimensions of skill, and that these dimensions were largely independent. Our study measured all of these dimensions with the exception of FPRs for individual examiners, which were too low to measure with precision (SI Appendix, section 3). Fig. 7 shows that examiners’ conclusion rates (CRPRES) varied from 15 to 64% (mean 37%, SD 10%) on mated pairs, and from 7 to 96% (mean 71%, SD 14%) on nonmated pairs. The observed range in CRs may be explained by a higher level of skill (ability to reach more conclusions at the same level of accuracy), or it may imply a higher risk tolerance (more conclusions reached at the expense of making more errors).
Fig. 7.
Decision rates by examiner. Proportions of decisions for all 169 examiners on (A) nonmated and (B) mated image pairs. Examiners in each chart are sorted on CR. Each examiner was randomly assigned 51 to 74 mated image pairs (mean 69, SD 5) and 26 to 53 nonmated image pairs (mean 33, SD 7). In both, errors are shown in red. Column width indicates the number of image pairs. Examiners who made false positive errors are indicated with black dots (SI Appendix, Table S7).
Fig. 7 shows substantial variability in CR among examiners. These measured rates were based on an average of 69 mated presentations and 33 nonmated presentations. The limited number of presentations resulted in a wide margin of measurement error when evaluating the performance of an individual examiner (SI Appendix, Fig. S5). Although the estimates for each examiner are statistically unbiased, the sampling error in these estimates contributed substantially to the observed variability among examiners. The observed variability is a biased estimate that overstates the true variability (SI Appendix, Figs. S3B and S4).
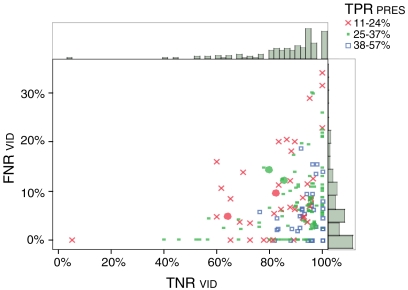
Fig. 8 shows the relations between three of the skill dimensions measured for each examiner. Blue squares near the lower right of the chart represent highly skilled examiners: accurate (making few or no errors) and effective (high TNR and TPR, and therefore high CR). The red cross at the bottom left denotes an accurate (0% FNRVID), but ineffective (5% TNRVID, 16% TPRPRES) examiner. The examiner denoted by the red cross at the top right is inaccurate (34% FNRVID), and has mixed effectiveness (100% TNRVID, 23% TPRPRES). Attempting to compare the skill of any two examiners is a multidimensional problem. A combination of multiple dimensions into a single hypothetical measure of skill would require a weighting function to trade off the relative value of each dimension; such weighting might be driven by policy, based on the relative cost/benefit of each dimension for operational needs.
Fig. 8.
Examiner skill. Each of the 169 examiners is plotted on three skill dimensions: TNRVID (mean 88%, SD 13.6%), FNRVID (mean 7.5%, SD 7.3%), and TPRPRES (shown in color, with red crosses denoting the lowest quartile and blue squares the highest quartile; mean 32%, SD 9.4%). The five examiners who made false positive errors are indicated with bold filled circles.
Tests could be designed to measure examiner skill along the multiple dimensions discussed here. Such tests could be valuable not just as traditional proficiency tests with pass/fail thresholds, but as a means for examiners or their organizations to understand skills for specific training, or for tasking based on skills (such as selecting examiners for verification based on complementary skill sets).
Certified examiners had higher conclusion rates than noncertified examiners without a significant change in accuracy (significantly higher TPRVID and TNRVID; FNRVID did not vary significantly) (SI Appendix, section 6). Length of experience as a latent print examiner did not show a significant correlation with TPRVID, TNRVID, or FNRVID (SI Appendix, Table S9 and Fig. S2).
Examiners with a lower TPRVID tended also to have a lower TNRVID. Examiners with a higher FNRVID tended to have a lower TPRVID. Examiners with a higher TNRVID tended also to have a higher FNRVID (SI Appendix, Table S9 and Fig. S2).
Conclusions
Assessing the accuracy and reliability of latent print examiners is of great concern to the legal and forensic science communities. We evaluated the accuracy of decisions made by latent print examiners on difficult fingerprint comparisons in a computer-based test corresponding to one stage in AFIS casework. The rates measured in this study provide useful reference estimates that can inform decision making and guide future research; the results are not representative of all situations, and do not account for operational context and safeguards. False positive errors (erroneous individualizations) were made at the rate of 0.1% and never by two examiners on the same comparison. Five of the six errors occurred on image pairs where a large majority of examiners made true negatives. These results indicate that blind verification should be highly effective at detecting this type of error. Five of the 169 examiners (3%) committed false positive errors, out of an average of 33 nonmated pairs per examiner.
False negative errors (erroneous exclusions) were much more frequent (7.5% of mated comparisons). The majority of examiners (85%) committed at least one false negative error, with individual examiner error rates varying substantially, out of an average of 69 mated pairs per examiner. Blind verification would have detected the majority of the false negative errors; however, verification of exclusion decisions is not generally practiced in operational procedures, and blind verification is even less frequent. Policymakers will need to consider tradeoffs between the financial and societal costs and benefits of additional verifications.
Most of the false positive errors involved latents on the most complex combination of processing and substrate included in the study. The likelihood of false negatives also varied by image. Further research is necessary to identify the attributes of prints associated with false positive or false negative errors, such as quality, quantity of features, distortion, background, substrate, and processing method.
Examiners reached varied levels of consensus on value and comparison decisions. Although there is currently no objective basis for determining the sufficiency of information necessary to reach a fingerprint examination decision, further analysis of the data from this study will assist in defining quality and quantity metrics for sufficiency. This lack of consensus for comparison decisions has a potential impact on verification: Two examiners will sometimes reach different conclusions on a comparison.
Examiner skill is multidimensional and is not limited to error rates. Examiner skill varied substantially. We measured various dimensions of skill and found them to be largely independent.
This study is part of a larger ongoing research effort. To further our understanding of the accuracy and reliability of latent print examiner decisions, we are developing fingerprint quality and quantity metrics and analyzing their relationship to value and comparison decisions; extending our analyses to include detailed examiner markup of feature correspondence; collecting fingerprints specifically to explore how complexity of background, substrate and processing are related to comparison decisions; and measuring intraexaminer repeatability over time.
This study addresses in part NRC Recommendation 3 (12), developing and quantifying measures of accuracy and reliability for forensic analyses, and will assist in supporting the scientific basis of forensic fingerprint examination. The results of this study will provide insight into developing operational procedures and training of latent print examiners and will aid in the experimental design of future proficiency tests of latent print examiners.
Supplementary Material
Acknowledgments.
We thank the latent print examiners who participated in this study, as well as William Fellner, Jill McCracken, Keith Ward, Stephen Meagher, Calvin Yeung, Ted Unnikumaran, Erik Stanford, and William Chapman. This is publication number 10-19 of the FBI Laboratory Division. This work was funded in part under a contract award to Noblis, Inc. from the FBI Biometric Center of Excellence and in part by the FBI Laboratory Division. The views expressed are those of the authors and do not necessarily reflect the official policy or position of the FBI or the US government.
Footnotes
The authors declare no conflict of interest.
This article is a PNAS Direct Submission.
This article contains supporting information online at www.pnas.org/lookup/suppl/doi:10.1073/pnas.1018707108/-/DCSupplemental.
References
- 1.Evett IW, Williams RL. A review of the 16 point fingerprint standard in England and Wales. Fingerprint Whorld. 1995;21 [Google Scholar]
- 2.Wertheim K, Langenburg G, Moenssens A. A report of latent print examiner accuracy during comparison training exercises. J Forensic Identification. 2006;56:55–93. [Google Scholar]
- 3.Gutowski S. Error rates in fingerprint examination: The view in 2006. Forensic Bulletin. 2006;2006:18–19. Autumn. [Google Scholar]
- 4.Langenburg G, Champod P, Wertheim P. Testing for potential contextual bias effects during the verification stage of the ACE-V methodology when conducting fingerprint comparisons. J Forensic Sci. 2009;54:571–582. doi: 10.1111/j.1556-4029.2009.01025.x. [DOI] [PubMed] [Google Scholar]
- 5.Langenburg G. A performance study of the ACE-V process. J Forensic Identification. 2009;59:219–257. [Google Scholar]
- 6.Cole SA. More than zero: Accounting for error in latent fingerprint identification. J Crim Law Criminol. 2005;95:985–1078. [Google Scholar]
- 7.United States v Mitchell. No. 96-407 (ED PA 1999)
- 8.United States v Llera Plaza. Cr. No. 98-362-10, 11, 12 (ED PA 2002)
- 9.Maryland v Rose. No. K06-0545 (MD Cir 2007)
- 10.Office of the Inspector General. A Review of the FBI’s Handling of the Brandon Mayfield Case. Washington, DC: US Department of Justice; 2006. [Google Scholar]
- 11.Budowle B, Buscaglia J, Perlman RS. Review of the scientific basis for friction ridge comparisons as a means of identification: Committee findings and recommendations. Forensic Sci Commun. 2006;8:1. [Google Scholar]
- 12.National Research Council. Strengthening Forensic Science in the United States: A Path Forward. Washington, DC: National Academies Press; 2009. [Google Scholar]
- 13.Koehler JJ. Fingerprint error rates and proficiency tests: What they are and why they matter. Hastings Law J. 2008;59:1077–1110. [Google Scholar]
- 14.Mnookin JL. The validity of latent fingerprint identification: Confessions of a fingerprinting moderate. Law Probability and Risk. 2008;7:127–141. [Google Scholar]
- 15.Haber L, Haber RN. Scientific validation of fingerprint evidence under Daubert. Law Probability and Risk. 2008;7:87–109. [Google Scholar]
- 16.Cole S. Is fingerprint identification valid? Rhetorics of reliability in fingerprint proponents’ discourse. Law Policy. 2006;28:109–135. [Google Scholar]
- 17.Scientific Working Group on Friction Ridge Analysis, Study and Technology. Standard terminology of friction ridge examination, Version 3. 2011. Available at http://www.swgfast.org/documents/terminology/110323_Standard-Terminology_3.0.pdf.
- 18.Dror I, Mnookin J. The use of technology in human expert domains: Challenges and risks arising from the use of automated fingerprint identification systems in forensic science. Law Probability and Risk. 2010;9:47–67. [Google Scholar]
- 19.Huber RA. Expert witness. Criminal Law Quarterly. 1959;2:276–296. [Google Scholar]
- 20.Ashbaugh D. Quantitative-Qualitative Friction Ridge Analysis: An Introduction to Basic and Advanced Ridgeology. New York: CRC Press; 1999. [Google Scholar]
- 21.Scientific Working Group on Friction Ridge Analysis, Study and Technology. Friction ridge examination methodology for latent print examiners, Version 1.01. 2002. Available at http://www.swgfast.org/documents/methodology/100506-Methodology-Reformatted-1.01.pdf.
- 22.Champod C. Edmond Locard—Numerical standards and “probable” identifications. J Forensic Identification. 1995;45:136–155. [Google Scholar]
- 23.Neumann C, et al. Computation of likelihood ratios in fingerprint identification for configurations of any number of minutiae. J Forensic Sci. 2007;52:54–64. doi: 10.1111/j.1556-4029.2006.00327.x. [DOI] [PubMed] [Google Scholar]
- 24.Mnookin JL. Of black boxes, instruments, and experts: Testing the validity of forensic science. Episteme. 2008;5:343–358. [Google Scholar]
- 25.Budowle B, et al. A perspective on errors, bias, and interpretation in the forensic sciences and direction for continuing advancement. J Forensic Sci. 2009;54:798–809. doi: 10.1111/j.1556-4029.2009.01081.x. [DOI] [PubMed] [Google Scholar]
- 26.Saks M, Koehler J. The coming paradigm shift in forensic identification science. Science. 2005;309:892–895. doi: 10.1126/science.1111565. [DOI] [PubMed] [Google Scholar]
- 27.Stoney DA. What made us ever think we could individualize using statistics? J Forensic Sci Soc. 1991;31:197–199. doi: 10.1016/s0015-7368(91)73138-1. [DOI] [PubMed] [Google Scholar]
- 28.Grieve DL. Possession of truth. J Forensic Identification. 1996;46:521–528. [Google Scholar]
Associated Data
This section collects any data citations, data availability statements, or supplementary materials included in this article.


