

Abstract
CA1 cells receive direct input from space-responsive cells in medial entorhinal cortex (MEC), such as grid cells, as well as more non-spatial cells in lateral entorhinal cortex (LEC). Because MEC projects preferentially to the proximal part of the CA1, bordering CA2, whereas LEC innervates only the distal part, bordering subiculum, we asked if spatial tuning is graded along the transverse axis of CA1. Tetrodes were implanted along the entire proximodistal axis of dorsal CA1 in rats. Data were recorded in cylinders large enough to elicit firing at more than one location in many neurons. Distal CA1 cells showed more dispersed firing and had a larger number of firing fields than proximal cells. Phase-locking of spikes to MEC theta oscillations was weaker in distal CA1 than in proximal CA1. The findings suggest that spatial firing in CA1 is organized transversally, with the strongest spatial modulation occurring in the MEC-associated proximal part.
The location-specific firing of hippocampal place cells is one of the most striking behavioural correlates of individual neurons in the mammalian cortex. More than three decades ago it was evident from recordings in freely moving rats that the majority of hippocampal pyramidal cells fire specifically in certain regions (place fields) of the local environment (O’Keefe and Dostrovsky, 1971; O’Keefe, 1976). It was shown that, because different cells have different place fields, hippocampal neurons, as a population, provide an accurate dynamic representation of the animal’s location in space (Wilson and McNaughton, 1993). More recent work revealed that hippocampal cells also respond to a number of non-spatial variables such as temporal relationships, task demands, floor texture, and odours (Hampson et al., 1993; Young et al., 1994; Wood et al., 1999). Individual cells were found to participate in multiple representations of the same location, with the active subset depending on the physical properties of the place (Muller and Kubie, 1987; Bostock et al., 1991; Leutgeb et al., 2005a) or events associated with the place at present or in the past (Markus et al., 1995; Frank et al., 2000; Wood et al., 2000; Olypher et al., 2002; Leutgeb et al., 2005b). These observations do not rule out place as a primary determinant of hippocampal firing but suggest that hippocampal pyramidal cells are responsive to a spectrum of external as well as internal influences.
Hippocampal activity is shaped by spatial and non-spatial input from the surrounding cortex, most of which is mediated through the entorhinal areas. While both medial and lateral divisions of the entorhinal cortex project extensively to the hippocampus, each subregion appears to contribute distinct information. The medial entorhinal cortex (MEC) is a key component of the brain’s system for mapping the animal’s location in space (Moser et al., 2008; Moser and Moser, 2008). This area contains several specialized cell types, such as grid cells, head direction cells and border cells, which together form a dynamic path integration-dependent representation of the animal’s location relative to external or internal reference points (Fyhn et al., 2004; Hafting et al., 2005; McNaughton et al., 2006; Sargolini et al., 2006; Solstad et al., 2008). The lateral entorhinal cortex (LEC), in contrast, exhibits little spatial modulation. Most neurons in this area fire throughout the environment and may respond more strongly to non-spatial variables such as object identity or context (Zhu et al., 1995; Suzuki et al., 1997; Young et al., 1997; Knierim et al., 2006). Thus, hippocampal activity may be affected very differently by medial and lateral entorhinal signals.
MEC and LEC neurons have strikingly different termination patterns at early and late stages of the hippocampal circuit (Witter and Amaral, 2004). In dentate gyrus and CA3, the projections converge on different dendritic segments of the same cells, suggesting that cells in these subfields respond to changes in spatial as well as nonspatial input (Leutgeb et al., 2005a). In CA1 and subiculum, the medial and lateral fibers terminate instead on different cell populations, at different proximodistal positions within the subfield, such that MEC axons reach preferentially the proximal part of CA1, near the CA2 border, and the distal part of subiculum, near the presubiculum border, whereas LEC axons terminate primarily in the distal part of CA1 and the adjacent proximal part of subiculum (Tamamaki and Nojyo, 1995; Witter et al., 2000; Naber et al., 2001). Return projections from CA1 and subiculum to the entorhinal cortex follow a reciprocal pattern, with proximal CA1 and distal subicular cells terminating mostly in MEC and distal CA1 cells and proximal subicular cells mostly in LEC (Tamamaki and Nojyo, 1995; Naber et al., 2001). To the extent that place fields in hippocampal cells depend on direct inputs from the entorhinal cortex (Brun et al., 2002, 2008; Colgin et al., 2009, their Supplementary Figure 14), this pattern of connectivity predicts a stronger spatial signal in the MEC-associated proximal part of CA1 than in the LEC-associated distal part (Knierim et al., 2006; Ahmed and Mehta, 2009). We tested this prediction by comparing place-related firing across the entire proximodistal extent of CA1.
Results
Electrode locations
All tetrodes in CA1 were placed centrally in the dorsal one-third of the subfield (Fig. 1 and 2). CA1 was identified in Nissl stains as the band of small pyramidal cells between the wider cell layers of CA2 at the proximal end of the transverse plane and subiculum at the distal end (Fig. 1). On coronal sections through the dorsal one-third of the hippocampus, the CA1 was distinguished on the medial side from the fasciola cinereum, the medially curved continuation of the hippocampus at the septal tip of the structure (Fig. 1). Based on a three-dimensional reconstruction of the hippocampus, the CA1 field was divided into three equally broad longitudinal bands (proximal, intermediate, and distal CA1; Fig. 2). Bands were defined by an observer blind to the electrode positions (M.P.W.). Tetrodes in CA1 (26 in total) were found to be distributed equally between the three bands, such that recording positions covered the entire transverse length of CA1 (Fig. 1 and 2). A minority of the tetrodes reached subiculum or fasciola cinereum (13 and 7, respectively). Data from these tetrodes were not included in the analysis (see Experimental Procedures).
Figure 1.

Nissl-stained coronal brain sections showing tetrode tracts in proximal, intermediate and/or distal parts of CA1 for all animals in the main study. Arrowheads indicate recording locations. Rat numbers are indicated. Red lines show borders of CA1 in the coronal plane (fasciola cinereum, FC; subiculum, SUB).
Figure 2.

Distribution of recording locations along the proximodistal axis of CA1. The figure provides a dorsal view of the complete set of recording locations superimposed on a picture of the hippocampus in a rat brain with the overlying cortex removed. Blue dots indicate recording sites in the proximal band of CA1 (associated with MEC), red dots are from the intermediate band, and green dots are from the distal band (associated with LEC). Estimated borders between proximal, intermediate, and distal one-thirds of the transverse CA1 axis are indicated by red lines. Note that the complex 3-dimensional curvature of the hippocampus and the way it is positioned in the rat brain make any standard plane of sectioning inappropriate for assessment of transverse organization. In order to compare corresponding proximal and distal portions in CA1 at the same dorsoventral level, recording sites should shift from anterior at the proximal (lateral) end towards posterior at the distal (medial) end (Andersen et al., 1971). The distribution of recording sites satisfies this criterion, as illustrated in the figure.
Cell sample
A total of 293 well-isolated active cells with peak-to-trough latencies of more than 200 μs were recorded from dorsal CA1 in 7 rats in the main experiment. Recordings were made while the rats were running in a 2-m or 1-m wide cylinder-shaped box, or while they were resting in a flower pot next to the box. Cells were recorded on three running trials; twice in the large cylinder (Trials 1 and 3) and once in the small cylinder (Trial 2). Using the histological criteria developed above, we assigned 79 of the 246 cells with activity in the large cylinder to proximal CA1, 90 to intermediate CA1, and 77 to distal CA1 (active cells were defined as cells with more than 100 spikes). The percentage of active cells did not differ along the proximodistal axis (proximal: 85.0%; intermediate: 84.1%; distal: 82.8%; all pairwise comparisons: Z < 0.40, P > 0.30). The corresponding percentages in the small cylinder were 54.8 in proximal CA1, 54.2 in intermediate CA1, and 63.4 in distal CA1 (Z < 1.32, P > 0.09). Proximal cells were obtained from 3 animals (7 tetrodes), intermediate cells from 5 animals (11 tetrodes), and distal cells from 5 animals (9 tetrodes). Two rats had tetrodes in all three bands; two had tetrodes in two bands (Supplementary Fig. 1). Cells were recorded simultaneously from all bands with tetrodes in these four animals.
Separation of spike clusters was not different between proximal, intermediate and distal tetrodes (Supplementary Fig. 1AB). Median Mahalonobis distances (Schmitzer-Torbert et al., 2005) were 29.5, 27.7 and 28.5, respectively, in the large cylinder and 29.5, 28.9 and 30.0, respectively, in the small cylinder (pairwise Mann-Whitney U tests: all Z < 1, P > 0.50). There was no difference in the widths of waveforms (Supplementary Fig. 1C). Average firing rates of complex-spiking units were not significantly different between regions. There was no difference in mean rates between proximal, intermediate and distal CA1 cells (F < 1 for all trials; Supplementary Table 1).
A separate cell sample, obtained from animals with simultaneous recordings from CA1 and MEC, was used to estimate phase-locking to MEC theta oscillations of spikes from CA1 cells at different proximodistal positions (38 cells from 6 rats; 10 cells from 2 proximal tetrodes in 2 rats, 15 cells from 6 intermediate tetrodes in 2 rats, 13 cells from 4 distal tetrodes in 2 rats). These cells were obtained from animals used in a previous study in which the rats ran in circular or square boxes or on a linear track (Colgin et al., 2009). Phase-locking between CA1 spike activity and entorhinal theta waves was not assessed in that report.
Spatial tuning along the proximodistal axis of CA1
Nearly all cells in the main study with a minimum of 100 spikes and waveforms longer than 200 μs satisfied the criterion for place cells (Fig. 3AB). Place cells were defined by comparing each cell’s spatial information score with the distribution of information scores for rate maps generated from randomly shuffled data (Fig. 3B). Shuffling was performed on a cell-by-cell basis. A total of 100 permutations were made for each cell in the respective CA1 band in each environment. In each permutation trial, the entire sequence of spikes fired by the cell was time-shifted along the animal’s path by a random interval between 20 s and the total trial length minus 20 s (usually 1200-20 = 1180 s in the large cylinder). The end of the trial was wrapped to the beginning to allow for circular displacements. A rate map was generated for each permutation and the distribution of spatial information values across all permutations of all cells in the CA1 band was determined (Fig. 3B, lower row). Place cells were then defined as cells with spatial information scores above the 95th percentile of the distribution of scores from shuffled data for the relevant CA1 band (Fig. 3B, upper row). On Trial 1 in the large cylinder, 78 out of 79 cells (99%) in the proximal band, 81 out of 90 cells (90%) in the intermediate band, and 71 out of 77 distal cells (92%) in the distal band passed the 95th percentile threshold. Although the proportion of place cells was very large in all three proximodistal bands, the estimated fraction for proximal CA1 was significantly higher than for intermediate and distal CA1 (proximal vs. distal: Z = 1.97, P = 0.05; proximal vs. intermediate: Z = 2.40, P < 0.01; intermediate vs. distal: Z = 0.50, P > 0.30). This difference was enhanced with a 99th-percentile threshold (proximal: 75 of 79 cells, or 95%; intermediate: 72 of 90 cells, or 80%; distal: 62 of 77 cells, or 81%; proximal vs. distal: Z = 2.75, proximal vs. intermediate: Z = 2.88, both P < 0.005).
Figure 3.
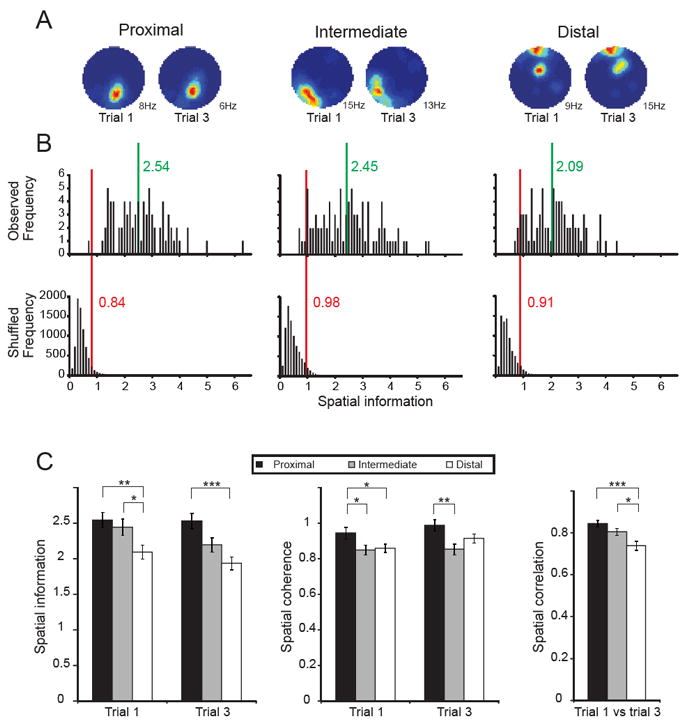
Spatial information along the proximodistal axis of CA1. (A) Rate maps for representative cells recorded in proximal, intermediate, and distal bands of CA1 (left to right). Two recordings are shown for each cell. Spatial information values are close to the mean values of the respective bands. Firing rate is colour-coded from dark blue (silent) to red (maximum rate). (B) Distribution of spatial information scores for the entire cell sample in proximal, intermediate and distal CA1 (left to right). Top panels: Distribution of actual data. Green line and numbers indicate mean. Bottom panels: Distribution of shuffled data based on 100 permutations per cell in the respective CA1 band. Red line indicates 95th percentile value for a distribution based on all permutations in all cells of the respective band. Nearly all cells in all CA1 bands have spatial information scores above the 95th-percentile level (upper vs. bottom row). (C) Spatial information, spatial coherence, and spatial correlation between rate maps on trials 1 and 3 in the large box for cells recorded from proximal, intermediate, and distal CA1 (means ± S.E.M.). *, P < 0.05; **, P < 0.01; ***, P < 0.001.
The reduction from proximal to distal CA1 in the proportion of units that met the criterion for place specificity was matched by a decrease in other estimates of spatial tuning. The effect was most pronounced in the large cylinder, where the distribution of spatial information values was clearly skewed towards higher values in proximal and intermediate CA1 compared with distal CA1 (Fig. 3B, upper row). There was a significant proximodistal difference in spatial information across the three bands in the large environment (Trial 1: F(2,243) = 4.55, P = 0.01; Trial 3 (F(2,243) = 8.28, P < 0.001; Fig. 3BC and Supplementary Fig. 2 and 3). The difference reflected higher spatial information values in proximal cells than in distal cells (Trial 1: t(154) = 3.05, P < 0.005; Trial 3: t(154) = 4.21, P < 0.001) and higher scores in intermediate than in distal cells (t(165) > 2.29, P < 0.05, on Trials 1 and 3). In this environment, there was also a significant correlation between spatial information and position along the proximodistal axis, expressed for each tetrode as the distance from CA2 divided by the total distance between CA2 and subiculum at that septotemporal position (Trial 1: r(244) = − 0.214, P < 0.001; Trial 3: r(244) = − 0.291, P < 0.001). A similar tendency was apparent on Trial 2 in the small cylinder but the difference between the CA1 bands was marginal (F(2,162) = 3.00, P = 0.05). The correlation with proximodistal position was significant (r(165) = − 0.214, P < 0.01).
The lower spatial information content of distal CA1 cells in the large environment was matched by a reduction from proximal to distal CA1 in spatial coherence and stability. Spatial coherence, estimated as the first order spatial autocorrelation of the unsmoothed place field map (Muller and Kubie, 1989), was larger in proximal than intermediate and distal CA1 on trials in the large cylinder (Trial 1: F(2, 243) = 3.45, P < 0.05; Trial 3: F(2, 243) = 5.47, P = 0.005; Fig. 3C). There was also a significant correlation between spatial coherence and proximodistal position (Trial 1: r(244) = − 0.149, P < 0.05; Trial 3: r(244) = − 0.158, P = 0.01). No difference was present in the small environment (F(2,162) = 0.45, P > 0.60; r(165) = − 0.125, P > 0.10). Stability, expressed as the correlation between firing in corresponding bins of the large cylinder on Trials 1 and 3, was slightly higher in proximal and intermediate CA1 than in distal CA1 (F(2,243) = 7.98, P < 0.001; proximal vs. distal: t(154) = 3.90, P < 0.001; intermediate vs. distal: t(154) = 2.42, P < 0.05; Fig. 3C), as expected if place fields get noisier towards the distal end of the subfield. The correlation between stability and proximodistal position was significant (r(244) = 0.272, P < 0.001). The change in peak firing rate from Trial 1 to Trial 3 for the firing field with the highest rate on Trial 1 was significantly larger in proximal CA1 than intermediate and distal CA1 (proximal: absolute change of 3.89 ± 0.39 Hz; intermediate: 2.80 ± 0.35 Hz; distal 2.38 ± 0.27 Hz; F(2,145) = 4.31, P = 0.02).
The decrease in spatial information and coherence between proximal and distal CA1 was accompanied by an increase in the number of firing fields (Fig. 4 and 5; Supplementary Fig. 2B and 3). Place fields were defined from smoothed rate maps as contiguous regions of 9 or more 5 cm × 5 cm bins in which (i) the firing rate exceeded 20% of the cell’s peak rate and (ii) the peak rate of the area was higher than 0.25 Hz. Following this criterion, the percentage of place cells with only one firing field in the large cylinder was significantly higher in proximal and intermediate CA1 than in distal CA1 (Trial 1: 57.0% and 56.7% vs. 33.8%; Trial 3: 53.2% and 55.6% vs. 29.9%; proximal vs. distal: Z > 2.91, P < 0,005; intermediate vs. distal: Z > 2.96, P < 0,005; proximal vs. intermediate: Z < 0.31, P > 0.30; Fig. 3 and 4). There was also a significant increase from proximal to distal in the mean number of firing fields per cell (Trial 1: 1.57 ± 0.08 and 1.57 ± 0.08 for proximal and intermediate CA1 vs. 2.13 ± 0.14 for distal CA1, F(2, 243) = 10.1, P < 0.001; Trial 3: 1.63 ± 0.09 and 1.59 ± 0.08 vs. 2.29 ± 0.13, respectively, F(2, 243) = 14.5, P < 0.001). The number of fields was significantly higher in the distal band than both the proximal and intermediate bands (Trial 1: t(154) = 3.54 and t(165) = 3.72, respectively, both P < 0.001; Trial 3: t(154) = 4.10 and t(165) = 4.65, both P < 0.001). There was a significant correlation between proximodistal recording position and the number of firing fields (Trial 1: r(244) = 0.238, P < 0.001; Trial 3: r(244) = 0.259, P < 0.001). A similar but numerically smaller gradient was observed in the small cylinder (F(2, 162) = 7.64, P < 0.001; r(165) = 0.271, P < 0.001; proximal vs. distal: t(105) = 3.24, P < 0.005; intermediate vs. distal: t(115) = 2.82, P < 0.01; Supplementary Fig. 2). The increase in the number of firing fields was robust against variations in parameters used to define place fields, such as minimum number of bins in the field, minimum rate for inclusion of a bin in the field, and minimum peak rate in the field (Fig. 5B). There was no significant difference in the size of place fields in the distal and proximal bands (proximal: 2208 ± 146 cm2; intermediate: 2688 ± 195 cm2; distal: 1931 ± 137 cm2; distal vs. proximal: t(286) = 1.31, P = 0.19; all fields of all cells on Trial 1; similar results were obtained on Trials 2 and 3). The analysis of field size should be interpreted with caution, however, as fields break up when spatial coherence is reduced.
Figure 4.
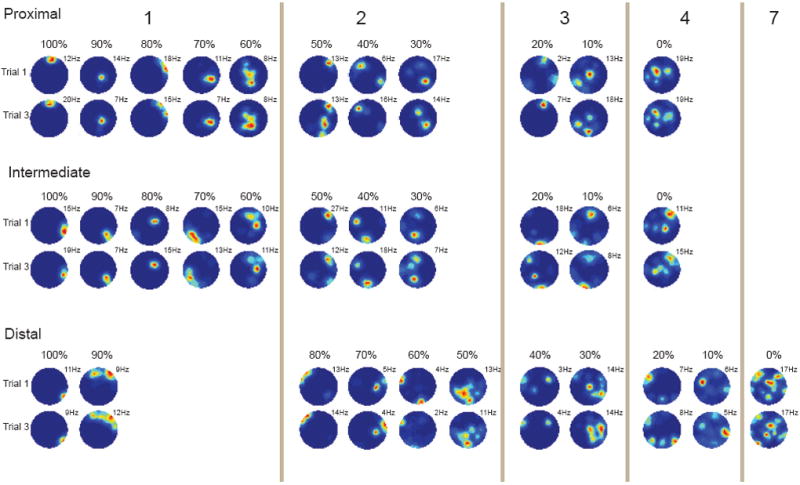
Distal CA1 cells have a larger number of firing fields than more proximal CA1 cells. Each pair of rows shows 11 representative cells from the large box (upper row of each panel, trial 1; bottom row, trial 3). The total cell sample in each CA1 band was ranked first by number of place fields; cells with similar numbers were then ranked by spatial information scores. Every 10th percentile of each distribution is shown, starting from 100% (lowest number of place fields and largest spatial information score) and ending at 0% (largest number of place fields and lowest spatial information). Peak rates (Hz) are indicated. Red indicates maximum firing rate, dark blue is zero firing. The number of fields counted by the place-field algorithm is indicated at the top (1 to 7). Note the low number of cells with a single confined firing field in distal CA1.
Figure 5.

Counts of place fields along the proximodistal axis of CA1. (A) Distribution of cells with 1 to 7 place fields in the large cylinder. Left to right: proximal, intermediate, and distal CA1. Black bars: trial 1; white: trial 3. *, P < 0.05; **, P < 0.01; ***, P < 0.001. The distal CA1 distribution is skewed towards larger numbers of firing fields than the proximal and intermediate distributions. (B) Number of place fields in proximal, intermediate and distal CA1 estimated with different definitions of place fields. Three parameters were systematically adjusted to detect place fields: (i) the rate threshold for inclusion of a bin in the place field (percent of peak rate; 10% or 20%), (ii) the minimum number of bins in the place field (5, 9, or 12 bins), and (iii) the minimum peak rate of the field (0.1 Hz, 0.25 Hz, or 0.5 Hz). *, P < 0.05; **, P < 0.01; ***, P < 0.001. Trials 1 and 3 are shown separately (upper and lower row). The difference between proximal, intermediate and distal CA1 is evident with most parameter settings. With looser criteria (lower rate threshold in particular), the difference is reduced.
Rate changes along the proximodistal axis of CA1
Changes in spatial context may exert a greater impact on ensemble formation in proximal parts of CA1 than in distal parts. We tested this by comparing, in each CA1 band, the similarity of the active cell population in the small and large cylinder environments. ‘Overlap’ between the active populations was calculated by dividing for each cell the mean firing rate in the less active environment by the mean rate in the more active environment and averaging these ratios across the population (Leutgeb et al., 2004). In all CA1 bands, the overlap between the firing rate distributions in the small and large cylinder (from 0.324 to 0.515) was significantly lower than between repeated trials in the large cylinder (from 0.675 to 0.717). The reduction was larger in proximal and intermediate CA1 than in distal CA1 (proximal: 0.324 ± 0.035 between small and large cylinder vs. 0.675 ± 0.022 between repeated trials in the large cylinder; intermediate: 0.361 ± 0.031 vs. 0.717 ± 0.023, respectively; distal: 0.515 ± 0.038 vs. 0.690 ± 0.025, respectively; F(2,243) = 6.460, P < 0.005; proximal vs. distal: t(154) = 3.05, P < 0.005; intermediate vs. distal: t(165) = 3.18, P < 0.005; proximal vs. intermediate: t(167) = 0.34, P > 0.70). There was no significant difference in overlap between any of the CA1 bands on repeated trials in the large cylinder (F(2,243) = 1.27, P > 0.28). Taken together, these findings suggest that proximal CA1 cells are more affected than distal CA1 cells by changes in the spatial environment.
Proximodistal differences in phase-locking with theta rhythms in MEC
CA1 theta rhythms are partially driven by inputs from the entorhinal cortex (Buzsaki, 2002), and theta phase plays an important role in spatial coding in both the hippocampus (O’Keefe and Recce, 1993) and the medial entorhinal cortex (Hafting et al., 2008). Thus, theta rhythms in MEC may be involved in enhancing spatial specificity of place cell codes in proximal CA1. If so, MEC theta rhythms would be expected to modulate spiking activity more strongly in proximal CA1 than in distal CA1. We tested this hypothesis by assessing MEC theta phase-locking of spikes from proximal, intermediate, and distal CA1 cells in a separate set of animals (Fig. 6; the animals were from Colgin et al., 2009). As predicted, cell firing in proximal CA1 was most strongly modulated by MEC theta phase. Mean vector lengths for MEC theta phase distributions for all recorded CA1 cells were significantly higher in the proximal group than in the distal group (F(2,35) = 4.56, P < 0.02). Also, the proportion of cells that were significantly phase-locked to MEC theta was significantly higher in proximal CA1 than in distal CA1 (100% of proximal cells vs. 77% of distal cells; likelihood ratio chisquare with 1 degree of freedom = 3.77, P < 0.05). There was a strong proximodistal gradient in spatial tuning also in this group of animals. Proximal CA1 cells had higher spatial information scores (t(20) = 4.48, P < 0.001), higher spatial coherence (t(20) = 2.68, P < 0.05) and higher spatial correlation between the first and second half of the trial (t(20) = 4.48, P = 0.05) than distal CA1 cells. The difference in the number of firing fields did not reach significance (means of 1.2 and 1.7 in proximal and distal CA1, respectively; t(20) = 7.67, P = 0.11); however, note that the recording box was small and that the smaller box was less sensitive to proximodistal position also in the main study.
Figure 6.

Phase-locking of cell activity along the proximodistal axis of CA1 to theta waves in MEC. (A) Relationship between CA1 spike times and MEC theta phase. Left: Spike times for example cells from proximal, intermediate, and distal CA1 are shown (in red) superimposed on theta frequency bandpass (5-12 Hz) filtered signals simultaneously recorded from layer III of MEC. The y-axis (negative up) calibration bars indicate 25 μV for proximal and distal traces and 50 μV for the intermediate trace; the x-axis bars indicate 200 ms. Each trace is 2 seconds long. Many spikes in all three areas occur near the theta trough, but spikes in distal CA1 have the greatest tendency to occur at other theta phases. Right: Distributions of proximal, intermediate, and distal CA1 spike times across phases of theta in layer III of MEC (means ± S.E.M.). Proximal CA1 cells exhibit strong phase-locking to MEC theta, intermediate CA1 cells exhibit moderate phase-locking, and distal CA1 cells exhibit weaker phase-locking. (B) Left: Mean vector lengths for theta phases corresponding to spike times from proximal, intermediate, and distal CA1 (means ± S.E.M.). Right: Percentages of significantly phase-locked cells along the proximodistal axis of CA1. *, P < 0.05.
Discussion
We have shown that space is represented non-uniformly along the transverse axis of CA1. Pyramidal cells in the proximal part, near the CA2 border, carried more spatial information and had smoother firing fields than pyramidal cells in the distal part. The graded nature of the place-cell signal was most prominent in large spaces. Most cells in the proximal part had a single firing field in the 2 m-wide open arena. Distal cells also had place fields but generally fired at more than one location and with lower spatial coherence. In addition, proximal but not distal cells were shown to exhibit strong phase-locking to theta activity in MEC, suggesting that cells in this region of CA1 are receptive to signals from theta-modulated, space-coding cells in MEC.
The loss of spatial information from proximal to distal CA1 mirrors the decline in spatial coherence previously reported from distal to proximal subiculum (Sharp and Green, 1994), although the change of spatial signal is markedly less visible in the subiculum due to the noisy firing fields of cells in this region. The gradients in spatial tuning in CA1 and subiculum are consistent with the projection profile of layer III cells in MEC (Tamamaki and Nojyo, 1995; Witter et al., 2000; Naber et al., 2001). MEC neurons provide proximal CA1 cells and distal subiculum cells with regularly updated information about the rat’s location in the local environment (Hafting et al., 2005; Moser et al., 2008) and this information is likely critical for generating accurate place representations in proximal CA1 (McNaughton et al., 2006; Solstad et al., 2006). How the proximodistal gradient affects global hippocampal functions like navigation remains to be determined, however.
Our findings further suggest that the accuracy of spatial representations in proximal CA1 may be enhanced by theta inputs from MEC. During foraging and running, theta rhythms are stronger in MEC than in LEC, and MEC neurons fire phase-locked to theta more than LEC neurons (Deshmukh et al., 2010). MEC theta oscillations may temporally coordinate the position, direction, and speed signals that are conveyed to CA1 by the network of grid, head direction, and conjunctive cells in layer III of MEC (Sargolini et al., 2006). Coordination of these signals may be required in order for animals to track their location as they move away from landmarks (‘path integration’). The lack of strongly coordinated firing of distal CA1 cells by MEC theta may help explain why differences in spatial tuning between proximal and distal CA1 were more pronounced in large open spaces, where opportunities for realignment at the boundaries of the environment are less.
The change in spatial information along the proximodistal axis was consistent but modest. Even the most distal CA1 cells had clearly identifiable, stable firing locations, although the firing fields of these cells were generally not as circumscribed as those of the proximal cells. The presence of spatial firing fields in a CA1 region that lacks direct input from MEC points to a role also for alternative pathways in maintaining localized firing. One candidate pathway is the intrahippocampal circuit through CA3. The possibility of an intrahippocampal contribution receives support from the fact that CA1 cells suffer moderate but not complete loss of spatial information when direct entorhinal inputs are removed by cytotoxic lesions in layer III of MEC (Brun et al., 2008). Some loss of spatial signal in CA1 is also observed after disruption of CA3-to-CA1 connections (Brun et al., 2002), suggesting that spatial information may be carried to CA1 both directly through the perforant path and indirectly through the intrahippocampal circuit. The presence of a dual pathway from spatial cells in MEC to place cells in CA1 would be consistent with the observation that gamma-oscillating CA1 cells synchronize with both CA3 and MEC but at different phases of the theta rhythm (Colgin et al., 2009). These considerations do not, however, rule out the possibility that some of the spatial information in distal CA1 cells may be derived from other sources, such as LEC. Many LEC cells have weak but stable spatial firing preferences (Hargreaves et al., 2005), which may be sufficient to generate spatial firing in their target neurons (Si and Treves, 2009). The persistence of spatial firing in distal CA1 cells after lesions of CA3 (Brun et al., 2002) is consistent with such a contribution.
The graded nature of location-specific firing along the transverse CA1 axis provides a possible explanation of variations in firing properties between studies of CA1 cells in freely behaving animals. Early studies reported considerable variation in the sensitivity of hippocampal firing to non-spatial properties of the environment such as odour, texture and timing relationships. CA1 cells were reported to respond strongly to such factors under conditions where space is not relevant to task performance (Hampson et al., 1993; Wood et al., 1999; Leutgeb et al., 2005a) but the reliability of these observations and their interpretation were questioned (e.g., O’Keefe, 1999). By introducing proximodistal location as a possible determinant of firing properties, the present findings raise the possibility that non-spatial information about context or objects, conveyed through the perirhinal and lateral entorhinal cortices (Zhu et al., 1995, Suzuki et al., 1997; Young et al., 1997; Naber et al., 1999), is expressed more strongly in the distal part of CA1 than in the proximal part.
Experimental procedures
Subjects
Seven male Long Evans rats were used in the main experiment. In addition, six rats were used for analysis of phase-locking between CA1 cells and theta activity in MEC; data from these rats were collected for a previous study in which the phase relationship to entorhinal theta activity was not reported (Colgin et al., 2009). All animals were 3-5 months old (350-450 g) at the time of implantation. After surgery, they were housed individually in large plexiglass cages (45 × 44 × 30 cm) in a humidity and temperature-controlled environment. They were kept on a 12-h light/12-h dark schedule. All testing occurred during the dark phase. The experiments were performed in accordance with the Norwegian Animal Welfare Act and the European Convention for the Protection of Vertebrate Animals used for Experimental and Other Scientific Purposes.
Surgery and electrode preparation
Tetrodes were constructed from four 17 μm polyimide-coated platinum-iridium (90% - 10%) wires (California Fine Wire Company). Electrode tips were plated with platinum to reduce electrode impedances to between 120-200 kΩ at 1 kHz.
The 7 animals in the main study were food deprived 12 h before surgery started. Anesthesia was induced by placing the animal in a closed glass box filled with isoflurane vapor. The animal then received an i.p. injection of Equithesin (pentobarbital and chloral hydrate; 1.0 mL/ 250 g body weight). Supplementary doses were given when breathing and reflexes changed (0,15 mL/250g). Local anesthetic (Xylocain) was applied on the skin before making the incision. The rats were then implanted with a ‘hyperdrive’ consisting of 14 independently movable tetrodes (Wilson and McNaughton, 1993). The tetrodes were inserted above the right hippocampus (AP from 3.8 to 4.4 mm, ML from 1.9 to 3.0 mm relative to bregma). The shape of the tetrode bundle was adjusted to cover as much of the proximodistal axis of CA1 as possible. In 3 rats, the hyperdrive consisted of two circular tetrode bundles, separated by 1.6 mm and each containing 6 or 8 independently movable tetrodes. The diameters of the bundles were 1.0 and 1.2 mm, respectively. In 4 rats, the hyperdrive consisted of two 2.5 mm long rows of 7 tetrodes each, separated by 0.3 - 0.4 mm. Jewellers’ screws and dental cement were used to secure the hyperdrive to the skull. Two screws in the skull were connected to hyperdrive ground. The six animals used for the phase-locking analysis received implants of hyperdrives with two bundles (2 animals), or a dual set of microdrives (4 animals), enabling simultaneous recording from CA1 and MEC. Tetrode placements in CA1 were in the same proximodistal zone (proximal, intermediate, distal) within animals; i.e., parallel recordings across the proximodistal axis were not obtained in this part of the study. Surgical procedures for these six animals are described in Colgin et al. (2009).
Recording procedures
Over the course of ~2-3 weeks, the tetrodes were lowered in steps of 50 μm or less until large-amplitude theta-modulated complex-spike activity appeared at depths of about 2.0 mm or lower. In the main experiment, two of the tetrodes were used, respectively, to record a reference signal from the corpus callosum and an EEG signal from the stratum lacunosum-moleculare. The hyperdrive was connected to a multichannel, impedance matching, unity gain headstage. The output of the headstage was conducted via a lightweight multiwire tether cable and through an 82-channel slip-ring commutator to a data acquisition system containing 64 digitally programmable amplifiers (Neuralynx, Tucson, AZ, USA; Neuralynx Cheetah 64 for 4 rats; Neuralynx Digital Lynx for 3 rats). Unit activity was amplified by a factor of 3000-5000 and bandpass filtered from 600-6000 Hz. Spike waveforms above a threshold set by the experimenter (~55 μV) were time-stamped and digitized at 32 kHz for 1ms. EEG signals, 1 per tetrode, were amplified by a factor of 1000 and recorded continuously between 0 and 475 Hz at a sampling rate of 1893 Hz or 2034 Hz. The EEG channels were recorded differentially against a common reference electrode placed in an electrically silent region in the corpus callosum or above. Light emitting diodes (LEDs) on the headstage were used to track the animal’s movements in the cylinders at a sampling rate of 50 Hz. The rat rested on a towel in a large flower pot on a pedestal while electrical activity was monitored. Recording procedures for the phase-locking experiment are described in Colgin et al. (2009).
Behavioral procedures
The rats were kept at ~90 % of their free-feeding body weight and food deprived 12-18 h before each training or recording session. During the 2-3 weeks between surgery and testing, the animals in the main study were trained to collect randomly scattered vanilla or chocolate biscuit crumbs in two cylinder-shaped boxes, each with a black floor mat and a black wall. The box diameters were 200 cm and 100 cm. Both cylinders had 50 cm high walls. A white polarizing cue (50 × 45 cm) was fixed to each wall at similar azimuth. The boxes were not encircled by curtains. Each training and recording session consisted of 3 trials separated by 5 min or more. Trials 1 and 3 were conducted in the large cylinder, trial 2 in the small cylinder. Recordings in the large box lasted 25 min or occasionally more; in the small box, the minimum duration was 10 min. The floor mat was washed between successive trials. Before and between trials, the rat rested in the flower pot on the pedestal next to the recording box. Data were recorded also while the rat rested. The animals in the phase-locking study were trained in small circular or square boxes or on a linear track (see Colgin et al., 2009). Data from all environments were used for tests of phase-locking whereas only data from the boxes were used for analysis of place fields.
Spike sorting and cell classification
Spike sorting was performed offline using graphical cluster-cutting software (MClust, A.D. Redish; Supplementary Fig. 1). Clustering was performed manually in two-dimensional projections of the multidimensional parameter space (consisting of waveform amplitudes and waveform energies), using autocorrelation and crosscorrelation functions as additional separation tools and separation criteria. All trials on a given day, including resting trials with sleep, were clustered in a single analysis. Cluster separation was estimated by calculating distances, in Mahalonobis space, between clustered spikes from different cells on the same tetrode (Schmitzer-Torbert et al., 2003). Putative excitatory cells were distinguished from putative interneurons using differences in spike width, average rate and complex-spike bursting.
Rate maps and place fields
Position estimates were based on tracking of the LEDs on the head stage connected to the hyperdrive. All data were speed-filtered; only epochs with instantaneous running speeds of 5 cm/s or more were included.
To characterize firing fields, the position data were sorted into 5 cm × 5 cm bins. The path was smoothed with a 21-sample boxcar window filter (400 ms; 10 samples on each side). Firing rate distributions were then determined by counting the number of spikes in each bin as well as the time spent per bin. Maps for number of spikes and time were smoothed individually using a boxcar average over the surrounding 5 × 5 bins. Weights were distributed as follows:
An adaptive smoothing method, introduced by Skaggs et al. (1996), was used before quantitative assessment of spatial tuning in order to optimize the trade-off between blurring error and sampling error. The raw data were first divided into bins of 5 cm × 5cm, as above. Then the firing rate at each point in the environment was estimated by expanding a circle around the point until
where r is the radius of the circle in bins, n is the number of occupancy samples within the circle, s is the total number of spikes in those occupancy samples, and the constant α is set to 10000. With a position sampling rate of 50 Hz, the firing rate at that point was then set to 50 · s/n. The peak firing rate of an individual cell was taken to be the maximum value in the smoothed rate map. Adaptive smoothing was also applied before calculation of spatial information, peak rate, spatial correlation, and number of place fields.
Spatial information rate (bits/s) was calculated as
where λi is the mean firing rate of a unit in the i-th bin, λ is the overall mean firing rate, and pi is the probability of the animal being in the i-th bin (occupancy in the i-th bin / total recording time; Skaggs et al., 1993). Spatial coherence was estimated as the first order spatial autocorrelation of the unsmoothed place field map, i.e. the mean correlation between the firing rate of each bin and the averaged firing rate in the 8 adjacent bins (Muller and Kubie, 1989). The spatial correlation between consecutive trials in the same enclosure was estimated for each cell by correlating the rates of firing in corresponding bins of the pair of smoothed rate maps. In-field changes in firing rate were estimated by calculating the difference between Trials 1 and 3 in the peak rate of the field with the highest rate on Trial 1. Fields were only compared if the peak firing locations on the two trials were less than 20 cm apart.
A place field was estimated as a contiguous region of at least 225 cm2 (9 or more 5 cm × 5 cm bins) where the firing rate was above 20% of the peak rate and the peak firing rate of the area was 0.25 Hz or higher (Fig. 5). The number of non-overlapping place fields was estimated for each cell. Place field analyses were only conducted for cells with 100 spikes or more in the large cylinder and 50 spikes or more in the small cylinder. Clusters with average peak-to-trough waveform durations of less than 200 μs on the electrode with the largest amplitude were considered putative interneurons or axons of bypassing axons and not included in the analysis.
Theta rhythm and phase-locking
Theta phase values in MEC at the times of spike occurrence in CA1 were estimated using simultaneous recordings from CA1 and layer III of MEC (Fig. 6). Theta phase estimates were obtained by bandpass (5-12 Hz) filtering the MEC EEG recording off-line, performing a Hilbert transform on the filtered signal, and extracting the phase component at the CA1 spike times. CA1 cells were considered to be significantly phase-locked to MEC theta if their phase distribution differed significantly from uniform (P < 0.05, Rayleigh test).
Histology and tetrode placement
The rats received an overdose of Equithesin and were perfused intracardially with saline followed by 4 % formaldehyde. The brains were extracted and stored in formaldehyde, and frozen coronal sections (30 μm) were cut and stained with cresyl violet (Nissl). Each section through the relevant part of the hippocampus was collected for analysis. All tetrodes of the 14-tetrode bundle were identified from digital photomicrographs, acquired with a Zeiss Axoimager-Z1 microscope equipped with a digital camera. Photomicrographs were saved and calibrated using AxioVision. The location of the tip of each electrode was determined by comparison of tetrode traces on successive sections.
The proximodistal position of tetrodes in CA1 was estimated by creating, for each animal, a three dimensional reconstruction of the hippocampus, using Neurolucida (Microbrightfield Bioscience, Williston, VT, USA). CA1 was then divided into three equally broad longitudinal bands between CA2 on the anterior and lateral side and subiculum on the posterior and medial side (Fig. 1B). The bands were defined as proximal, intermediate, and distal CA1, respectively, and tetrodes were allocated to one of the bands. Bands were defined by an observer blind to the electrode positions (M.P.W.).
Seven tetrodes in the fasciola cinereum, medial to the CA1, were not included in any analyses. Fasciola cinereum (the subcallosal hippocampal rudiment) is the medially curved continuation of the hippocampus at the septal tip of the structure that continues near the midline along the dorsal one-third of the CA1 (Stephan, 1975). Tetrodes in the subiculum were also not used. The latter tetrodes (13 in total) were initially implanted to characterize proximodistal gradients in the subiculum but the very low spatial signal of subiculum cells in the 2-m cylinder precluded further investigation of the issue.
Supplementary Material
Acknowledgments
We thank T. Kirkesola, S. Leutgeb, L. Lu, and H. Stensland for advice or help with data acquisition, and A.M. Amundgård, K. Haugen, K. Jenssen, E. Kråkvik, R. Skjerpeng, and H. Waade for technical assistance. The work was supported by the Kavli Foundation, a Centre of Excellence grant from the Norwegian Research Council, AG012609, and the McKnight Brain Research Foundation.
Footnotes
Publisher's Disclaimer: This is a PDF file of an unedited manuscript that has been accepted for publication. As a service to our customers we are providing this early version of the manuscript. The manuscript will undergo copyediting, typesetting, and review of the resulting proof before it is published in its final citable form. Please note that during the production process errors may be discovered which could affect the content, and all legal disclaimers that apply to the journal pertain.
References
- Ahmed OJ, Mehta MR. The hippocampal rate code: anatomy, physiology and theory. Trends Neurosci. 2009;32:329–338. doi: 10.1016/j.tins.2009.01.009. [DOI] [PMC free article] [PubMed] [Google Scholar]
- Andersen P, Bliss TVP, Skrede KK. Lamellar organization of hippocampal excitatory pathways. Exp Brain Res. 1971;13:222–238. doi: 10.1007/BF00234087. [DOI] [PubMed] [Google Scholar]
- Bostock E, Muller RU, Kubie JL. Experience-dependent modifications of hippocampal place cell firing. Hippocampus. 1991;1:193–205. doi: 10.1002/hipo.450010207. [DOI] [PubMed] [Google Scholar]
- Brun VH, Leutgeb S, Wu HQ, Schwarcz R, Witter MP, Moser EI, Moser M-B. Impaired spatial representation in CA1 after lesion of direct input from entorhinal cortex. Neuron. 2008;57:290–302. doi: 10.1016/j.neuron.2007.11.034. [DOI] [PubMed] [Google Scholar]
- Brun VH, Otnass MK, Molden S, Steffenach HA, Witter MP, Moser MB, Moser EI. Place cells and place recognition maintained by direct entorhinal-hippocampal circuitry. Science. 2002;296:2243–2246. doi: 10.1126/science.1071089. [DOI] [PubMed] [Google Scholar]
- Buzsaki G. Theta oscillations in the hippocampus. Neuron. 2002;33:325–340. doi: 10.1016/s0896-6273(02)00586-x. [DOI] [PubMed] [Google Scholar]
- Colgin LL, Denninger T, Fyhn M, Hafting T, Bonnevie T, Jensen O, Moser M-B, Moser EI. Frequency of gamma oscillations routes flow of information in the hippocampus. Nature. 2009;462:353–357. doi: 10.1038/nature08573. [DOI] [PubMed] [Google Scholar]
- Deshmukh SS, Yoganarasimha D, Voicu H, Knierim JJ. Theta modulation in the medial and lateral entorhinal cortex. J Neurophysiol. 2010;104:994–1006. doi: 10.1152/jn.01141.2009. [DOI] [PMC free article] [PubMed] [Google Scholar]
- Frank LM, Brown EN, Wilson M. Trajectory encoding in the hippocampus and entorhinal cortex. Neuron. 2000;27:169–178. doi: 10.1016/s0896-6273(00)00018-0. [DOI] [PubMed] [Google Scholar]
- Fyhn M, Molden S, Witter MP, Moser EI, Moser MB. Spatial representation in the entorhinal cortex. Science. 2004;305:1258–1264. doi: 10.1126/science.1099901. [DOI] [PubMed] [Google Scholar]
- Hafting T, Fyhn M, Bonnevie T, Moser MB, Moser EI. Hippocampus-independent phase precession in entorhinal grid cells. Nature. 2008;453:1248–1252. doi: 10.1038/nature06957. [DOI] [PubMed] [Google Scholar]
- Hafting T, Fyhn M, Molden S, Moser MB, Moser EI. Microstructure of a spatial map in the entorhinal cortex. Nature. 2005;436:801–806. doi: 10.1038/nature03721. [DOI] [PubMed] [Google Scholar]
- Hampson RE, Heyser CJ, Deadwyler SA. Hippocampal cell firing correlates of delayed-match-to-sample performance in the rat. Behav Neurosci. 1993;107:715–739. doi: 10.1037//0735-7044.107.5.715. [DOI] [PubMed] [Google Scholar]
- Hargreaves EL, Rao G, Lee I, Knierim JJ. Major dissociation between medial and lateral entorhinal input to dorsal hippocampus. Science. 2005;308:1792–1794. doi: 10.1126/science.1110449. [DOI] [PubMed] [Google Scholar]
- Knierim JJ, Lee I, Hargreaves EL. Hippocampal place cells: parallel input streams, subregional processing, and implications for episodic memory. Hippocampus. 2006;16:755–764. doi: 10.1002/hipo.20203. [DOI] [PubMed] [Google Scholar]
- Leutgeb S, Leutgeb JK, Treves A, Moser M-B, Moser EI. Distinct ensemble codes in hippocampal areas CA3 and CA1. Science. 2004;305:1295–1298. doi: 10.1126/science.1100265. [DOI] [PubMed] [Google Scholar]
- Leutgeb S, Leutgeb JK, Barnes CA, Moser EI, McNaughton BL, Moser MB. Independent codes for spatial and episodic memory in hippocampal neuronal ensembles. Science. 2005a;309:619–623. doi: 10.1126/science.1114037. [DOI] [PubMed] [Google Scholar]
- Leutgeb JK, Leutgeb S, Treves A, Meyer R, Barnes CA, McNaughton BL, Moser MB, Moser EI. Progressive transformation of hippocampal neuronal representations in “morphed” environments. Neuron. 2005b;48:345–358. doi: 10.1016/j.neuron.2005.09.007. [DOI] [PubMed] [Google Scholar]
- Markus EJ, Qin YL, Leonard B, Skaggs WE, McNaughton BL, Barnes CA. Interactions between location and task affect the spatial and directional firing of hippocampal neurons. J Neurosci. 1995;15:7079–7094. doi: 10.1523/JNEUROSCI.15-11-07079.1995. [DOI] [PMC free article] [PubMed] [Google Scholar]
- McNaughton BL, Battaglia FP, Jensen O, Moser EI, Moser M-B. Path-integration and the neural basis of the ‘cognitive map’. Nat Neurosci Reviews. 2006;7:663–678. doi: 10.1038/nrn1932. [DOI] [PubMed] [Google Scholar]
- Moser EI, Moser M-B. A metric for space. Hippocampus. 2008;18:1142–1156. doi: 10.1002/hipo.20483. [DOI] [PubMed] [Google Scholar]
- Moser EI, Kropff E, Moser EI. Place cells, grid cells, and the brain’s spatial representation system. Annu Rev Neurosci. 2008;31:69–89. doi: 10.1146/annurev.neuro.31.061307.090723. [DOI] [PubMed] [Google Scholar]
- Muller RU, Kubie JL. The effects of changes in the environment on the spatial firing of hippocampal complex-spike cells. J Neurosci. 1987;7:1951–1968. doi: 10.1523/JNEUROSCI.07-07-01951.1987. [DOI] [PMC free article] [PubMed] [Google Scholar]
- Muller RU, Kubie JL. The firing of hippocampal place cells predicts the future position of freely moving rat. J Neurosci. 1989;9:4101–4110. doi: 10.1523/JNEUROSCI.09-12-04101.1989. [DOI] [PMC free article] [PubMed] [Google Scholar]
- Naber PA, Lopes da Silva FH, Witter MP. Reciprocal connections between the entorhinal cortex and hippocampal fields CA1 and the subiculum are in register with the projections from CA1 to the subiculum. Hippocampus. 2001;11:99–104. doi: 10.1002/hipo.1028. [DOI] [PubMed] [Google Scholar]
- Naber PA, Witter MP, Lopez da Silva FH. Perirhinal cortex input to the hippocampus in the rat: evidence for parallel pathways, both direct and indirect. A combined physiological and anatomical study. Eur J Neurosci. 1999;11:4119–4133. doi: 10.1046/j.1460-9568.1999.00835.x. [DOI] [PubMed] [Google Scholar]
- O’Keefe J. Place units in the hippocampus of the freely moving rat. Exp Neurol. 1976;51:78–109. doi: 10.1016/0014-4886(76)90055-8. [DOI] [PubMed] [Google Scholar]
- O’Keefe J. Do hippocampal pyramidal cells signal non-spatial as well as spatial information? Hippocampus. 1999;9:352–364. doi: 10.1002/(SICI)1098-1063(1999)9:4<352::AID-HIPO3>3.0.CO;2-1. [DOI] [PubMed] [Google Scholar]
- O’Keefe J, Dostrovsky J. The hippocampus as a spatial map. Preliminary evidence from unit activity in the freely-moving rat. Brain Research. 1971;34:171–175. doi: 10.1016/0006-8993(71)90358-1. [DOI] [PubMed] [Google Scholar]
- O’Keefe J, Recce ML. Phase relationship between hippocampal place units and the EEG theta rhythm. Hippocampus. 1993;3:317–330. doi: 10.1002/hipo.450030307. [DOI] [PubMed] [Google Scholar]
- Olypher AV, Lansky P, Fenton AA. Properties of the extra-positional signal in hippocampal place cell discharege derived from the overdispersion in location-specific firing. Neurosci. 111:553–566. doi: 10.1016/s0306-4522(01)00586-3. [DOI] [PubMed] [Google Scholar]
- Sargolini F, Fyhn M, Hafting T, McNaughton BL, Witter MP, Moser MB, Moser EI. Conjunctive representation of position, direction, and velocity in entorhinal cortex. Science. 2006;312:758–762. doi: 10.1126/science.1125572. [DOI] [PubMed] [Google Scholar]
- Schmitzer-Torbert N, Jackson J, Henze D, Harris K, Redish AD. Quantitative measures of cluster quality for use in extracellular recordings. Neuroscience. 2005;131:1–11. doi: 10.1016/j.neuroscience.2004.09.066. [DOI] [PubMed] [Google Scholar]
- Sharp PE, Green C. Spatial correlates of firing patterns of single cells in the subiculum of the freely moving rat. J Neurosci. 1994;14:2339–2356. doi: 10.1523/JNEUROSCI.14-04-02339.1994. [DOI] [PMC free article] [PubMed] [Google Scholar]
- Si B, Treves A. The role of competitive learning in the generation of DG fields from EC inputs. Cogn Neurodyn. 2009;3:177–187. doi: 10.1007/s11571-009-9079-z. [DOI] [PMC free article] [PubMed] [Google Scholar]
- Skaggs WE, McNaughton BL, Gothard KM, Markus EJ. An information-theoretic approach to deciphering the hippocampal code. In: Hanson SJ, Cowan JD, Giles CL, editors. Advances in Neural Processing Systems. Vol. 5. San Mateo: Morgan Kaufmann; 1993. pp. 1030–1037. [Google Scholar]
- Skaggs WE, McNaughton BL, Wilson MA, Barnes CA. Theta phase precession in hippocampal neuronal populations and the compression of temporal sequences. Hippocampus. 1996;6:149. doi: 10.1002/(SICI)1098-1063(1996)6:2<149::AID-HIPO6>3.0.CO;2-K. [DOI] [PubMed] [Google Scholar]
- Solstad T, Boccara CN, Kropff E, Moser M-B, Moser EI. Representation of geometric borders in the entorhinal cortex. Science. 2008;322:1865–1868. doi: 10.1126/science.1166466. [DOI] [PubMed] [Google Scholar]
- Solstad T, Moser EI, Einevoll GT. From grid cells to place cells: a mathematical model. Hippocampus. 2006;16:1026–1031. doi: 10.1002/hipo.20244. [DOI] [PubMed] [Google Scholar]
- Stephan H. Handbuch der Mikroskopischen Anatomie des Menschen. Springer-Verlag; Berlin: 1975. Allocortex. [Google Scholar]
- Suzuki WA, Miller EK, Desimone R. Object and place memory in the macaque entorhinal cortex. J Neurophysiol. 1997;78:1062–1081. doi: 10.1152/jn.1997.78.2.1062. [DOI] [PubMed] [Google Scholar]
- Tamamaki N, Nojyo Y. Preservation of topography in the connections between the subiculum, field CA1, and the entorhinal cortex in rats. J Comp Neurol. 1995;353:379–390. doi: 10.1002/cne.903530306. [DOI] [PubMed] [Google Scholar]
- Young BJ, Fox GD, Eichenbaum H. Correlates of hippocampal complex-spike cell activity in rats performing a nonspatial radial maze task. J Neurosci. 1994;14:6553–6563. doi: 10.1523/JNEUROSCI.14-11-06553.1994. [DOI] [PMC free article] [PubMed] [Google Scholar]
- Young BT, Otto T, Fox GD, Eichenbaum H. Memory representation within the parahippocampal region. J Neurosci. 1997;17:5183–5195. doi: 10.1523/JNEUROSCI.17-13-05183.1997. [DOI] [PMC free article] [PubMed] [Google Scholar]
- Wilson MA, McNaughton BL. Dynamics of the hippocampal ensemble code for space. Science. 1993;261:1055–1058. doi: 10.1126/science.8351520. [DOI] [PubMed] [Google Scholar]
- Witter MP, Amaral DG. Hippocampal Formation. In: Paxinos G, editor. The Rat Nervous System. 3 San Diego: Academic; 2004. pp. 637–703. [Google Scholar]
- Witter MP, Wouterlood FG, Naber PA, van Haeften T. Structural organization of the parahippocampal-hippocampal network. Ann New York Acad Sci. 2000;911:1–25. doi: 10.1111/j.1749-6632.2000.tb06716.x. [DOI] [PubMed] [Google Scholar]
- Wood ER, Dudchenko PA, Eichenbaum H. The global record of memory in hippocampal neuronal activity. Nature. 1999;397:613–616. doi: 10.1038/17605. [DOI] [PubMed] [Google Scholar]
- Wood ER, Dudchenko PA, Robitsek RJ, Eichenbaum H. Hippocampal neurons encode information about different types of memory episodes occurring in the same location. Neuron. 2000;27:623–633. doi: 10.1016/s0896-6273(00)00071-4. [DOI] [PubMed] [Google Scholar]
- Zhu XO, Brown MW, Aggleton JP. Neuronal signalling of information important to visual recognition memory in rat rhinal and neighbouring cortices. Eur J Neurosci. 1995;7:753–765. doi: 10.1111/j.1460-9568.1995.tb00679.x. [DOI] [PubMed] [Google Scholar]
Associated Data
This section collects any data citations, data availability statements, or supplementary materials included in this article.