

Abstract
Kinetic studies of biochemical reactions are typically carried out in a dilute solution that rarely contains anything more than reactants, products, and buffers. In such studies, mass-action-based kinetic models are used to analyze the progress curves. However, intracellular compartments are crowded by macromolecules. Therefore, we investigated the adequacy of the proposed generalizations of the mass-action model, which are meant to describe reactions in crowded media. To validate these models, we measured time-resolved kinetics for dansylamide binding to carbonic anhydrase in solutions crowded with polyethylene glycol and Ficoll. The measured progress curves clearly show the effects of crowding. The fractal-like model proposed by Savageau was used to fit these curves. In this model, the association rate coefficient ka allometrically depends on concentrations of reactants. We also considered the fractal kinetic model proposed by Schnell and Turner, in which ka depends on time according to a Zipf-Mandelbrot distribution, and some generalizations of these models. We found that the generalization of the mass-action model, in which association and dissociation rate coefficients are concentration-dependent, represents the preferred model. Other models based on time-dependent rate coefficients were inadequate or not preferred by model selection criteria.
Introduction
The steady-state and time-dependent kinetics of biochemical reactions are typically studied in buffered solutions that contain only reactants and products. In contrast, biochemical reactions in intracellular compartments occur in a medium crowded with macromolecules that are not part of a given reaction process. These macromolecules are barriers to diffusion, restrict reaction space, and represent excluded volume. The fact is that the vast majority of studies of both binding interactions and enzyme kinetics have been conducted under idealized, dilute conditions of the reactants in simple aqueous solutions, and the kinetic parameters thus determined have been presumed to be extrapolatable to the system's behavior intracellularly. Intuitively, this seems to be a questionable presumption.
Previous investigators (1–4) extensively studied reactions in media crowded by macromolecules in terms of equilibria. Other experimental and theoretical aspects of macromolecular crowding have also been considered (5–16). In particular, macroscopic models for time-resolved reaction kinetics in crowded media have been proposed (17–22). However, these models were not validated with experimental data, which motivated us to conduct the study presented here. In a recent review of the field, Elcock (15) pointed out that there is an urgent need to compare theoretical models with quantitative experimental data. Our work represents a step in that direction with regard to proposed theoretical macroscopic kinetic models.
Kozer et al. (9) and Phillip et al. (14) studied the effects of crowding on protein-protein binding kinetics and found that crowding had a small effect on the rate of association of protein complexes (14). However, these authors obtained association rate constants based on fitting data by the standard mass-action model. Here, we consider modified mass-action models that have been proposed to account for the effects of macromolecular crowding on binding kinetics (17–22). Then, by fitting to experimental data, we propose to validate those models.
In this study, we focus on the binding of dansylamide (DNSA) to carbonic anhydrase (CA). We chose this system because the progress curves can be measured by stopped-flow fluorescence techniques with a very high signal/noise ratio. The reaction has been assumed to follow a single-step binding mechanism (23,24), although at least one report suggested the presence of a fleeting intermediate followed by a stabilization step (25).
In the mass-action model (first published in 1864), the kinetics of the elementary binding reaction,
| (1) |
is described by the equation
| (2) |
where [A], [B], and [C] are concentrations of the reactants and the product, respectively. The rate coefficients ka and kd are assumed to be constants. The modified mass-action models attempt to describe the effects of crowding by assuming that the rate coefficients are functions of time or concentrations.
In the fractal-like kinetic model, which is based on the work of Kopelman and collaborators (26–29), Schnell and Turner (19) replaced the rate constant ka with a term that decreases with time in a fractal-like manner. It has the form of the Zipf-Mandelbrot temporal distribution ka = k/(t + τ)h, where 0 ≤ h < 1 and τ and k are positive constants. This model is based on the asymptotic expression for the number of sites on a fractal visited by a random walker until time t (21,22,30,31). The dissociation rate coefficient kd in this model is assumed to be a constant.
We previously showed by simulations and rigorous mathematical analysis that the Schnell-Turner model, for the reaction A + B ⇌ C, exhibits unexpected behavior: the product concentration [C] reaches a peak at a finite time and then decreases to zero in an asymptotic steady state (21,22). This model may thus be considered inherently deficient, as it seems unlikely that binding in crowded media involves the asymptotic disappearance of product. The experiments presented here do not indicate the latter behavior. However, the Schnell-Turner model may be further generalized by assuming that the dissociation rate coefficient is also time-dependent according to the Zipf-Mandelbrot distribution (22). The idea of time-dependent dissociation rate coefficients is supported by previous theoretical studies of diffusion-influenced reactions (32,33). In the case of the generalized Schnell-Turner model, one can obtain an asymptotic steady state with maximal concentration of the product (22), which is the expected, intuitive result.
Another approach for studying reaction kinetics in crowded media is based on a power-law approximation for biochemical system analysis developed by Savageau and Voit (34–36). Models based on the power law are advantageous because they have widespread applications to various biochemical systems (36–39). Savageau suggested that the power-law approximation could be applied to kinetics in spatially restricted media (17,18,37). In his fractal-like model, the rate coefficient ka depends allometrically on [A] and [B] rather than on time (19,21,22): ka = κ[A]α[B]β, where α and β are not necessarily integers, and κ is a certain proportionality constant. In this model, the progress curve of the product [C] does not exhibit a peak at finite times; instead, it recapitulates classical asymptotic behavior as it approaches steady state.
We have shown by simulations that, in some circumstances, the Schnell-Turner and Savageau models for the reaction A + B ⇌ C predict almost identical progress curves (21,22), at least within a limited time period (before the peak in the Schnell-Turner model is reached). This could present a challenge in terms of experimentally discriminating between these models. As we show below, the analysis of measured progress curves indicates that the binding mechanism of DNSA to CA may not be a single-step binding mechanism; rather, it exhibits an additional step with an intermediate complex. This further complicates the discrimination among models. Therefore, in an attempt to objectively determine which model can best describe the data, we used a number of statistical and information criteria for model selection.
Materials and Methods
Experimental system
Bovine carbonic anhydrase II (derived from erythrocytes) was purchased from Worthington (Lakewood, NJ) and used without further purification. Analysis by mass spectroscopy revealed only isoform II, which was acetylated and contained zinc (data not shown). DNSA (5-dimethylaminonapthalene-1-sulfonamide), polyethylene glycol (PEG; MW = 6000), Ficoll (MW = 400,000), sucrose, and HEPES buffer were purchased from Sigma-Aldrich (St. Louis, MO).
We determined the concentration of DNSA by absorption in a solution of 60% ethanol (v/v) by using the method of Weber (40) and employing an extinction coefficient of ɛ330nm = 4000 M–1 cm–1.
The concentration of carbonic anhydrase was determined by absorption in 20 mM HEPES buffer. The absorption was maximal near 280 nm. The spectrum was corrected for solvent absorption and turbidity by means of the built-in algorithm of the Beckman DU-640 spectrophotometer. The extinction coefficient for bovine carbonic anhydrase II was calculated using the Edelhoch method (41), but with the extinction coefficients for Trp and Tyr determined by the method of Pace et al. (42), based on the protein sequence predicted from the gene CAH2_BOVIN; ɛ280nm = 50, 420 M–1 cm–1. All of the experiments presented here were performed with protein from the same lot. The viscosity of the solutions was measured with an AMVn automated viscometer (Anton Paar, Graz, Austria) with firmware version 1.70 and VisioLab version 1.63.
Stopped-flow experiments
We measured the reaction progress of the CA-DNSA interaction using an SX18MV stopped-flow apparatus from Applied Photophysics (Surrey, UK). The temperature for all experiments was kept constant at 25°C. All solutions were buffered at pH 7 with 20 mM HEPES. The reaction was started by mixing equal volumes of one syringe containing the CA and another syringe containing DNSA. The buffer and crowding reagents (when used) were present at equal concentrations in both syringes to minimize the mixing artifacts.
Bound DNSA was excited by energy transfer from protein Trp residues (λex = 280 nm). This method gave a much better signal/noise ratio than when DNSA was excited directly (λex = 330 nm). The emitted light was conditioned by the usual high-pass filter with a cutoff of 390 nm, and was quantified with an R6095 photomultiplier tube. Each progress curve consists of 1000 points over 20 s, but initial points below 60 ms were discarded to avoid possible mixing artifacts. Five progress curves were routinely measured for each experimental condition and corrected for small variations in vertical shift. The mean and the standard deviation (SD) were then determined for each point. The resulting mean progress curves with SDs were used in weighted least-squares fitting.
Macroscopic kinetic models
Here we consider several models (17,19,21,22) in more detail. Assuming conservation of mass: [A] + [C] = A0, [B] + [C] = B0, where A0, B0, C0 = 0 are initial concentrations, Eq. 2 becomes
| (3) |
When the rate coefficients ka and kd are constant, this equation corresponds to the classical mass-action model. However, in the proposed models, which are meant to describe the effects of crowding, these rate coefficients could be functions of time and/or concentration. We consider six models with the rate coefficients given in Table 1. A detailed derivation and mathematical analysis of these models can be found elsewhere (22). The association time-dependent rate coefficient in models based on work of Kopelman and collaborators (26–29), and adapted by Schnell and Turner (19), can be physically interpreted through random walk on fractals (30,31). The models based on power-law approximation can be derived by simple arguments related to allometry, or to the Taylor expansion of unknown functions in log-log space (36).
Table 1.
Modifications of the mass-action model and abbreviations
| Rate coefficients |
|||
|---|---|---|---|
| Model (reference) | Association | Dissociation | Abbreviation |
| Mass action | ka | kd | mama |
| Schnell-Turner (19) | ka/(t/τ + 1)h | kd | stma |
| Generalized Schnell-Turner (22) | ka/(t/τ + 1)h | kd/(t/τ + 1)h | steq |
| Generalized Schnell-Turner (22) | ka/(t/τa + 1)h | kd/(t/τd + 1)h | stst |
| Savageau (17) | ka([A]/u)α([B]/u)β | kd | svma |
| Generalized Savageau (22) | ka([A]/u)α([B]/u)β | kd([C]/u)γ | svsv |
We name the models considered here (Table 1) by taking into account the type of association and dissociation rate coefficients. Thus, the mass-action model is referred to as mama, signifying that both dissociation and association rate coefficients correspond to that model. The original model proposed by Schnell and Turner (19) for the considered reaction is denoted by stma, signifying that the association term is taken from this model and the dissociation term is taken from the standard mass-action model. Generalizations of these models and the models based on Savageau's proposal are denoted analogously. Note, however, that steq refers to the model in which the time-dependent factors are the same for both the association and dissociation terms.
The constants ka and kd in Table 1 have the same units (concentration/time and reciprocal time, respectively) in all models. In the stma, steq, and stst models, this is accomplished by reformulating the original time-dependent factor 1/(t + τ)h so that it becomes a nondimensional factor (Table 1). The exponent 0 ≤ h < 1 is related to the possible fractal character of the crowded environment (22). It is related to the spectral (or fracton) dimension ds of the fractal (30,31) on which the random walk occurs: h = 1 – ds/2. For h = 0, the models stma, steq, and stst are reduced to the standard mass-action model. The parameter τ may be interpreted as a certain critical time at which the effects of macromolecular crowding become significant (19,21,22). One can argue that at the beginning of the reaction (), the reactive molecules that happen to be the most accessible to each other will interact as if there were no crowding, and the rate coefficient will be almost constant.
Regarding the svma and svsv models, the constants ka and kd have the same units as in the other models if the concentration-dependent factor ([A]/u)α([B]/u)β = (A0/u – [C]/u)α(B0/u – [C]/u)β is dimensionless. We accomplish this by choosing u to have the same units of concentration as the reactants and product (in our case, u = 10−5M). When α = β = 0, the svma model reduces to the mama model, and if in addition γ = 0, the svsv model reduces to mama (Table 1). In fact, these models can be considered as a straightforward generalization of the mass-action model, by assuming noninteger order of elementary reactions, given by 2 + α + β for association and by 1 + γ for dissociation. Because the association rate term [A]1+α[B]1+β is expected to be an increasing function with [A] and [B], it follows that α > – 1, β > – 1. Similarly, the dissociation rate term [C]1+γ being an increasing function with [C] implies γ > – 1. Negative values of α, β, and γ indicate that the rates decrease with respect to the mass-action model, which is expected in crowded media. The crowding molecules can be barriers for A and B to reach interacting distance, and they can temporarily trap C so that it cannot dissociate as quickly.
If we assume that binding is not a single-step reaction but is accomplished through an intermediate (25), the reaction scheme would be:
| (4) |
where D denotes the final stabilized complex. This scheme implies the following system of differential equations:
| (5) |
Here, ka and kd are assumed to have a form as in Table 1, and k1 and k2 are regarded as constants. Therefore, it appears reasonable to assume that the possible effect of crowding molecules on conformational change is expressed through the change in these constants.
It is known that Eq. 3 for the mama model can be solved analytically, and this is also true for the steq model (22). The other models considered here do not exhibit analytically solvable equations. We used the LSODA numerical solver to obtain numerical solutions.
Model validation by least-squares fitting
The signal obtained from the stop-flow experiments is linearly related to the concentrations of the complex [C] ≡ [CA-DNSA] and [DNSA]:
| (6) |
where parameters q1 and q2 () are proportional to the quantum yield, and q0 represents the offset. If an intermediate is assumed, we have to take into account the possibility that this intermediate may contribute to the signal, implying the following relation:
| (7) |
The models were validated by simultaneous weighted least-squares fitting to multiple progress curves corresponding to various combinations of initial concentrations. The weights wij are given by , where SDs σij for each progress curve j and each time point i are obtained from repeated measurements of each progress curve. In simultaneous fitting, the model parameters were considered global, as were qc and qd; however, for each progress curve a different parameter, q = q0 + q1[DNSA](0), was taken into account. We also allowed a small variation in the initial concentrations; each initial concentration is modified by a factor from the interval [0.7,1.3]. Minimization of the weighted sum of squared errors required the use of a sophisticated search method, because the number of free parameters for the six curves was 14 or more, depending on the model. We chose the Simplex Induction Hybrid (SIH) algorithm, which compares favorably with the other algorithms for challenging optimization problems (43).
To address the issue regarding the goodness-of-fit by the models, we calculated the probability Pg that data points drawn from the parent χ2 distribution with ν degrees of freedom would yield a value of χ2 equal to or greater than the one obtained: Pg ≡ Pr[χ2(ν) ≥ ] = 1 – P(ν/2, /2), where ν = n – m (n is the number of all data points, and m is the number of free parameters), is the obtained value, and P(a, x) is the incomplete γ function (44,45). According to Press et al. (45), the fit is generally considered acceptable if this probability is higher than 0.1, and is definitely unacceptable if it is lower than 0.001.
The models that yield acceptable fits may provide a satisfactory description of the data. However, we wanted to determine which of the considered models is actually preferable. To that end, we applied three different types of information criteria for model selection, known as the Akaike (AIC), Bayesian (BIC), and Hannan-Quinn (HQIC) criteria (46–48). These criteria take into account the number of parameters as well as the obtained . They can be expressed in the form + mw(n), where w(n) = 2 for AIC, w(n) = ln n for BIC, and w(n) = 2 ln(ln n) for HQIC. When these criteria are used to compare models, the model with the lower value for a given criterion is preferred.
In addition, we used Zwanzig's model-selection criterion (47,49). This criterion provides a quantitative comparison of fits by two models and determines which of the two models is preferable, or that there is no statistically significant difference in fits by the two models. The criterion is based on a statistic that can be expressed as:
| (8) |
where χ12 and χ22 are obtained by fitting the data with models f1(t) and f2(t), respectively, and σk are SDs for data points. When T12 > u1–s/2, model f2(t) is preferred; |T12| ≤ u1–s/2 implies no significant difference between models; and when T12 < –u1–s/2, model f1(t) is preferred. Here uq is the q-quantile of the normal distribution, and s is the level of significance (assumed to be 0.05).
When applicable, we also used the standard F-test (44,47) for the nested models to investigate whether the inclusion of additional parameters is justified.
We estimated the uncertainties in the best-fit model parameters by performing Monte-Carlo simulations (45) in such a way that the mean experimental progress curve was corrupted by Gaussian noise according to the SD for each point and then refitted. We repeated this procedure 100 times and obtained the distribution of values for each parameter, which was characterized by its SD. Uncertainties in the parameters were characterized by the coefficient of variation.
Results
We measured progress curves for the binding of DNSA to CA for the following [CA]/[DNSA] ratios of the initial μM concentrations: 5:5, 5:10, 5:20, 10:5, 10:10, and 10:20. The measurements were performed in the absence and presence of crowding molecules (100 and 150 g/L PEG-6000 or Ficoll-400000). Examples of the measured progress curves are given in Fig. 1. As this figure shows, our measurements were characterized by a high signal/noise ratio. The effects of PEG and Ficoll, which amount to lowering of the steady state and the initial slopes of the curves, can be clearly observed. These effects were also seen for other combinations of initial concentrations.
Figure 1.
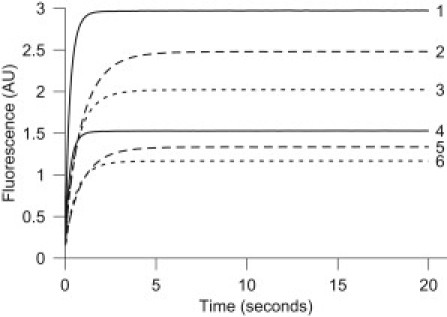
Reaction progress curves of the complex formation of CA and DNSA measured for different conditions. Curves 1 and 4 correspond to dilute solution, curves 2 and 5 represent solutions with PEG (150 g/L), and curves 3 and 6 represent solutions with Ficoll (150 g/L). The initial concentration of CA was 10 μM for curves 1–3, and 5 μM for curves 4–6. The concentration of DNSA was 20 μM in all cases. The means of five repeated measurements are displayed.
One would expect the effects of crowding to be partially due to an increase in macroscopic viscosity. The bulk viscosity of the solution with 100 g/L PEG was six times larger (6 mPa·s) than without PEG and was isoviscous to the solution with 100 g/L Ficoll. The solution with 150 g/L of PEG showed 15 times greater viscosity than that without PEG, and it was isoviscous to the solution with 150 g/L Ficoll. We also measured reaction progress curves in which the solution contained sucrose in such a concentration that it was macroscopically isoviscous to the media containing 150 g/L PEG or 150 g/L Ficoll. In this way, we were able to investigate the extent to which the effects of macromolecular crowding differed from the effects caused simply by macroscopic viscosity (see below).
We found that the information content in just one progress curve was not sufficient to reliably estimate model parameters by fitting. However, with all six curves, we could estimate parameters quite reliably based on fitting of Monte-Carlo simulated data, and on repeated experiments with identical conditions. Examples of the measured and fitted progress curves for [CA-DNSA] are shown in Fig. 2. None of the progress curves exhibit any observable maximum, as predicted by the original Schnell-Turner model.
Figure 2.
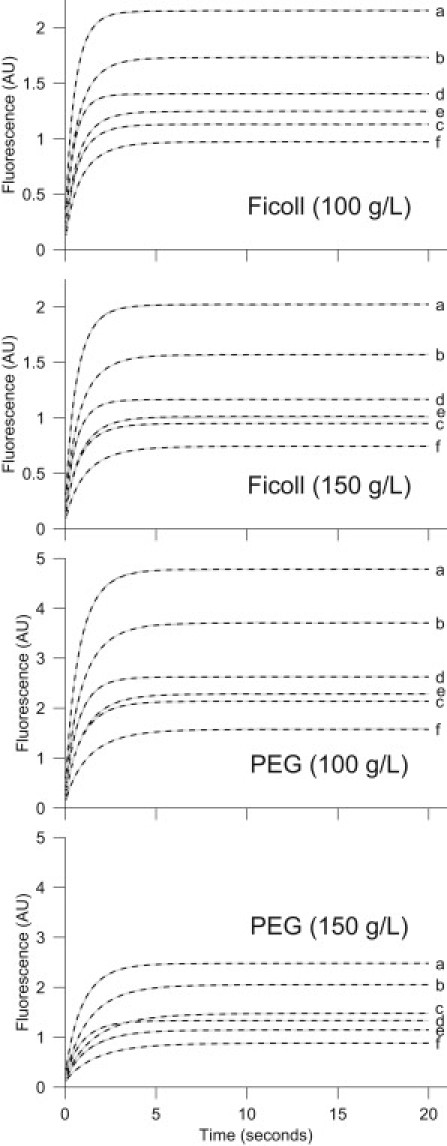
Reaction progress curves of the complex formation of CA and DNSA measured for six combinations of initial μM concentrations ([CA],[DNSA]): (a) (10,20), (b) (10,10), (c) (10,5), (d) (5,20), (e) (5,10), and (f) (5,5), in the presence of crowding with PEG and Ficoll. The curves (solid lines) are the means of five repeated measurements. The SDs are small, on the order of the line widths. Dashed lines (gray), which mainly coincide with the solid lines, represent the fit by the svsv model.
The fit of data in the absence of crowding (or sucrose) by the mama model without an intermediate (see Eq. 1) turned out to be unacceptable according to the employed goodness-of-fit criterion (the probability Pg was much smaller than 0.001; Table 2)). The other data (with crowding or sucrose) also did not yield acceptable fits with the simple mama model. However, the mama model with an intermediate (denoted by mamai; see Eq. 4) produced an acceptable fit of data in the absence of crowding (Pg > 0.99; Table 2). In this case, the coefficient of variation for the rate constants was <2%.
Table 2.
Model parameters obtained by weighted least-squares fitting of selected models to reaction progress curves for noncrowded and crowded media
| Ficoll-400k |
PEG-6000 |
||||||
|---|---|---|---|---|---|---|---|
| Model | Parameters | Dilute | Sucrose | 100 g/L | 150 g/L | 100 g/L | 150 g/L |
| mama | ka∗ | 2.67 | 0.08 | 0.13 | 0.10 | 0.07 | 0.44 |
| kd† | 0.17 | 0.17 | 0.19 | 0.19 | 0.19 | 0.20 | |
| Pg‡ | <10−5 | <10−5 | <10−5 | <10−5 | <10−5 | <10−5 | |
| mamai | ka | 1.12 | 0.76 | 0.26 | 0.48 | 0.82 | 0.24 |
| kd | 45.9 | 16.8 | 0.19 | 13.0 | 40.4 | 7.11 | |
| k1 | 19.5 | 3.43 | 2.79 | 5.54 | 5.88 | 1.97 | |
| k2 | 0.21 | 0.17 | 0.48 | 0.23 | 0.19 | 0.27 | |
| Pg | >0.99 | <10−5 | <10−5 | >0.99 | >0.99 | >0.99 | |
| stst | ka | 1.19 | 6.78 | 0.31 | 1.14 | 1.46 | 0.29 |
| kd | 49.1 | 11.3 | 2.16 | 34.2 | 32.2 | 7.59 | |
| k1 | 19.0 | 1.91 | 2.60 | 5.38 | 2.74 | 1.80 | |
| k2 | 0.22 | 0.19 | 0.50 | 0.22 | 0.22 | 0.29 | |
| τa§ | 6.22 | 0.006 | 0.80 | 0.02 | 0.01 | 2.48 | |
| τd | 0.86 | 0.17 | 0.54 | 0.03 | 0.03 | 2.19 | |
| h | 0.02 | 0.51 | 0.16 | 0.19 | 0.24 | 0.24 | |
| Pg | >0.99 | >0.99 | >0.99 | >0.99 | >0.99 | >0.99 | |
| svma | ka | 0.34 | 0.19 | 0.23 | 0.16 | 0.14 | 0.08 |
| kd | 0.18 | 0.35 | 0.26 | 0.24 | 0.26 | 0.28 | |
| k1 | 2·10−7 | 0.55 | 0.46 | 0.15 | 0.34 | 0.11 | |
| k2 | 0.31 | 0.98 | 1.57 | 0.86 | 1.36 | 0.67 | |
| α | −0.06 | −0.25 | −0.16 | −0.11 | −0.17 | −0.24 | |
| β | −0.03 | −0.19 | −0.14 | −0.07 | −0.10 | −0.06 | |
| Pg | >0.99 | >0.99 | >0.99 | >0.99 | >0.99 | >0.99 | |
| svsv | ka | 0.25 | 0.33 | 0.15 | 0.09 | 0.15 | 0.07 |
| kd | 0.20 | 1.30 | 1.57 | 1.55 | 0.27 | 0.28 | |
| k1 | 0.0001 | 2.61 | 111 | 226 | 0.30 | 0.01 | |
| k2 | 0.22 | 0.71 | 12.3 | 26.1 | 0.93 | 0.36 | |
| α | −0.06 | −0.35 | −0.05 | −0.005 | −0.18 | −0.19 | |
| β | 0.00 | −0.26 | 0.04 | 0.07 | −0.12 | −0.01 | |
| γ | −0.06 | −0.71 | −0.78 | −0.73 | 0.15 | −0.19 | |
| Pg | >0.99 | >0.99 | >0.99 | >0.99 | >0.99 | >0.99 | |
Units in 10−5 M–1s–1.
Units for kd, k1, and k2 are s–1.
Probability Pg = Pr[χ2(ν) > ] (see Materials and Methods).
Units for τa and τd are seconds.
We then sought to determine whether the mamai model provides acceptable fits for data with crowding. This proved true in some cases (PEG 100 and 150 g/L, Ficoll 150 g/L), but not all (Ficoll 100 g/L, sucrose; see Table 2). Thus, the performance of the mamai model is not consistent. The stma model with an intermediate produced essentially the same fits as the mamai model, whereby the exponent h was practically zero. Because the stma model is deficient (see Introduction), such an outcome was expected. The steq model with an intermediate provided improved fits compared with the mamai model, so only the fit of data with sucrose present was not acceptable (Pg < 0.001). All of the fits by the stst, svma, and svsv models with an intermediate to all data sets were acceptable (Table 2).
The question remains as to which of the acceptable models is preferable according to the model selection criteria described in Materials and Methods. We found that the AIC, BIC, and HQIC criteria indicate that the svsv model is to be preferred on the basis of the fits for all data sets (see Table 3; only BIC is shown, but the other two criteria provided the same model preference). Zwanzig's criterion also indicated that the svsv model is consistently preferred over the svma and stst models (Table 3). Similarly, an F-test between the svma and svsv models favored the svsv model. It is worth noting that the stst model was not consistently preferred over the svma model, even though it has one more free parameter (Table 3).
Table 3.
Preference of models based on model selection criteria
| Ficoll-400k |
PEG-6000 |
||||||
|---|---|---|---|---|---|---|---|
| Model | Selection criteria | Noncrowded | Sucrose | 100 g/L | 150 g/L | 100 g/L | 150 g/L |
| svma (1) | BIC∗ | 3653 | 6111 | 4928 | 4293 | 1328 | 2066 |
| stst (2) | BIC | 3815 | 5392 | 5342 | 3657 | 1316 | 3365 |
| ZC(1,2)† | 1 | 2 | 1 | 2 | 2 | 1 | |
| svsv (3) | BIC | 3563 | 4803 | 3934 | 3477 | 1159 | 1100 |
| ZC(1,3) | 3 | 3 | 3 | 3 | 3 | 3 | |
| ZC(2,3) | 3 | 3 | 3 | 3 | 3 | 3 | |
Bayesian information criterion. The model with the lower value is preferred (see text).
Zwanzig's criterion for comparison of models 1 and 2. The preferred model is displayed.
Although the mamai model was acceptable for reactions in dilute solution, we found that the fits by steq, svma, stst, and svsv models with an intermediate were preferable for the same data. However, for svma, the best fit value for qd was 403, which is much higher than the small values (<1) obtained for other models and data sets. We also obtained very small values for α and β (Table 2), indicating the possibility of only a very small departure from the mamai model. Similarly, for the svsv model, α, β, and γ are small, and qd = 2.8 is somewhat too large to be acceptable. For the stst model parameter, h is very close to zero, indicating a very small departure from the mamai model, which is further suggested by the very similar values for the rate constants (Table 2). With regard to the steq model, we obtained exponent h = 0.9998. According to the meaning of h, this would indicate a considerable effect of crowding; however, that cannot be the case, which renders this model unacceptable. On the basis of this analysis, we can conclude that the mamai model adequately describes progress curves for the reaction in dilute solution, and other models in this case are not warranted. However, as mentioned above, mamai does not consistently describe progress curves for reactions in which crowding (or sucrose) is present. This is exemplified by the comparison of residuals in Fig. 3.
Figure 3.
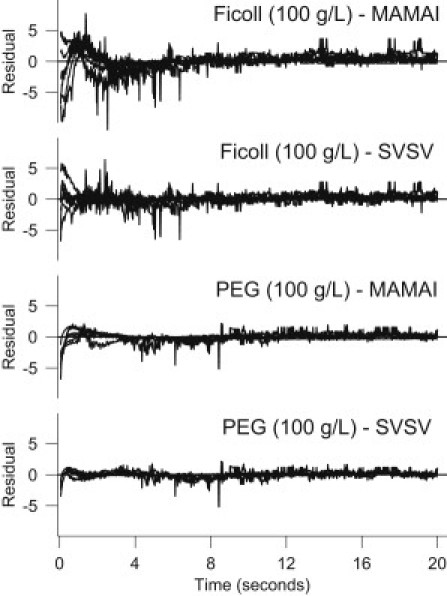
Residuals for simultaneous fits by the mass-action model with intermediate (mamai) and the preferred generalized Savageau model (svsv) in the presence of PEG and Ficoll. The residuals correspond to six reaction progress curves with the initial concentration combinations as in Fig. 2.
With regard to the estimated values of the association rate constants ka, we note that in the preferred svsv model, ka decreases as the concentration of crowding molecules increases. This could be expected because the crowding molecules represent a barrier to diffusion. In that respect, the stst model fails in the case of PEG (see Table 2), and this is also true for the steq model (data not shown). This is yet another reason to disregard the steq and stst models as adequate descriptions of data. The estimated uncertainties in relevant parameters for the svsv model yielded coefficients of variation that were <10%. The exceptions were k1 (26%) and k2 (21% for PEG, 150 g/L), with higher coefficients of variation for exponents α, β, and γ. For Ficoll (150 g/L), α was small, with an estimated coefficient of variation of 30%.
The question arises as to what extent the decrease in association rate constant is due merely to an increase in viscosity. To answer this question, we measured progress curves when the reaction occurred in a solution with sucrose, isoviscous to solutions with 150 g/L of PEG and Ficoll. Thus, columns 2, 4, and 6, displaying parameter values in Table 2, correspond to isoviscous solutions. The values for ka given by the svsv model indicate that there is a decrease for Ficoll and PEG compared with sucrose, which accounts for the different effects of crowding compared with macroscopic viscosity. On the other hand, the ka-value for the reaction with sucrose (in the svsv model) is almost four times lower than the ka-value corresponding to the noncrowded solution as given by the adequate mamai model (Table 2). This finding indicates possible effects of macroscopic viscosity alone.
Discussion
Understanding the kinetics of simple binding reactions is a fundamental prerequisite for kinetic studies of more-complex reaction mechanisms. To study the effects of molecular crowding on time-resolved kinetics, we measured and analyzed the binding of DNSA to CA as monitored by energy transfer from Trp residues in CA to DNSA, which is especially well-suited for this purpose due to its very high signal/noise ratio. The measured progress curves were used to validate proposed macroscopic models for kinetics in crowded media by global weighted least-squares fitting and application of model selection criteria.
The results obtained for the reaction in dilute solution indicated that the binding of DNSA to CA cannot be considered kinetically as a single-step reaction; rather, an intermediate has to be assumed. We believe the precision with which we measured the progress curves and performed the global analysis allowed us to detect the kinetic trace of an intermediate that was previously unknown (24) (although it was indirectly suggested by Taylor et al. (25)). The relatively large dissociation rate constant kd and transition rate constant k1 (see Table 2, mama model) indicate that the proposed intermediate may have a fleeting existence.
The single-step mass action model, mama, did not provide an adequate fit. Yet, when we compare our results with those in literature, we note that our result, ka = 2.67 × 10⁵ M–1s–1 (Table 2), is compatible with values reported by Day and co-workers (24): (3.8 ± 0.9) × 105 M–1 s–1, and Taylor et al. (25): 2.4 × 10⁵ M–1 s–1. Our value for kd agrees with the 0.16 ± 0.03 s–1 reported by Day et al. (24), but is lower than the 0.39 s–1 reported by Taylor et al. (25). Altogether, this comparison suggests that our measurements and data analysis can be considered reliable.
Our analysis based on the goodness of fit, model selection criteria, and values of the obtained parameters lead us to suggest that the svsv model with inclusion of an intermediate is preferred when macromolecular crowding or sucrose is present. When there is no crowding (or sucrose), the standard mass-action model with an intermediate adequately describes data with interpretable parameters, whereas the svsv model yields inadequate parameters. The fits by other models are either unacceptable or not preferred, and they sometimes yield parameter values that are highly improbable.
Although the residuals were considerably smaller for the svsv model than for other models, they were not completely without some systematic deviation from zero, especially in the beginning of the reaction (see Fig. 3). This may indicate that the svsv model is still only a macroscopic approximation of the stochastic process underlying the reaction kinetics in crowded media (50). On the other hand, we cannot completely rule out unknown artifacts from the measurements.
The effect of macromolecular crowding appears significant at 100 g/L and 150 g/L of PEG and Ficoll as crowding macromolecules in the solution. We tried to increase the concentration of cosolutes beyond that density, but found that the related increase of viscosity affected the reliability of the stop-flow measurements. PEG is a linear polymer of ethylene glycol subunits, and Ficoll is a globular, highly branched polysaccharide. The results of fitting the respective progress curves (Table 2) by the svsv model show significant differences in parameters other than ka, which may be related to the structural differences between PEG and Ficoll molecules. PEG is a flexible, extended molecule that intuitively can be expected to alter the structure of water differently from Ficoll and potentially show different patterns of the excluded volume.
Because the svsv model is the generalization of the mass-action model, in which the order of reactions is noninteger, we can conclude that, in addition to changing the rate constants, the macromolecular crowding can also change the order of the elementary reactions to become fractional. This could be considered as an emergent property of chemical reactions in crowded media at the macroscopic level; however, this observation obviously requires further elucidation at the microscopic level.
Conclusions
Our study indicates that 1), binding of DNSA to CA II in the presence of crowding molecules is not consistently well described by the mass-action model; 2), the original Schnell-Turner model does not provide any improvement over the mass-action model for describing the reaction in crowded media; 3), the steq and stst generalizations are also not acceptable or preferred models; and 4), the Savageau model (svma) is not preferred over the generalized Savageau model (svsv). The latter is equivalent to a change in reaction order for association and dissociation, and was found to be preferable for describing measured progress curves for reactions in the presence of crowding. Our findings concerning this model need to be further validated by studies involving different binding reactions and crowding macromolecules. In addition, it would be of interest to compare the generalized Savageau model with the predictions of mesoscopic models (11,51), which in principle can provide simulated progress curves under controlled conditions.
Acknowledgments
We thank Professor John Goutsias for fruitful discussions about stochastic effects.
This work was supported by the Mayo Graduate School (K.L.N.).
References
- 1.Minton A.P. Excluded volume as a determinant of macromolecular structures and reactivity. Biopolymers. 1981;20:2093–2120. [Google Scholar]
- 2.Zimmerman S.B., Minton A.P. Macromolecular crowding: biochemical, biophysical, and physiological consequences. Annu. Rev. Biophys. Biomol. Struct. 1993;22:27–65. doi: 10.1146/annurev.bb.22.060193.000331. [DOI] [PubMed] [Google Scholar]
- 3.Minton A.P. The influence of macromolecular crowding and macromolecular confinement on biochemical reactions in physiological media. J. Biol. Chem. 2001;276:10577–10580. doi: 10.1074/jbc.R100005200. [DOI] [PubMed] [Google Scholar]
- 4.Hall D., Minton A.P. Macromolecular crowding: qualitative and semiquantitative successes, quantitative challenges. Biochim. Biophys. Acta. 2003;1649:127–139. doi: 10.1016/s1570-9639(03)00167-5. [DOI] [PubMed] [Google Scholar]
- 5.Berry H. Monte Carlo simulations of enzyme reactions in two dimensions: fractal kinetics and spatial segregation. Biophys. J. 2002;83:1891–1901. doi: 10.1016/S0006-3495(02)73953-2. [DOI] [PMC free article] [PubMed] [Google Scholar]
- 6.Turner T.E., Schnell S., Burrage K. Stochastic approaches for modelling in vivo reactions. Comput. Biol. Chem. 2004;28:165–178. doi: 10.1016/j.compbiolchem.2004.05.001. [DOI] [PubMed] [Google Scholar]
- 7.Homchaudhuri L., Sarma N., Swaminathan R. Effect of crowding by dextrans and Ficolls on the rate of alkaline phosphatase-catalyzed hydrolysis: a size-dependent investigation. Biopolymers. 2006;83:477–486. doi: 10.1002/bip.20578. [DOI] [PubMed] [Google Scholar]
- 8.Aranda J.S., Salgado E., Muñoz-Diosdado A. Multifractality in intracellular enzymatic reactions. J. Theor. Biol. 2006;240:209–217. doi: 10.1016/j.jtbi.2005.09.005. [DOI] [PubMed] [Google Scholar]
- 9.Kozer N., Kuttner Y.Y., Schreiber G. Protein-protein association in polymer solutions: from dilute to semidilute to concentrated. Biophys. J. 2007;92:2139–2149. doi: 10.1529/biophysj.106.097717. [DOI] [PMC free article] [PubMed] [Google Scholar]
- 10.Sun J., Weinstein H. Toward realistic modeling of dynamic processes in cell signaling: quantification of macromolecular crowding effects. J. Chem. Phys. 2007;127:155105. doi: 10.1063/1.2789434. [DOI] [PubMed] [Google Scholar]
- 11.Grima R., Schnell S. A mesoscopic simulation approach for modeling intracellular reactions. J. Stat. Phys. 2007;128:139–164. [Google Scholar]
- 12.Dix J.A., Verkman A.S. Crowding effects on diffusion in solutions and cells. Annu Rev Biophys. 2008;37:247–263. doi: 10.1146/annurev.biophys.37.032807.125824. [DOI] [PubMed] [Google Scholar]
- 13.Agrawal M., Santra S.B., Swaminathan R. Effect of macromolecular crowding on the rate of diffusion-limited enzymatic reaction. Pramana. 2008;71:359–368. [Google Scholar]
- 14.Phillip Y., Sherman E., Schreiber G. Common crowding agents have only a small effect on protein-protein interactions. Biophys. J. 2009;97:875–885. doi: 10.1016/j.bpj.2009.05.026. [DOI] [PMC free article] [PubMed] [Google Scholar]
- 15.Elcock A.H. Models of macromolecular crowding effects and the need for quantitative comparisons with experiment. Curr. Opin. Struct. Biol. 2010;20:196–206. doi: 10.1016/j.sbi.2010.01.008. [DOI] [PMC free article] [PubMed] [Google Scholar]
- 16.Zhou H.X., Rivas G., Minton A.P. Macromolecular crowding and confinement: biochemical, biophysical, and potential physiological consequences. Annu Rev Biophys. 2008;37:375–397. doi: 10.1146/annurev.biophys.37.032807.125817. [DOI] [PMC free article] [PubMed] [Google Scholar]
- 17.Savageau M.A. Michaelis-Menten mechanism reconsidered: implications of fractal kinetics. J. Theor. Biol. 1995;176:115–124. doi: 10.1006/jtbi.1995.0181. [DOI] [PubMed] [Google Scholar]
- 18.Savageau M.A. Development of fractal kinetic theory for enzyme-catalysed reactions and implications for the design of biochemical pathways. Biosystems. 1998;47:9–36. doi: 10.1016/s0303-2647(98)00020-3. [DOI] [PubMed] [Google Scholar]
- 19.Schnell S., Turner T.E. Reaction kinetics in intracellular environments with macromolecular crowding: simulations and rate laws. Prog. Biophys. Mol. Biol. 2004;85:235–260. doi: 10.1016/j.pbiomolbio.2004.01.012. [DOI] [PubMed] [Google Scholar]
- 20.Grima R., Schnell S. A systematic investigation of the rate laws valid in intracellular environments. Biophys. Chem. 2006;124:1–10. doi: 10.1016/j.bpc.2006.04.019. [DOI] [PubMed] [Google Scholar]
- 21.Bajzer Ž., Huzak M., Prendergast F.G. Reaction kinetics in intracellular environments: the two proposed models yield qualitatively different predictions. Croat. Chem. Acta. 2006;79:437–444. [Google Scholar]
- 22.Bajzer Ž., Huzak M., Prendergast F.G. Mathematical analysis of models for reaction kinetics in intracellular environments. Math. Biosci. 2008;215:35–47. doi: 10.1016/j.mbs.2008.05.003. [DOI] [PubMed] [Google Scholar]
- 23.Lindskog S., Engerg P., Tibell L. Kinetics and mechanism of carbonic anhydrase isoenzymes. In: Tashian R.E., Hewett-Emmett D., editors. The Biology and Chemistry of the Carbonic Anhydrases. New York Academy of Sciences; New York: 1984. pp. 61–75. [DOI] [PubMed] [Google Scholar]
- 24.Day Y.S., Baird C.L., Myszka D.G. Direct comparison of binding equilibrium, thermodynamic, and rate constants determined by surface- and solution-based biophysical methods. Protein Sci. 2002;11:1017–1025. doi: 10.1110/ps.4330102. [DOI] [PMC free article] [PubMed] [Google Scholar]
- 25.Taylor P.W., King R.W., Burgen A.S. Kinetics of complex formation between human carbonic anhydrases and aromatic sulfonamides. Biochemistry. 1970;9:2638–2645. doi: 10.1021/bi00815a012. [DOI] [PubMed] [Google Scholar]
- 26.Klymko P.W., Kopelman R. Fractal reaction kinetics: exciton fusion on clusters. J. Phys. Chem. 1983;87:4565–4567. [Google Scholar]
- 27.Anacker L.W., Kopelman R. Fractal chemical kinetics: simulations and experiments. J. Chem. Phys. 1984;81:6402–6403. [Google Scholar]
- 28.Kopelman R. Rate processes on fractals—theory, simulations and experiments. J. Stat. Phys. 1986;42:185–200. [Google Scholar]
- 29.Kopelman R. Fractal reaction kinetics. Science. 1988;241:1620–1626. doi: 10.1126/science.241.4873.1620. [DOI] [PubMed] [Google Scholar]
- 30.Viscek T. World Scientific; Singapore: 1989. Fractal Growth Phenomena. [Google Scholar]
- 31.Li H.Q., Chen S.H., Zhao H.M. Fractal mechanisms for the allosteric effects of proteins and enzymes. Biophys. J. 1990;58:1313–1320. doi: 10.1016/S0006-3495(90)82472-3. [DOI] [PMC free article] [PubMed] [Google Scholar]
- 32.Szabo A. Theoretical approaches to reversible diffusion-influenced reactions: monomer-excimer kinetics. J. Chem. Phys. 1991;95:2481–2490. [Google Scholar]
- 33.Richards P.M., Szabo A. Reversible trapping on a cubic lattice: comparison of theory and simulations. J. Stat. Phys. 1991;65:1085–1093. [Google Scholar]
- 34.Savageau M.A. Biochemical systems analysis. 3. Dynamic solutions using a power-law approximation. J. Theor. Biol. 1970;26:215–226. doi: 10.1016/s0022-5193(70)80013-3. [DOI] [PubMed] [Google Scholar]
- 35.Voit E.O., Savageau M.A. Accuracy of alternative representations for integrated biochemical systems. Biochemistry. 1987;26:6869–6880. doi: 10.1021/bi00395a042. [DOI] [PubMed] [Google Scholar]
- 36.Voit E.O. Cambridge University Press; Cambridge: 2000. Computational Analysis of Biochemical Systems: A Practical Guide for Biochemists and Molecular Biologists. [Google Scholar]
- 37.Savageau M.A. Influence of fractal kinetics on molecular recognition. J. Mol. Recognit. 1993;6:149–157. doi: 10.1002/jmr.300060403. [DOI] [PubMed] [Google Scholar]
- 38.Voit E.O. Biochemical and genomic regulation of the trehalose cycle in yeast: review of observations and canonical model analysis. J. Theor. Biol. 2003;223:55–78. doi: 10.1016/s0022-5193(03)00072-9. [DOI] [PubMed] [Google Scholar]
- 39.Maki Y., Takahashi Y., Okamoto M. An integrated comprehensive workbench for inferring genetic networks: voyagene. J. Bioinform. Comput. Biol. 2004;2:533–550. doi: 10.1142/s0219720004000727. [DOI] [PubMed] [Google Scholar]
- 40.Weber G. Polarization of the fluorescence of macromolecules. I. Theory and experimental method. Biochem. J. 1952;51:145–155. doi: 10.1042/bj0510145. [DOI] [PMC free article] [PubMed] [Google Scholar]
- 41.Edelhoch H. Spectroscopic determination of tryptophan and tyrosine in proteins. Biochemistry. 1967;6:1948–1954. doi: 10.1021/bi00859a010. [DOI] [PubMed] [Google Scholar]
- 42.Pace C.N., Vajdos F., Gray T. How to measure and predict the molar absorption coefficient of a protein. Protein Sci. 1995;4:2411–2423. doi: 10.1002/pro.5560041120. [DOI] [PMC free article] [PubMed] [Google Scholar]
- 43.Offord C., Bajzer Z. A hybrid global optimization algorithm involving simplex and inductive search. Lect. Notes Comput. Sci. 2001;2074:680–688. [Google Scholar]
- 44.Bevington P.R., Robinson D.K. McGraw-Hill; Boston: 2003. Data Reduction and Error Analysis for the Physical Sciences. [Google Scholar]
- 45.Press W.H., Teukolsky S.A., Flannery B.P. Cambridge University Press; Cambridge: 1992. Numerical Recipes. [Google Scholar]
- 46.Davidian M., Gallant A.R. The nonlinear mixed effects model with a smooth random effects density. Biometrika. 1993;80:475–488. [Google Scholar]
- 47.Buckwitz D., Holzhütter H.G. A new method to discriminate between enzyme-kinetic models. Comput. Math. Appl. 1990;20:117–126. [Google Scholar]
- 48.Bajzer Ž., Moncrieffe M.C., Prendergast F.G. Complex homogeneous and heterogeneous fluorescence anisotropy decays: enhancing analysis accuracy. Biophys. J. 2001;81:1765–1775. doi: 10.1016/S0006-3495(01)75827-4. [DOI] [PMC free article] [PubMed] [Google Scholar]
- 49.Zwanzig S. The choice of approximative models in nonlinear regression. Statistics. 1980;11:23–47. [Google Scholar]
- 50.Goutsias J. Classical versus stochastic kinetics modeling of biochemical reaction systems. Biophys. J. 2007;92:2350–2365. doi: 10.1529/biophysj.106.093781. [DOI] [PMC free article] [PubMed] [Google Scholar]
- 51.Andrews S.S., Bray D. Stochastic simulation of chemical reactions with spatial resolution and single molecule detail. Phys. Biol. 2004;1:137–151. doi: 10.1088/1478-3967/1/3/001. [DOI] [PubMed] [Google Scholar]