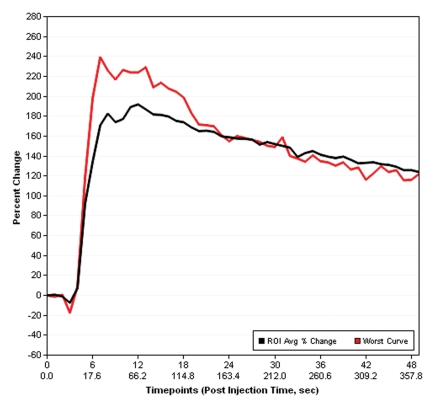
Figure 4f.
Prostate cancer in a 72-year-old man with a Gleason score of 4 + 3 and a PSA level of 7.2 ng/mL. Endorectal MR imaging of the prostate was perfor-med at 3.0 T. (a) Axial T2-weighted image (5000/123) of the prostatic apex shows a hypointense nodule (arrow) in the right side of the apex. (b) Sagittal T2-weighted image (5000/ 153) shows the dark nodule in the prostatic apex (arrow). Note the intact, well-defined, thin, dark prostatic capsule (arrowhead). (c) Coronal T2-weighted image (3360/ 153) shows the hypo-intense spiculated nodule (arrow). This is a typical morphology for prostate cancer. (d) Axial apparent diffusion coefficient (ADC) map from diffusion-weighted imaging shows restricted diffusion (ADC = 0.7 × 10⁻³ mm2/sec) in the region of malignancy (arrow). (e) Color map from DCE MR imaging shows that the area of highest permeability (arrow) is in the region of prostate cancer, a finding that corresponds to the findings on the T2-weighted images and the ADC map. (f) Kinetic curve (percentage of enhancement over time) from DCE MR imaging shows a washout pattern of enhancement, typical of malignancy, in the prostatic apex nodule.

