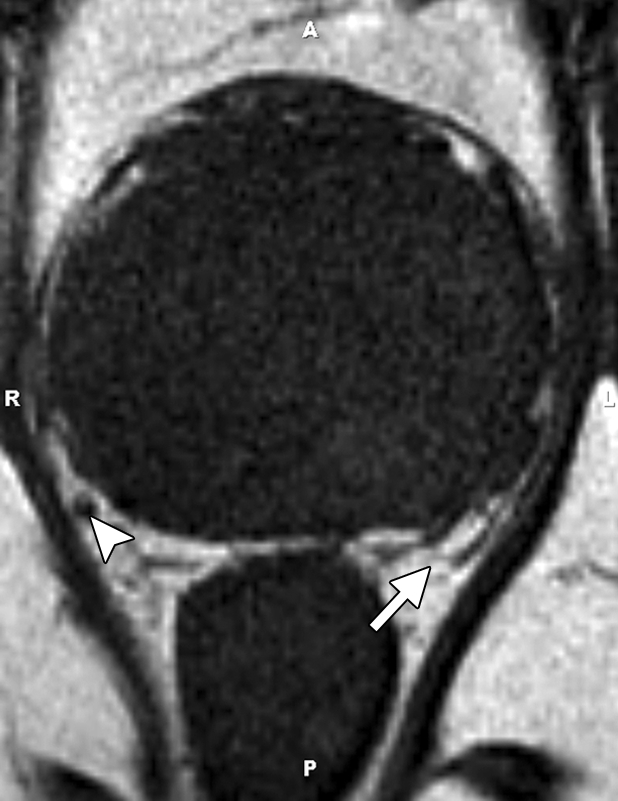
Figure 7c.

Prostate cancer in a 51-year-old man with a Gleason score of 3 + 3 and a PSA level of 36.4 ng/mL. MR imaging of the prostate was performed at 3.0 T with a body matrix coil. (a) Axial T2-weighted image (4000/109) at the level of the prostate base shows confluent dark signal intensity replacing a large volume of the left peripheral zone, with extraprostatic tumor extension (arrow) involving the left neurovascular bundle. (b) Axial T2-weighted image at the level of the midgland shows the extracapsular extension of the tumor, with encasement of the left neurovascular bundle (arrow). (c) Axial T1-weighted image (600/11) shows good definition of the prostatic contour and the extracapsular tumor extension on the left into the bright periprostatic fat. Note the obliterated left neurovascular bundle (arrow) in comparison with the intact right neurovascular bundle (arrowhead).
