

Abstract
The 24-h urine protein-to-creatinine ratio is the gold standard in evaluating proteinuria in lupus nephritis; however, the urine collection is inconvenient to the patient. Random spot urine protein-to-creatinine ratios, although convenient, have poor agreement with the 24-h ratios in these patients. Here, we sought to define a timed collection interval providing accurate and precise data and patient convenience. Urine from 41 patients, in 2 medical centers, with biopsy-proven lupus nephritis was collected at 6-h intervals for 24 h. The protein-to-creatinine ratio of each short collection was then compared with that of a 24-h collection made by combining the 6-h samples. A first morning void and spot urine samples were collected before and after the 24-h collection, respectively. There was significant diurnal variation with peak proteinuria at 6–12 h and nadir at 18–24 h. Each 6-h collection showed excellent correlation and concordance with the 24-h protein-to-creatinine ratio, but the 12–24-h interval had the best agreement. In contrast to the random spot urines, the first morning void also had excellent correlation and concordance, but underestimated the 24-h protein-to-creatinine ratio. Our study shows that a 12-h overnight urine collection is the best surrogate, with excellent agreement with the 24-h protein-to-creatinine ratio, and it is convenient for patients. There was little variability between centers, an important feature for clinical trials.
Keywords: glomerulonephritis, lupus nephritis, nephritis, proteinuria systemic lupus erythematosus
The accurate evaluation of proteinuria is critical to the clinical management of systemic lupus erythematosus (SLE) nephritis, because it is currently the most important biomarker of disease activity and renal prognosis available.1–3 Furthermore, proteinuria is often a primary, secondary, or surrogate end point in clinical trials of new therapies for lupus nephritis (LN), and therefore must be measured with precision.4 There has been considerable discussion regarding the best way to measure daily urinary excretion of protein in these patients, other than 24-h urine collections. If done correctly, the 24-h collection is the best measure of proteinuria. However, these collections are cumbersome for patients and, therefore, prone to under and over collection, compromising accuracy. Such collection problems can be mitigated to some extent by using the protein/creatinine (P/C) ratio of the 24-h specimen, hence many consider it the gold standard for proteinuria assessment.4,5 Nonetheless, collection of 24-h urine samples is still a burden if they need to be collected frequently over the course of clinical care, and are often not feasible for the extensive serial follow-up required during clinical trials. Acknowledging the problems associated with 24-h collections, validated instruments of lupus activity base the diagnosis of renal flare on urine dipstick measurements.6,7 Alternatively, random spot urine P/C have been used for some time as an accurate representation of the 24-h urine collection.8 Unfortunately, both dipstick assessment of proteinuria and random spot urine P/C ratios are inadequate measures of proteinuria.9–11 The P/C ratio of an intended 24-h urine collection that is 50% complete is accurate, but daytime 12-h collections may also be difficult.11 Therefore, this investigation examined shorter-timed urine collection intervals for agreement with 24-h specimens.
RESULTS
A total of 41 patients were enrolled. The majority were women (80%), with about equal numbers of African-Americans (46%) and Caucasians (42%) (Table 1). The age (mean 36.1years, range 23–56 years) was typical for a SLE population. In total, 15 patients had an acute flare of their renal disease within the previous 3 months. On the basis of World Health Organization classification of LN, 2.7% of patients had class I LN, 13.5% had class III, 37.8% had class IV, 18.9% had class V, 16.2% had class III + V, 8.1% had class IV + V, and 2.7% had class VI. The majority of the patients were treated with prednisone (76%), mycophenolate mofetil (73%), angiotensin-converting enzyme inhibitors and/or angiotensin receptor blockers (66%), and hydroxychloroquine (59%). Four of the patients who were not on mycophenolate mofetil were on azathioprine. The mean (range) prednisone and mycophenolate doses in those who were taking these medications were 16.7 mg (3.25–60 mg) and 2141 mg (500–3000 mg), respectively. The mean systolic blood pressure and diastolic blood pressure were 130 and 81 mm Hg, respectively. A total of 18 patients were hypertensive at the clinic visit most proximal to the urine collection.
Table 1.
Demographic and laboratory characteristics of 41 patients with history of lupus nephritis
| Characteristic | Value |
|---|---|
| Age in years, median (range) | 34.4 (22.5–56.3) |
| Gender | |
| Female | 33 (80%) |
| Ethnicity | |
| African American | 19 (46%) |
| Caucasian | 17 (42%) |
| Asian | 5 (12%) |
| 24-h protein-to-creatinine ratio (g/g) | |
| Mean (±s.d.) | 1.41 (±1.97) |
| Median (range) | 0.51 (0.04–9.04) |
| Serum creatinine (mg/dl) | |
| Mean (±s.d.) | 1.26 (±0.63) |
| Median (range) | 1.2 (0.6–3.8) |
| Estimated GFRa (ml/min per 1.73 m2) | |
| Mean (±s.d.) | 74.2 (±31.3) |
| Median (range) | 77.4 (13.7–151.2) |
| ACE inhibitor/ARB treatment | 27 (66%) |
| Prednisone treatment | 31 (76%) |
| Mycophenolate mofetil treatment | 30 (73%) |
| Hydroxychloroquine treatment | 24 (59%) |
ACE, angiotensin-converting enzyme; ARB, angiotensin receptor blocker; GFR, glomerular filtration rate; s.d., standard deviation.
GFR by the modification of diet in renal disease (MDRD) formula.
Urine was collected from these patients according to the algorithm outlined in Figure 1. The 24-h urine protein levels covered a wide range (0.04–9.04 g protein per g creatinine) with a mean of 1.41 g protein per g creatinine. In total, 16 patients had 24-h P/C ratios >1 g/g of which 6 patients had P/C ratios >3 g/g. Of the 41 patients, only 13 (32%) had an MDRD (modification of diet in renal disease)-estimated glomerular filtration rate ≥90 ml/min per 1.73 m2. A total of 13 (32%) had an estimated glomerular filtration rate in the 60–89 ml/min per 1.73 m2 range. The remaining 15 (37%) had an estimated glomerular filtration rate <60 ml/min per 1.73 m2 at the time of their urine collections. On the basis of the ratio of the measured (M) creatinine on the 24-h urine specimen to the expected (E) creatinine (M/E ratio 0.8–1.2 considered complete), 69% (29/41) of collections were deemed complete, with 2.4% (1/41) under collections.
Figure 1. Collection timeline for interval collections.

Spot 0 (SP0) was first morning urine and spot 2 (SP24) was obtained after the 24-h urine collection was completed. Note that for Hopkins lupus cohort (HLC), SP24 was obtained as the second morning void and for Ohio SLE Study (OSS), as a random spot collection. SLE, systemic lupus erythematosus.
Proteinuria is known to vary over the course of the day. To assess diurnal variation in protein excretion, the P/C ratio for each interval urine collection was divided by the P/C ratio of its corresponding 24-h collection, and the mean (±2 s.e.m.) of this ratio was calculated (Figure 2). Peak protein excretion occurred from mid-day through to late afternoon, and was lowest after patients went to bed.
Figure 2. Diurnal variation of protein excretion.
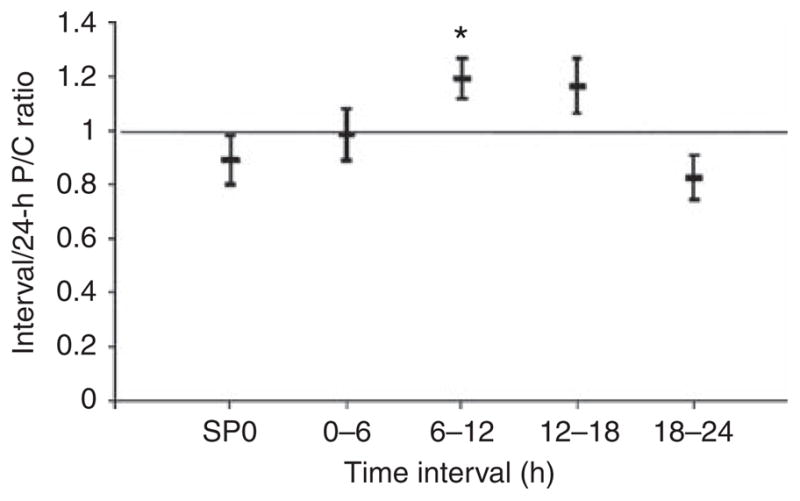
Interval protein/creatinine (P/C) ratios were divided by their corresponding 24-h P/C ratios for the indicated intervals. SP0 represents the first morning void. The middle bar represents the mean ratio, and the top and bottom bars represent ±2 standard errors of the mean. *P<0.001 versus 18–24-h interval.
Owing to this diurnal variation, the timed interval that had the best agreement with the 24-h urine was determined. Agreement is comprised of three components: correlation, concordance, and accuracy. Therefore, the correlation coefficient and concordance coefficient of each interval P/C ratio compared with the 24-h P/C ratio were calculated, and are shown in Table 2. Accuracy was calculated by dividing the interval P/C by the subjects’ corresponding 24-h P/C and then determining the mean of the ratios for the particular interval (Table 2). The closer this value was to 1, the more accurate. Not unexpectedly, the longer collection intervals (12 and 18 h) showed the best agreement with 24-h proteinuria. Furthermore, the variability of the interval P/C ratios diminished with the 12- and 18-h collections (Figure 3). Each 6-h timed collection showed excellent correlation with the 24-h P/C ratio (Table 2; Figure 4), but compared with 12- and 18-h collections, they generally had lower concordance coefficients and/or ratios of the means that were farther from the ideal 1. The 0–6-h interval seemed to have the best combination of correlation, concordance, and accuracy.
Table 2.
Agreement of timed intervals with the 24-h P/C
| Interval | Pearson (r) | Concordance correlation coefficient (lower 95% CI) | Mean (Interval/24-h P/C) (95% CI) |
|---|---|---|---|
| Spot 0 (SP0)—1st am void (SP0) (n=40) | 0.976 | 0.949 (0.929) | 0.89 (0.80–0.98) |
| HLC (n=24) | 0.979 | 0.947 (0.911) | 0.82 (0.74–0.90) |
| OSS (n=16) | 0.939 | 0.922 (0.851) | 1.00 (0.80–1.20) |
| Spot 24 (SP24)—day 2 (SP24) (n=39) | 0.923 | 0.892 (0.841) | 0.91 (0.74–1.08) |
| HLC (n=24)a | 0.957 | 0.930 (0.874) | 0.77 (0.67–0.88) |
| OSS (n=15)b | 0.444 | 0.328 (0.037) | 1.13 (0.70–1.55) |
| 0–6 h | 0.947 | 0.944 (0.916) | 0.98 (0.89–1.08) |
| HLC | 0.957 | 0.951 (0.915) | 0.94 (0.85–1.03) |
| OSS | 0.796 | 0.764 (0.566) | 1.05 (0.83–1.27) |
| 6–12 h | 0.988 | 0.950 (0.934) | 1.19 (1.12–1.27) |
| HLC | 0.989 | 0.942 (0.909) | 1.21 (1.14–1.29) |
| OSS | 0.986 | 0.976 (0.952) | 1.16 (1.00–1.32) |
| 12–18 h | 0.943 | 0.937 (0.905) | 1.17 (1.06–1.27) |
| HLC | 0.952 | 0.949 (0.908) | 1.20 (1.07–1.32) |
| OSS (n=15) | 0.972 | 0.841 (0.764) | 1.12 (0.92–1.31) |
| 18–24 h | 0.990 | 0.917 (0.893) | 0.83 (0.74–0.91) |
| HLC | 0.989 | 0.905 (0.853) | 0.78 (0.68–0.88) |
| OSS | 0.989 | 0.937 (0.892) | 0.90 (0.75–1.06) |
| 0–12 h | 0.979 | 0.965 (0.951) | 1.07 (1.01–1.13) |
| HLC | 0.979 | 0.960 (0.935) | 1.06 (1.00–1.12) |
| OSS | 0.980 | 0.977 (0.952) | 1.09 (0.96–1.22) |
| 12–24 h | 0.980 | 0.971 (0.955) | 0.98 (0.91–1.05) |
| HLC | 0.979 | 0.966 (0.942) | 0.97 (0.90–1.03) |
| OSS | 0.992 | 0.986 (0.976) | 1.00 (0.84–1.16) |
| 0–18 h | 0.997 | 0.988 (0.983) | 1.08 (1.04–1.12) |
| HLC | 0.996 | 0.986 (0.978) | 1.10 (1.05–1.15) |
| OSS | 0.998 | 0.986 (0.977) | 1.05 (0.97–1.12) |
CI, confidence interval; HLC, Hopkins lupus cohort; OSS, Ohio SLE Study; P/C, protein/creatinine; SLE, systemic lupus erythematosus.
Spot urine collected as first urine after completing 24-h collection.
Spot urine collected randomly after completion of 24-h collection.
Collections stratified by center: HLC (n=25) and OSS (n=16).
Figure 3. Variability of interval protein/creatinine (P/C) ratio declines as the duration of the interval approaches 24 h.
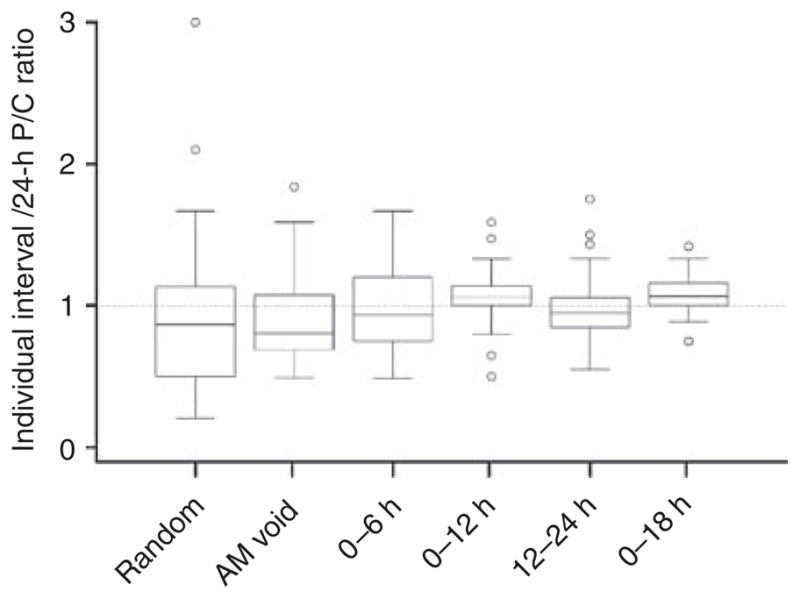
Box-and-whisker plots of individual interval P/C ratios divided by their corresponding 24-h P/C ratio. Boxes represent the interquartile range. Whisker lengths represent up to 1.5 times the interquartile range. Outliers beyond the whiskers are shown with open circles.
Figure 4. Correlation of 6- and 12-h protein/creatinine (P/C) ratio with 24-h P/C ratio.

The dashed line represents the line of perfect concordance (45° line); the solid line is the best-fit regression.
With respect to untimed collections, the random spot urine sample SP24 showed very poor agreement with the 24-h P/C ratio (Table 2). Interestingly SP0 showed a correlation coefficient of 0.98 and concordance correlation coefficient of 0.95, but underestimated the 24-h P/C (ratio of the means = 0.78). The mean SP0 P/C ratio was significantly different than the mean 0–6-h P/C ratio (P<0.01).
Owing to the different measurement assays used at the two participating institutions, patients were stratified based on institution to exclude a center effect (Table 2). The most significant difference was seen in the SP24 spot collection. This was likely accounted for by differences in timing of this spot collection. As described in Methods, SP24 was a random urine in Ohio SLE Study (OSS) patients, but was the second morning void in Hopkins lupus cohort (HLC) patients. Of the 6-h collections, only the 0–6-h time interval showed a significant difference between the institutions (Table 2). This difference can largely be accounted for by one extreme value (24-h P/C ratio = 3.82) in the OSS cohort. Without this value, the correlation coefficient (r) increased from 0.796 to 0.942 and the ρc from 0.764 to 0.867. Importantly, for the 12-and 18-h intervals, little center effect was observed (Table 2).
A separate analysis was performed after removing the most extreme data point (24-h P/C of 9.04 g/g in the HLC cohort) to assess the influence of this potential outlier on the findings. There was only a small effect (data not shown) of its removal on concordance, correlation, and ratio of the means. The largest effect was seen in the 0–6-h time interval in which the overall r dropped from 0.947 to 0.923 and the ρc from 0.944 to 0.919. Within the HLC 0–6-h time interval, r fell from 0.957 to 0.935 and ρc from 0.951 to 0.933.
We next determined whether an average of SP0 and SP24 would provide improved agreement for spot urines. This was done because collecting a first and second morning void would be easy to do and, therefore, potentially clinically useful. Averaging the SP0 and SP24 in the HLC (first and second morning voids) improved the concordance and correlation with the 24-h P/C, but did not change the ratio of means (ρc = 0.957, r = 0.991, ratio of the means = 0.80).
It is conceivable that the accuracy of SP0 could be affected by level of kidney function, because patients with impaired kidney function often have nocturia due to an inability to concentrate their urine. The difference in the mean P/C ratio of SP0 and the 24-h collection, however, showed no relationship to serum creatinine or estimated glomerular filtration rate (data not shown).
DISCUSSION
The goal of this investigation was to identify a short-interval, timed urine collection that provides an accurate and precise reflection of 24-h proteinuria in patients with SLE nephritis, and can be readily applied to both routine clinical care and clinical trial design. It was found that the P/C ratio of 6-h timed collections correlated well with the P/C ratio of 24-h collections and showed reasonably good concordance. However, they were not sufficiently accurate, and the best 6-h interval (0–6 h) showed a large center effect. The 12-h interval collections had excellent agreement with 24-h collections and displayed no center effect. Therefore, a 12-h interval was considered the shortest time interval that could be used as a substitute for a 24-h collection. More specifically, the 12-h overnight interval seems to be optimal on the basis of its strong agreement and ease of collection. We suggest that a 12-h overnight urine collection is manageable by most patients, as it does not require collection during working hours, is sufficiently easy so it can be obtained frequently, and is logistically feasible for clinical trials. The data also showed, not unexpectedly, that the longer the duration of collection the closer the approximation to a true 24-h urine.
Importantly, this study re-demonstrated that random spot P/C ratios show poor correlation and poor agreement with 24-h urine P/C ratios. The true random spot urines (OSS cohort, SP24, n = 15) showed a correlation coefficient of 0.44 and a concordance correlation coefficient of 0.33. This is not unexpected, as the data represent P/C ratios from different times of the day, which are known to have up to threefold variation relative to the 24-h P/C ratios even under controlled conditions.12 This diurnal variation is further shown in this study, in which the 6–12-h interval had a 1.44-times greater mean P/C ratio relative to the 18–24-h time interval. Interestingly, the first morning void spot urine (SP0) from both cohorts, and SP24 (n = 24) from the HLC (a second morning void spot urine), had correlation and concordance correlation coefficients of >0.95 and 0.91, respectively. It must be emphasized that, although these are spot urine collections, they are not random collections, because they are the first or second voids of the day. These data suggest that consistency in the timing of collection may improve the agreement of spot with 24-h P/C ratios. In this regard, the first morning spot urine may be particularly relevant, because it is easy to collect, and probably represents as uniform an achieved condition as possible among outpatients. The data from the HLC SP24 urines are provocative, but difficult to generalize, because the number of urine samples is small (n = 24) and obtained from only one cohort. Finally, it should be pointed out that all of the spot urines, whether random or non-random, underestimated the 24-h P/C ratio.
In conclusion, short-interval timed urine collections can be used as a surrogate for 24-h collections for proteinuria to increase patient compliance and improve accuracy of the results. On the basis of our current data, we recommend a 12-h overnight collection, which is likely to be easier for most patients, will provide a more accurate collection than 6-h intervals, and seems to be comparable between centers, which will be important for clinical trials. Random spot P/C measurements should not be used to follow or make management decisions for patients with LN. Although a first-void morning spot sample may underestimate the 24-h P/C, this non-random spot collection may be useful as a screening test in detecting lupus renal flares or following response to treatment.
MATERIALS AND METHODS
Patients with a history of biopsy-proven LN, and a spot urine P/C ratio >0.2 or 24-h urine protein >0.15 g, were eligible for the study. This study was reviewed and approved by the Johns Hopkins University School of Medicine and Ohio State University institutional review boards. All patients gave a written informed consent. The study population of 41 patients included 25 patients enrolled in the HLC, started in 1987 to study the outcome of SLE,13 and 16 from the OSS, a prospective longitudinal study of the natural history of lupus flare since 2001.14
All patients submitted 24-h urine collections (Figure 1). The 24-h urine samples were collected at intervals of 0–6, 6–12, 12–18, and 18–24 h. The first morning void was collected immediately before the timed intervals began (time 0) and was designated spot 0 (SP0). Time 24 was defined as including the first morning void at the end of the 24-h collection. All patients were asked to submit a second spot urine (SP24) after the 24-h collection was completed. For patients in the OSS cohort, this was the random spot urine, collected at the clinic when the patients returned their urine containers. For the HLC, SP24 was always the first void after completing the 24-h collection, and was often done at home before returning the urine containers. This difference in SP24 collection was unintentional and based on a different interpretation of the prospective protocol at the two institutions.
Urine creatinine and protein measurements were carried out in the hospital’s clinical laboratories. For the OSS, the Beckman Coulter Synchron LX system (Beckman Coulter, Fullerton, CA) was utilized, using a pyrogallol red method for protein and modified Jaffe rate for creatinine measurement. For the HLC, urine protein and creatinine were measured with the Hitachi 917 system (Roche Diagnostics, Indianapolis, IN, USA), using a benzethonium chloride method and Roche Creatinine plus (Roche Diagnostics, Indianapolis, IN, USA) (enzymatic assay), respectively. The different assays used at the two institutions are likely to have minimal influence in pooling the data, as the different methods have been shown to correlate highly in the studied ranges.15,16 Urine volume was also measured precisely to allow accurate calculation of P/C ratios for each of the cumulative time intervals shown in Figure 1.
Analyses
Urine was collected over 24 h. P/C ratios of aliquots obtained from the different time intervals of the 24-h collection were compared with the total P/C ratio of the entire 24-h collection. The strength of the linear correlation between interval and 24-h P/C ratios was determined by calculating the Pearson correlation coefficient (r). The degree of deviation from the line of identity between interval P/C ratios and 24-h P/C ratios (that is, the 45° line) was measured by the concordance correlation coefficient (ρc), which assesses both precision (variation in standard deviations) and accuracy (variation in means). Mixed effects analysis was used to estimate the P/C ratio across time intervals to assess for diurnal variation. Completeness of the 24-h urine protein samples was assessed by comparing the total creatinine in the sample with the predicted creatinine (22−(age/9)★ kg in women and 28−(age/6)★ kg in men).17 Collections were considered accurate if measured/expected ratios were between 0.8 and 1.2. Analyses were performed using Stata version 8 (College Station, TX, USA) and SAS version 9.1.3 (SAS Institute, Cary, NC, USA). All reported P-values are two-sided and significance was set at P<0.05.
Acknowledgments
This study was supported by the Johns Hopkins University School of Medicine General Clinical Research Center grant M01-RR00052, from the National Center for Research Resources/NIH. Nagaraja is supported by an NIH CTSA grant UL1RR025755-01 awarded to the Ohio State University. The Hopkins lupus cohort is supported by the National Institutes of Health AR43727. The Ohio state lupus Cohort is supported by the National Institutes of Health DK55546.
Footnotes
DISCLOSURE
All the authors declared no conflict of interests.
References
- 1.Austin HA. Clinical evaluation and monitoring of lupus kidney disease. Lupus. 1998;7:618–621. doi: 10.1191/096120398678920749. [DOI] [PubMed] [Google Scholar]
- 2.Balow JE. Clinical presentation and monitoring of lupus nephritis. Lupus. 2005;14:25–30. doi: 10.1191/0961203305lu2055oa. [DOI] [PubMed] [Google Scholar]
- 3.Contreras G, Pardo V, Cely C, et al. Factors associated with poor outcomes in patients with lupus nephritis. Lupus. 2005;14:890–895. doi: 10.1191/0961203305lu2238oa. [DOI] [PubMed] [Google Scholar]
- 4.Renal Disease Subcommittee of the American College of Rheumatology Ad Hoc Committee on Systemic Lupus Erythematosus Response Criteria. The American College of Rheumatology response criteria for proliferative and membranous renal disease in systemic lupus erythematosus clinical trials. Arthritis Rheum. 2006;54:421–432. doi: 10.1002/art.21625. [DOI] [PubMed] [Google Scholar]
- 5.Christopher-Stine L, Petri M, Astor BC, et al. Urine protein-to-creatinine ratio is a reliable measure of proteinuria in lupus nephritis. J Rheumatol. 2004;31:1557–1559. [PubMed] [Google Scholar]
- 6.Liang MH, Socher SA, Roberts WN, et al. Measurement of systemic lupus erythematosus activity in clinical research. Arthritis Rheum. 1988;31:817–825. doi: 10.1002/art.1780310701. [DOI] [PubMed] [Google Scholar]
- 7.Symmons DP, Coppock JS, Bacon PA, et al. Development and assessment of a computerized index of clinical disease activity in systemic lupus erythematosus. Members of the British Isles Lupus Assessment Group (BILAG) Q J Med. 1988;69:927–937. [PubMed] [Google Scholar]
- 8.Gaspari F, Perico N, Remuzzi G. Timed urine collections are not needed to measure urine protein excretion in clinical practice. Am J Kidney Dis. 2006;47:1–7. doi: 10.1053/j.ajkd.2005.10.014. [DOI] [PubMed] [Google Scholar]
- 9.Shidham G, Hebert LA. Timed urine collections are not needed to measure urine protein excretion in clinical practice. Am J Kidney Dis. 2006;47:8–14. doi: 10.1053/j.ajkd.2005.10.013. [DOI] [PubMed] [Google Scholar]
- 10.Siedner MJ, Gelber AC, Rovin BH, et al. Diagnostic accuracy study of urine dipstick in relation to 24-h measurement as a screening tool for proteinuria in lupus nephritis. J Rheumatol. 2008;35:84–90. [PubMed] [Google Scholar]
- 11.Birmingham DJ, Rovin BH, Shidham G, et al. Spot urine protein/creatinine ratios are unreliable estimates of 24 h proteinuria in most systemic lupus erythematosus nephritis flares. Kidney Int. 2007;72:865–870. doi: 10.1038/sj.ki.5002421. [DOI] [PubMed] [Google Scholar]
- 12.Koopman MG, Krediet RT, Zuyderhoudt FJ, et al. A circadian rhythm of proteinuria in patients with a nephrotic syndrome. Clin Sci (Lond) 1985;69:395–401. doi: 10.1042/cs0690395. [DOI] [PubMed] [Google Scholar]
- 13.Kasitanon N, Magder LS, Petri M. Predictors of survival in systemic lupus erythematosus. Medicine (Baltimore) 2006;85:147–156. doi: 10.1097/01.md.0000224709.70133.f7. [DOI] [PubMed] [Google Scholar]
- 14.Rovin BH, Tang Y, Sun J, et al. Clinical significance of fever in the systemic lupus erythematosus patient receiving steroid therapy. Kidney Int. 2005;68:747–759. doi: 10.1111/j.1523-1755.2005.00453.x. [DOI] [PubMed] [Google Scholar]
- 15.Dube J, Girouard J, Leclerc P, et al. Problems with the estimation of urine protein by automated assays. Clin Biochem. 2005;38:479–485. doi: 10.1016/j.clinbiochem.2004.12.010. [DOI] [PubMed] [Google Scholar]
- 16.Peake M, Whiting M. Measurement of serum creatinine—current status and future goals. Clin Biochem Rev. 2006;27:173–184. [PMC free article] [PubMed] [Google Scholar]
- 17.Rose BD, Rennke H. Renal Pathophysiology—The Essentials. Williams and Wilkins Press; Baltimore, MD: 1994. [Google Scholar]