Abstract
The Goto-Kakizaki (GK) rat, a polygenic non-obese model of type 2 diabetes, is a useful surrogate for study of diabetes-related changes independent of obesity. GK rats and appropriate controls were killed at 4, 8, 12, 16 and 20 weeks post-weaning and differential muscle gene expression along with body and muscle weights, plasma hormones and lipids, and blood cell measurements were carried out. Gene expression analysis identified 204 genes showing 2-fold or greater differences between GK and controls in at least 3 ages. Array results suggested increased oxidative capacity in GK muscles, as well as differential gene expression related to insulin resistance, which was also indicated by HOMA-IR measurements. In addition, potential new biomarkers in muscle gene expression were identified that could be either a cause or consequence of T2DM. Furthermore, we demonstrate here the presence of chronic inflammation evident both systemically and in the musculature, despite the absence of obesity.
Keywords: type 2 diabetes, skeletal muscle, inflammation, microarrays, gene expression
1. Introduction
Type 2 diabetes (T2DM) is a prevalent, costly and growing world-wide health concern. T2DM is a condition of impaired glucose homeostasis which reflects a disruption in fuel homeostasis that intricately and interdependently involves liver, adipose tissue, and skeletal muscle. Clinically, diabetes is defined by excessive blood glucose concentrations. Maintaining appropriate blood glucose involves a balance between input (exogenous from diet and endogenous from liver glycogenolysis and gluconeogenesis) and output (uptake by peripheral tissues). Insulin is a primary factor controlling glucose homeostasis, decreasing input from endogenous production (gluconeogenesis/glycogenolysis) and increasing output (uptake). Insulin resistance, defined as the inability to dispose of excess glucose in the presence of normal or elevated amounts of circulating insulin, is a common feature of most type 2 diabetics. Both because of its bulk (35–40% of body mass) and its high rate of energy consumption, muscle accounts for about 80 percent of insulin-directed glucose uptake (Koistinen and Zierath, 2002). As such, skeletal muscle is central to maintaining systemic glucose homeostasis.
The Goto-Kakizaki (GK) rat, which exhibits a spontaneous form of diabetes, is a common animal model for diabetes studies (Goto et al., 1988; Portha, 2005). Unlike most other genetic models of type 2 diabetes, diabetes in GK rats is polygenic in origin and in this respect they are a good surrogate for the human disease. While the majority of type 2 diabetes patients in Western countries are overweight or obese, in Asia 60% are non-obese, “lean” diabetics (Brunetti, 2007). Because of their non-obese phenotype, this model allows for the study of diabetes-related characteristics without the confounding influence of increased obesity-related factors.
Insulin resistance in skeletal muscle is well documented in the GK rat (Portha, 2005; Steiler et al., 2003), and defects in signal transduction have also been noted (Dadke et al., 2000; Kanoh et al., 2001; Steiler et al., 2003). In addition, alterations in muscle fiber type composition in GK rats have been reported (Yasuda et al., 2002). More recently, defects in muscle microvasculature have been documented in GK rats, which may be important to both glucose delivery/uptake by muscle as well as its metabolism and function (Copp et al.; Padilla et al., 2006; Padilla et al., 2007).
The GK rat was originally developed in Japan, and various sublines have been established throughout the world. Recently, a commercial subline was established in the US by Taconic Farms. Elevated blood glucose and a non-obese phenotype are consistently documented characteristics of GK animals. However, many conflicting reports exist in the literature as to other physiological characteristics including body weights, plasma insulin, plasma adipokines, and lipid profiles. Such differences may stem from variations in different GK sub-lines, variations in rat strains used as controls in different studies, ages studied, or experimental variations in methodology between studies. Therefore, we conducted a carefully controlled systems-based study of the US Taconic sub-line from weaning through mid-adulthood (20 weeks). In this study, animals were subjected to only minimal animal manipulation/stress and were fed ad libitum throughout. We chose to maintain our rats in a normal fed state in order to avoid possible variations in physiological measurements induced by fasting. We have previously reported growth characteristics and indices of diabetes along with an analysis of differential gene expression in livers from these animals [4]. Because of the central role of muscle in the etiology of diabetes, we also undertook a comparative analysis of differential gene expression, using Affymetrix 230–2 gene chips, in skeletal muscles of GK rats relative to Wistar Kyoto (WKY) controls as a function of disease progression.
2. Materials and methods
2.1 Experimental design
This study involved 30 GK diabetic male rats and 30 WKY control male rats obtained from Taconic Farms (Germantown, NY). The research protocol adheres to the Principles of Laboratory Animal Care (NIH publication 85-23, revised in 1985) and was approved by the University at Buffalo Institutional Animal Care and Use Committee. Animals arrived at 21 ± 3 days of age. For experimental purposes, all animals were considered 22 days old at the time of arrival. Animals were maintained in a separate room under stringent environmental conditions that included adherence to uninterrupted 12 h light:12 h dark cycles. All animal care and manipulations were carried out between 1.5 and 3.5 h after lights on. Animals were housed in individual cages with free access to standard rat chow (Rodent Diet 2016, Harlan Teklad) and water. Food intakes and body weights of each animal were measured twice weekly but otherwise animals were undisturbed. Six non-fasted animals from each strain were killed at five different ages: 4, 8, 12, 16, and 20 weeks. Animals were allowed free access to food until sacrifice, which occurred between 1.5 and 3.5 hours after lights on. Rats consume 90% of their food during the dark period, with the bulk consumption occuring in the first 8 hours of the dark cycle (Yuan, 1993). Animals were anesthetized with ketamine (80 mg/kg)/valium (5 mg/kg) i.p., killed by aortic exsanguination, and blood collected using EDTA (4 mM final concentration) as anticoagulant. Glucose, HbA1c, and differential cell counts were measured from whole blood at the time of killing. Plasma was prepared from blood by centrifugation (2000 g, 4 °C, 15 min), divided into aliquots, and stored at −80 °C. Gastrocnemius muscles harvested from both legs were pooled as a single sample, weighed, rapidly frozen in liquid nitrogen, and stored at −80 °C until analysis. Each animal was given an internal animal code at the onset of the experiment. Extensive measurements of plasma lipid and hormone profiles, as well as other organ weights were obtained from these animals, and data for all measurements are presented along with their code in Supplemental Table 1. It is our intent to provide this code information for all reported measurements in all publications from our ongoing studies. From a systems biology perspective this will make these studies most useful to other investigators.
2.2 Glucose measurements
Blood glucose was measured by using a BD Logic blood glucose meter (BD Medical, Franklin Lakes, NJ) from whole blood. Animals were maintained in a normal fed state prior to killing. Because some animals at later ages exceeded the upper limit of detection, glucose was also measured in plasma by the glucose oxidase method (Sigma GAGO-20). The manufacturer’s instructions were modified such that the assay was carried out in a 1 ml volume. A standard curve consisting of seven concentrations over a 16-fold range was prepared from the glucose standard and run with each experimental set. Experimental samples were assayed in triplicate.
2.3 Plasma insulin measurements
Insulin was measured in plasma samples using a commercial RIA (RI-13K Rat Insulin RIA Kit, Millipore Corporation, St Charles, MO). Assays were carried out according to manufacturer’s directions with standards run in duplicate and experimental samples run in triplicate.
2.4 Calculation of HOMA-IR indexes
Individual values of plasma glucose and insulin were used to compute apparent HOMA-IR indexes for each individual animal (HOMA1-IR = glucose (mM) × insulin (μIU/ml)/22.5) (Matthews et al., 1985). A value of 44.45 μg/IU insulin was used for unit conversion.
2.5 Muscle triglycerides
Lipids were extracted from frozen muscle samples with chloroform:methanol (2:1), dried, and resuspended in butanol as described previously (Almon et al., 2009; Hundal et al., 2000). Extracted triglycerides were assayed colorimetrically with commercial reagents (WAKO Chemicals, Richmond, VA).
2.6 Assay design and statistical analysis
Because of the large number of experimental samples, two were selected as quality control (QC) standards for all assays to exclude possible experimental variations between different runs. Inter-assay variations of QCs were less than 10% for all assays. For statistical comparisons, two-way ANOVAs were carried out using SigmaStat 3.5 software (Systat Software, Point Richmond, CA) with Tukey post-hoc tests on rank-transformed data.
2.7 Hematology
Whole blood was obtained at killing for leukocyte analysis using an automated hemocytometer (CELLDYN 1700, Abbott Laboratories, Abbott Park, IL). The system was calibrated with commercial quality controls (Abbott Laboratories) at three levels (high, normal, and low).
2.8 Microarrays
Due to the high cost of microarray analysis, Affymetrix arrays were run on samples from 5 of the 6 animals in each age group for each strain. Both gastrocnemius muscles from each animal were pooled and ground to a fine powder in a mortar cooled by liquid nitrogen and stored at −80°C. For RNA preparation, approximately 100 mg of frozen muscle powder was added to Trizol Lysis Reagent (InVitrogen) in a ratio of 1:10, and homogenized with a Polytron Homogenizer at speed 5 for a total of 90 seconds carried out in 30 second bursts. Total RNA was extracted according to manufacturer’s directions and further purified using RNeasy mini column (RNeasy Mini Kit, QIAGEN Sciences, Germantown, MD). Final preparations were resuspended in RNase-free water and stored at −80°C. RNA was quantified spectrophotometrically, and purity and integrity assessed by formaldehyde-agarose gel electrophoresis. All samples exhibited 260/280 absorbance ratios of approximately 2.0, and showed intact ribosomal 28S and 18S RNA bands in an approximate ratio of 2:1. Isolated RNA from each sample was used to prepare biotinylated cRNA target according to manufacturer’s protocols. The biotinylated cRNA was hybridized to 50 individual Affymetrix GeneChips Rat Genome 230–2 (Affymetrix, Inc., Santa Clara, CA).
2.9 Data mining
Affymetrix Microarray Suite 5.0 (Affymetrix) was used for initial data acquisition. Signal intensities were normalized for each chip using a distribution of all genes around the 50th percentile. The dataset was then loaded into a data mining program, GeneSpring 7.3.1 (Silicon Genetics, Redwood City, CA), for further analysis. The generated dataset was submitted to the National Center for Biotechnology Information (NCBI) Gene Expression Omnibus (GEO; http://www.ncbi.nlm.nih.gov/projects/geo/) database [GSE 13271].
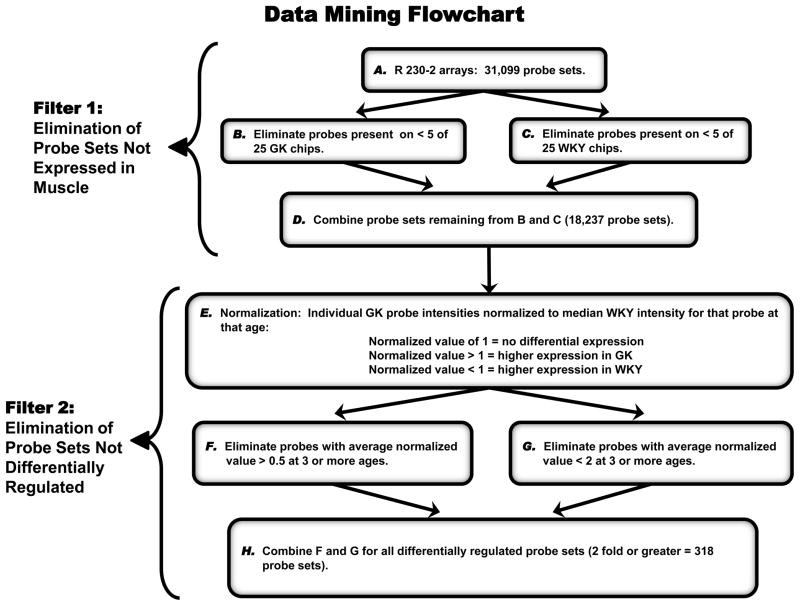
In order to objectively identify probe sets of interest, the entire dataset was filtered with criteria similar to the ones applied to previous gene array datasets (Almon et al., 2009; Almon et al., 2007). This approach does not select for probe sets but rather eliminates those probe sets that do not meet certain criteria, leaving the remainder for further consideration, as summarized in Figure 1. The first filter was designed to eliminate probe sets for genes that are not expressed in the muscle. This was accomplished by eliminating probe sets not present in at least 20% of the chips from either strain. The second level of filtering eliminated probe sets that could not meet the basic criterion of having different expression levels in GK and WKY rats. Probe sets that did not differ by at least 2-fold in at least 3 ages were eliminated. The second filtering step kept a total 318 probe sets for further investigation.
Figure 1. Data mining filters for elimination of non-differentially regulated genes.
Step A begins with all probe sets (31,099) normalized to the 50th percentile of signals on that chip. Steps B and C employed a function of Affymetrix Microarray Suite 5.0 which scores signal intensities as present (P), absent (A), or marginal (M). Probe sets not Present on at least 5 of 25 GK chips were eliminated in B, and those not Present on at least 5 of 25 WKY chips were eliminated in C. Step D (probe sets not eliminated in B and C) represent probe sets expressed in muscle from either strain (18,237 probe sets). Probe sets remaining in Step D are normalized in Step E by dividing the value of individual GK probe sets by the median value of that probe set from WKY chips. Normalized probe sets from Step E are filtered for differential expression (minimum 2-fold difference) in Steps F and G. Step H represents total probe sets differentially expressed in at least 3 ages and used for further analysis (318 probe sets).
3. Results and discussion
3.1 Differential growth in GK and WKY animals
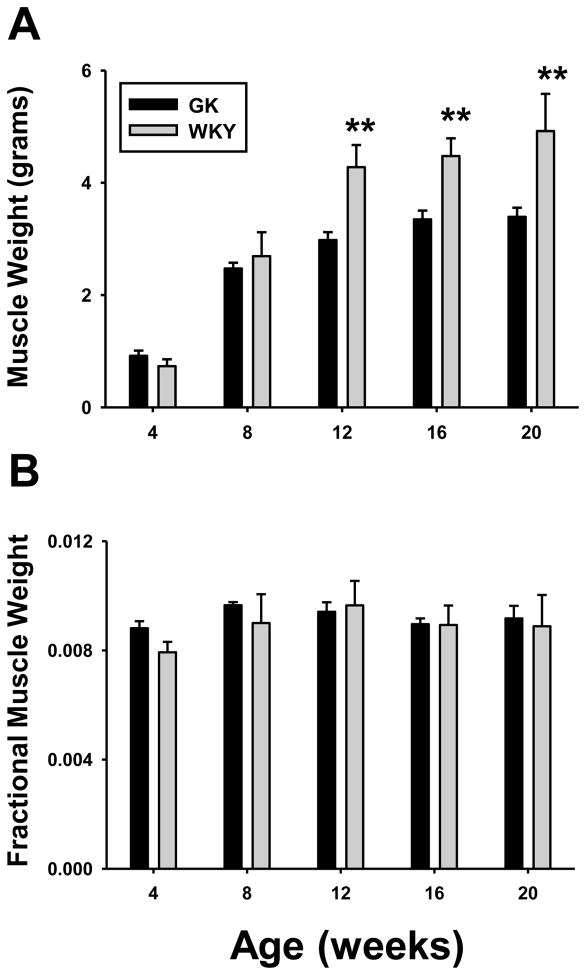
Body weights of animals in this study have been previously published [4], and raw data for each individual animal is also provided in Supplementary Table 1. Although there was no initial difference in body weights between the two groups of animals, by 8 weeks WKY were significantly heavier. The difference in body weight continued to increase throughout the remainder of the 20 week period. Grams of food consumed per day were similar in the two groups (data not shown). Thus the large differences in growth characteristics between the parent strain and GKs cannot be accounted for by a simple decrease in food consumed by GK animals. In fact, when adjusted for body weight, GK animals actually consumed significantly more food than WKY rats from 8 weeks onward. Figure 2 shows the combined weight of the two gastrocnemius muscles in both groups of animals. The GK population starts out with slightly more muscle at 4 weeks, and mass expands in both populations. By 12 weeks and throughout the remainder of the study WKY had significantly more muscle than GK animals. However, this difference is not evident when corrected for the differences in body weights. Rather, the difference in gross muscle mass between GK and WKY simply reflects the difference in whole body size. Therefore, differences in body mass do not reflect disproportionate growth of muscle. In contrast to muscle, adipose tissue accumulation halted by 12 weeks of age in GK animals (Supplemental Table 1).
Figure 2. Muscle weights of GK and WKY animals.
Weights of gastrocnemius muscles (A) and gastrocnemius muscle weight normalized to body weight (B) as a function of age in GK and WKY rats. N = 6. Data represent means and error bars 1 SD of the mean. Dark bars = GK; grey bars = WKY. * = P < 0.05; ** = P < 0.001.
3.2 Glucose homeostasis
The defining feature of diabetes is hyperglycemia, and T2DM is most often associated with peripheral insulin resistance, with muscle being a major contributor. The HOMA-IR index, which is derived from blood glucose and insulin concentrations, is generally accepted as a measure of whole body insulin resistance (Matthews et al., 1985; Wallace et al., 2004). The formula for HOMA-IR was developed in the 1980s based on human data (Matthews et al., 1985). Recently, the use of this measure of insulin resistance has also been validated in rodents. Cacho and colleagues directly compared HOMA-IR calculated from plasma glucose and insulin with data obtained from hyperinsulimemia-isoglycemia clamp studies in rats and found a high correlation, and concluded that HOMA-IR is a reliable measure of insulin resistance in rats as well as humans (Cacho et al., 2008).
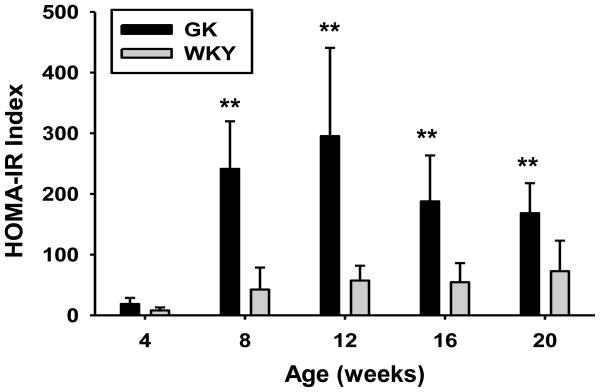
Figure 3 presents the apparent HOMA-IR indexes in these animals. HOMA-IR was developed using fasting glucose and insulin measures in humans, whereas our data were obtained on non-fasted animals. Since the majority of food consumption in rats, which are nocturnal, occurs in early to mid-dark period, our animals consumed little food in the 6–8 hours before sacrifice. To fast noctural animals overnight before such measures, as is commonly done with humans, is more akin to a 24 hour or greater fast and reflects early stages of starvation. Because our animals were not fasted, we use the term “apparent HOMA-IR”. The glucose and insulin measures from which they were derived have been previously published [4], but raw data for each individual animal is provided in Supplementary Table 1. As early as 4 weeks of age, plasma glucose was significantly higher in GK rats and increased with age reaching a plateau between 25 and 30 mM at 12 weeks. Elevated glucose occurred despite the presence of normal or above normal plasma insulin concentrations. Insulin concentrations were similar in both groups of animals at 4 weeks of age. Insulin increased dramatically (about 6-fold) in the GK population relative to WKYs between 4 and 8 weeks, remained at this elevated level through 12 weeks, then began to decline such that by 20 weeks plasma insulin was marginally higher in WKY than in GK. The apparent HOMA-IR calculated from glucose and insulin data for individual animals is significantly higher in GK as compared to WKY animals from 8 weeks of age onward, confirming an insulin resistant state. Others have reported peripheral insulin resistance in GK animals evident from 8 weeks of age (Bisbis et al., 1993; Goto et al., 1988; Portha, 2005), in agreement with our disease progression results.
Figure 3. Indices of insulin resistance in GK and WKY animals.
HOMA-IR calculated from plasma glucose and insulin concentrations as a function of age in GK and WKY animals. N = 6. Data represent means and error bars 1 SD of the mean. Dark bars = GK; grey bars = WKY. * = P < 0.05; ** = P < 0.001.
3.3 Lipids
Insulin resistance in human type 2 diabetes has been linked to both increased blood FFA and excess triglyceride accumulation in skeletal muscle (Bergman and Ader, 2000). Circulating free fatty acids are derived from lypolysis in adipose tissue and some evidence suggest that they provide excess lipid fuel for the musculature reducing glucose uptake (Frangioudakis and Cooney, 2008). However, there was no difference between GK and WKY animals in this study with respect to circulating free fatty acids at any age (Supplementary Table 1). It is also common for there to be elevated triglyceride storage in both the liver and the musculature associated with type 2 diabetes, and increased muscle triglycerides have also been proposed to affect insulin signaling. In these experiments there was no consistent difference between the GK and WKY populations with respect to the triglyceride content of the muscle, as muscle triglycerides only tested as statistically different at 8 weeks (Supplementary table 1). While obese models of diabetes, such as ZDF and DIO rats do exhibit elevated circulating FFAs and tissue triglyceride deposition, the absence of these characteristics in the GK rat may be related to the absence of obesity in this animal model.
3.4 Blood cell profiles
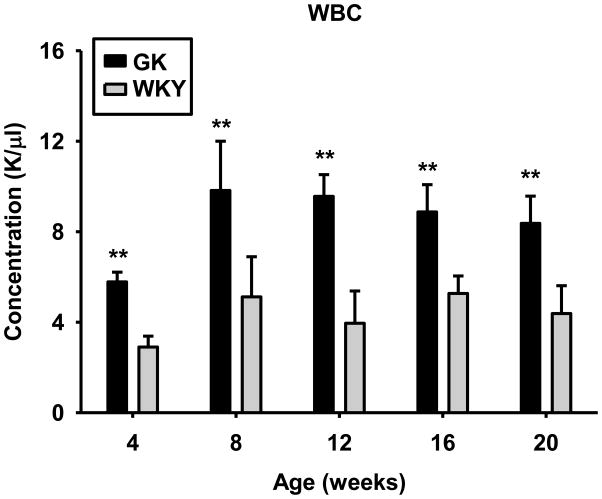
There were no differences in blood erythrocytes or platelets in the two populations. In contrast, the white blood cell count was significantly higher in the GK population at 4 weeks and remained higher throughout 20 weeks (Figure 4) which reflects chronic systemic inflammation in these animals.
Figure 4. White blood cell numbers as a function of age in GK and WKY animals.
Data represent means and error bars 1 SD of the mean. N = 6. Dark bars = GK; grey bars = WKY. * = P < 0.05; ** = P < 0.001.
3.5 Gene array data mining
The filtering process yielded 318 probe sets which showed 2-fold or greater differences in at least 3 of the 5 ages studied. Supplementary Table 2 provides raw data for each of the 318 probe sets in all 50 samples. Affymetrix provides an accession number for the sequence from which each probe set was built. We submitted the accession number of each selected probe set to the NCBI Basic Local Alignment Search Tool (BLAST) to identify, as closely as possible, its gene. Of the 318 probe sets, there were 104 probe sets that could not be currently identified. In addition, in 10 instances there were multiple probe sets for the same gene. This left 204 identifiable individual genes that exhibited differential expression in muscle of GK and WKY animals. These genes were then submitted to NCBI “across database search” primarily to identify aliases and alternate symbols. The preferred symbol was submitted to NCBI AceView as well as extensive PubMed Boolian logic searches to ascertain the function of the gene in skeletal muscle. Based on these searches we separated the genes into groups based on their function: Immune/Inflammatory; Energy Metabolism; Signal Transduction; Transcription/Translation; Transport; Small Molecule Metabolism; Protein Processing; Cell Cycle/Cell Growth, and Miscellaneous. The 104 probe sets not identifiable by BLAST were listed as ESTs. Clearly such functional categorizations are not perfect because overlaps exist. Supplementary Table 3 provides a list of all differentially regulated genes organized by these functional categories, and includes their probe set ID, accession number, gene name, symbol, which strain was higher in how many conditions (ages), and a brief description of function.
Although normalization of the data by strain provided a convenient way of identifying probe sets that are expressed differently, it does not provide a direct view of actual differences in expression. To accomplish this we reconstructed the data set for the selected probe sets in a form that would allow a direct comparison of the actual expression intensities at each time point for both strains. Using this direct view, we were able to gain insight into both the involvement of skeletal muscle gene expression in the underlying cause of the diabetes in the GK strain and/or the gene expression consequences of chronic hyperglycemia.
3.5.1 Genes related to energy metabolism
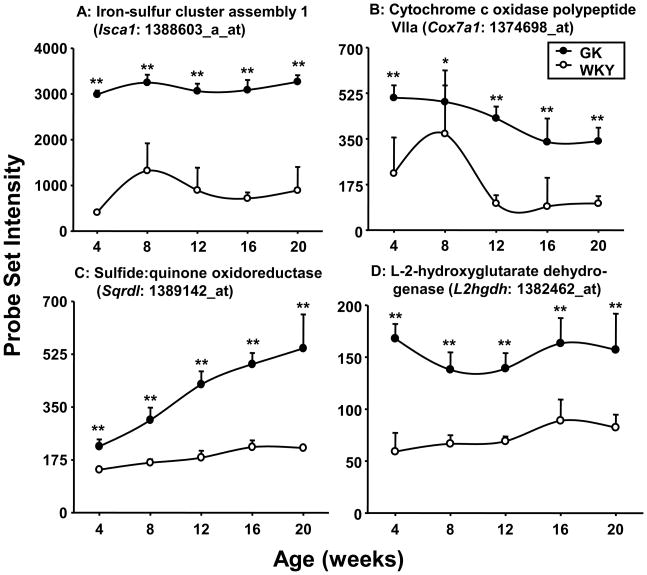
Skeletal muscle is the major consumer of energy substrates in the body. We did not see any difference in the expression of any genes associated with glycolysis. In contrast, the data suggests considerable differences with respect to oxidative capacity as reflected by the increased expression of genes coding for mitochondrial proteins in GK relative to WKY samples. For example, Figure 5 shows the expression of iron-sulfur cluster assembly 1 homolog (Isca1), cytochrome c oxidase polypeptide VIIa (Cox7A1), sulfide:quinone oxidoreductase (Sqrdl), and L-2-hydroxyglutarate dehydrogenase (L2hgdh). Although reports in the literature suggest a reduced expression of genes reflecting oxidative capacity in skeletal muscle from human diabetics (Mootha et al., 2003; Patti et al., 2003), our results suggest just the opposite in GK animals. This may reflect an increased capacity to oxidize lipid fuels, which may in turn be a compensation for a reduced capacity to bring in glucose. This conclusion is further supported by the observations that expression of Abca1 which mediates the first step of reverse cholesterol transport and Aqp7 which is responsible for the glycerol efflux from skeletal muscle is higher in the GK muscles (Supplementary Tables 2 and 3).
Figure 5. Differential expression of genes associated with energy metabolism.
Examples of differentially regulated energy metabolism-related genes in GK and WKY rats as a function of age. The Y-axis represents non-normalized probe set intensities. N = 5. Data reflect means and error bars 1 SD of the mean. Closed circles = GK; open circles = WKY. * = P < 0.05; ** = P < 0.001.
3.5.2 Genes related to signal transduction
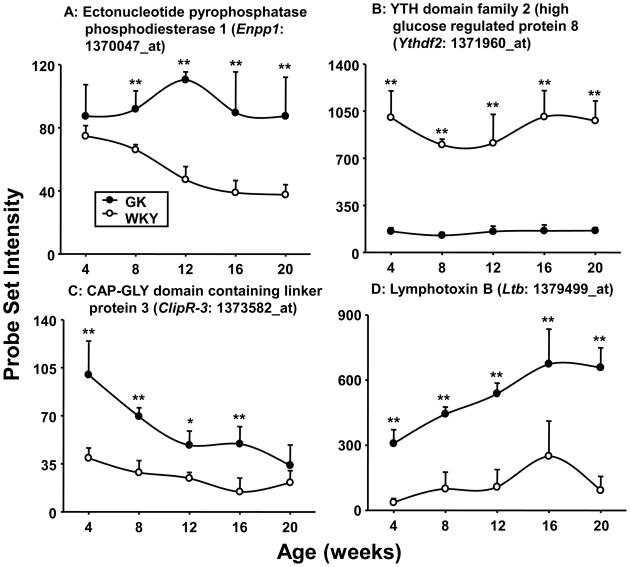
Previous reports have documented decreased glucose uptake as well as alterations in intracellular GLUT-4 trafficking in GK muscles (Bitar et al., 2005; Krook et al., 1997; Mulvey et al., 2005). Various defects in insulin signal transduction in muscles from GK rats, including decreased receptor autophosphorylation and decreased IRS-1 tyrosine phosphorylation, have been also reported (Bitar et al., 2005; Dadke et al., 2000; Kanoh et al., 2001; Krook et al., 1997; Steiler et al., 2003). The expression of several genes associated with signal transduction noted here provides additional insight into the difference between muscles from the GK and WKY animals. Ectonucleotide pyrophosphatase phosphodiesterase1 (Enpp1), which interferes with insulin signaling, shows higher expression in GK muscle at all ages (Figure 6A). Increased expression of the gene for ENPP1 has also been documented in human type 2 diabetic patients (Abate et al., 2005; Zhou et al., 2009). In addition, transgenic mice overexpressing ENPP1 become both hyperglycemic and hyperinsulinemic (Maddux et al., 2006). ENPP1 interferes with insulin signaling by inhibiting the insulin-induced conformational changes that lead to insulin receptor autophosphorylation and tyrosine kinase activation (Goldfine et al., 2008).
Figure 6. Differential expression of genes involved in signaling processes.
Examples of differentially regulated signaling-related genes in GK and WKY rats as a function of age. The Y-axis represents non-normalized probe set intensities. N = 5. Data depict means and error bars 1 SD of the mean. Closed circles = GK; open circles = WKY). * = P < 0.05; ** = P < 0.001
The expression of YTH domain family 2 (Ythdf2), also known as high glucose regulated protein 8 (HGRG8), may also reflect the insulin-resistant status of these muscles. The expression of this gene that may play a role in insulin/insulin like growth factor signaling is enhanced in normal muscle by insulin (Rome et al., 2003). Its expression is very low in the musculature of the hyperglycemic GK population despite normal or increased plasma insulin in these animals, while reasonably high and relatively stable in the WKY musculature (Figure 6B). The fact that its expression in the hyperglycemic/hyperinsulinemic GK animals is very low provides a clear indication of lack of responsiveness to insulin by the GK musculature.
Although there are indications that the GK musculature is not responding to insulin, it is also clear that some aspects of their response mechanisms are not defective, but also actually may be heightened. For example, the expression of Cytoplasmic Linker Protein 170-Related Protein (CLIPR-3 aka ClipR-59) which is higher in muscles from GK animals, may suggest that there are compensatory changes in the GLUT4 regulation pathway in the GK musculature (Figure 6C). Activation of insulin signaling in skeletal muscle results in the redistribution of GLUT4 from an internal subcellular compartment to the plasma membrane. One aspect of this redistribution of GLUT4 is the movement of the insulin activated serine-threonine protein kinase, AKT, to a subcellular compartment and the phosphorylation of Akt substrate of 160 kD (AS160). The phosphorylation of AS160 is an essential step in the translocation of GLUT4 to the plasma membrane. The interaction of ClipR-3 with activated AKT mediates its redistribution to the subcellular compartment where it phosphorylates AS160 (Ding and Du, 2009). Impairment of insulin action on AKT has previously been reported in muscle from GK animals (Krook et al., 1997). The higher expression of ClipR-3 in GK muscles may reflect a compensatory increase in latter aspects of the transduction mechanism in response to reduced activity upstream.
Another example of differences in expression of messages for signaling molecules is lymphotoxin B (Ltb) (Figure 6D), a member of the TNF superfamily that is secreted by activated lymphocytes and is involved in natural immunity. The higher expression of Ltb at all ages in the musculature of GK animals is probably vascular in origin and suggests the presence of chronic inflammation which agrees with the higher levels of white blood cells in these animals
3.5.3 Genes related to inflammation
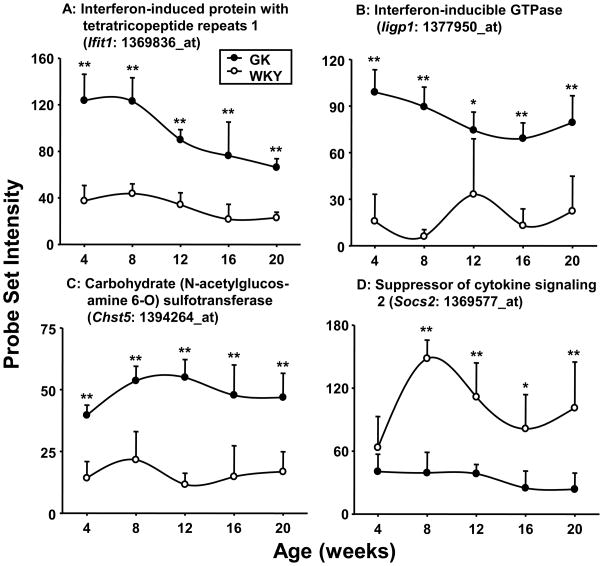
Consistent with the expression pattern of Ltb, the expression of interferon-induced protein with tetratricopeptide repeats 1 (Ifit1) which is associated with chronic inflammation and insulin resistance is substantially higher at all ages in the GK population (Figure 7A) as is the interferon-inducible GTPase (Iigp1) (Figure 7B). It should be noted that both of these genes were more highly expressed in both liver [4] and adipose tissue (data not shown) from these same animals. Likewise the expression of carbohydrate (N-acetylglucosamine 6-O) sulfotransferase (Chst5) which is up-regulated by cytokine activation also indicates chronic inflammation in GK animals (Figure 7C). Just as the increased expression of some genes suggests heightened inflammation in the GK muscles, the lower expression of other genes may also indicate inflammation. For example, the expression of suppressors of cytokine signaling 2 (Socs2) which has anti-inflammatory properties by suppressing the signaling of pro-inflammatory cytokines is higher in the WKY muscles (Figure 7D). The significance of this observation may be the low level of expression in the GK rather than the higher expression in WKY muscle.
Figure 7. Differential expression of genes involved in immune regulation.
Examples of differentially regulated immune/inflammatory-related genes in GK and WKY rats as a function of age. The Y-axis represents non-normalized probe set intensities. N = 5. Data reflect means and error bars 1 SD of the mean. Closed circles = GK; open circles = WKY). * = P < 0.05; ** = P < 0.001
Increasing evidence is being developed suggesting a causal link between type 2 diabetes and the chronic inflammation associated with obesity (Wellen and Hotamisligil, 2005). However, this study provides evidence that chronic inflammation in the absence of obesity is also associated with type 2 diabetes. In addition to the microarray data, it is quite relevant that the white blood cell count was substantially higher at all ages in the GK population (Figure 4). In this regard, it is important that chronic muscle inflammation is predisposing to the development of type 2 diabetes. For example, muscular dystrophies generally involve chronic muscle inflammation. Myotonic dystrophy is the most common inherited form of muscle dystrophy among adults. Along with the muscle pathology is the increased incidence of insulin resistance and hyperinsulinemia in myotonic patients (Moxley et al., 1978).
3.5.4 Advantages and limitations of gene array studies
Gene arrays are a powerful tool allowing the simultaneous measurement of expression of thousands of genes in a single sample. However, gene arrays simply provide a snapshot of the concentration of mRNAs at one point in time. The results reflect the potential available at that time for the production of proteins, not the expression of the proteins themselves. However, when used in a time series as we have done in this experiment, we are able to observe how that potential changes with disease development and progression. As evident from the examples of differentially regulated genes presented here, expression differences are not simply “up” or “down”, but often exhibit distinct age-related patterns of differential expression. In addition, a time series design such as this greatly reduces the number of false positives that might be obtained in array studies if only two groups at a single age were compared and greatly abbrogates the need for confirmation by additional methods. In fact, it is possible that our rather stringent filtering criteria may in fact eliminate some genes of potential interest. Because our mining approach eliminated probe sets that did not exhibit a difference in expression of at least 2-fold at 3 or more ages studied, it is possible that genes showing a significant but less than 2-fold difference would be eliminated. The choice of a minimum 2-fold difference as a criterion for differential expression is arbitrary. The necessity of using some arbitrary cutoff is a shortcoming of such studies, and it is quite possible that genes showing a lesser degree of differential expression may still be relevant to the pathophysiology of the disease. Likewise, genes exhibiting differential regulation at only 1 or 2 ages would be eliminated from further examination. However, the submission of our entire dataset to the NCBI GEO should allow other investigators to explore other data mining approaches.
4. Conclusions
Because the musculature is responsible for about eighty percent of the systemic insulin directed glucose disposal, this tissue must be involved in all forms of type 2 diabetes regardless of cause. We examined diabetes disease progression from 4 weeks to 20 weeks of age with a focus on differential gene expression in skeletal muscle in non-obese GK rats relative to normoglycemic control WKY rats. Differential gene expression in diabetic and control muscles support the presence of insulin resistance (as indicated by HOMA-IR data) and chronic inflammation (as indicated by WBC counts), and also suggest alterations in oxidative capacity. The presence of chronic inflammation is suggested, which was also previously observed in liver [4], despite the absence of obesity in these animals. The results support the hypothesis that chronic inflammation contributes to diabetes in the GK rat in the absence of obesity.
Supplementary Material
Acknowledgments
This work was partly supported by grant GM 24211 from the National Institute of General Medical Sciences, NIH, Bethesda, MD, and by funds from the UB-Pfizer Strategic Alliance.
Footnotes
Publisher's Disclaimer: This is a PDF file of an unedited manuscript that has been accepted for publication. As a service to our customers we are providing this early version of the manuscript. The manuscript will undergo copyediting, typesetting, and review of the resulting proof before it is published in its final citable form. Please note that during the production process errors may be discovered which could affect the content, and all legal disclaimers that apply to the journal pertain.
Contributor Information
Jing Nie, Email: jnie2@buffalo.edu.
Bai Xue, Email: baixue@buffalo.edu.
Siddharth Sukumaran, Email: ss439@bubuffalo.edu.
William J. Jusko, Email: wjjusko@buffalo.edu.
Debra C. DuBois, Email: dubois@buffalo.edu.
Richard R. Almon, Email: almon@buffalo.edu.
References
- Abate N, Chandalia M, Satija P, Adams-Huet B, Grundy SM, Sandeep S, Radha V, Deepa R, Mohan V. ENPP1/PC-1 K121Q Polymorphism and Genetic Susceptibility to Type 2 Diabetes. Diabetes. 2005;54:1207–1213. doi: 10.2337/diabetes.54.4.1207. [DOI] [PubMed] [Google Scholar]
- Almon RR, DuBois DC, Lai W, Xue B, Nie J, Jusko WJ. Gene expression analysis of hepatic roles in cause and development of diabetes in Goto-Kakizaki rats. J Endocrinol. 2009;200:331–46. doi: 10.1677/JOE-08-0404. [DOI] [PubMed] [Google Scholar]
- Almon RR, DuBois DC, Yao Z, Hoffman EP, Ghimbovschi S, Jusko WJ. Microarray analysis of the temporal response of skeletal muscle to methylprednisolone: comparative analysis of two dosing regimens. Physiol Genomics. 2007;30:282–299. doi: 10.1152/physiolgenomics.00242.2006. [DOI] [PMC free article] [PubMed] [Google Scholar]
- Bergman RN, Ader M. Free fatty acids and pathogenesis of type 2 diabetes mellitus. Trends Endocrinol Metab. 2000;11:351–6. doi: 10.1016/s1043-2760(00)00323-4. [DOI] [PubMed] [Google Scholar]
- Bisbis S, Bailbe D, Tormo MA, Picarel-Blanchot F, Derouet M, Simon J, Portha B. Insulin resistance in the GK rat: decreased receptor number but normal kinase activity in liver. Am J Physiol. 1993;265:E807–13. doi: 10.1152/ajpendo.1993.265.5.E807. [DOI] [PubMed] [Google Scholar]
- Bitar MS, Al-Saleh E, Al-Mulla F. Oxidative stress--mediated alterations in glucose dynamics in a genetic animal model of type II diabetes. Life Sci. 2005;77:2552–73. doi: 10.1016/j.lfs.2005.01.033. [DOI] [PubMed] [Google Scholar]
- Brunetti P. The lean patient with type 2 diabetes: characteristics and therapy challenge. Int J Clin Pract Suppl. 2007:3–9. doi: 10.1111/j.1742-1241.2007.01359.x. [DOI] [PubMed] [Google Scholar]
- Cacho J, Sevillano J, de Castro J, Herrera E, Ramos MP. Validation of simple indexes to assess insulin sensitivity during pregnancy in Wistar and Sprague-Dawley rats. Am J Physiol Endocrinol Metab. 2008;295:E1269–76. doi: 10.1152/ajpendo.90207.2008. [DOI] [PubMed] [Google Scholar]
- Copp SW, Hageman KS, Behnke BJ, Poole DC, Musch TI. Effects of Type II diabetes on exercising skeletal muscle blood flow in the rat. J Appl Physiol. 109:1347–53. doi: 10.1152/japplphysiol.00668.2010. [DOI] [PMC free article] [PubMed] [Google Scholar]
- Dadke SS, Li HC, Kusari AB, Begum N, Kusari J. Elevated expression and activity of protein-tyrosine phosphatase 1B in skeletal muscle of insulin-resistant type II diabetic Goto-Kakizaki rats. Biochem Biophys Res Commun. 2000;274:583–9. doi: 10.1006/bbrc.2000.3188. [DOI] [PubMed] [Google Scholar]
- Ding J, Du K. ClipR-59 Interacts with Akt and Regulates Akt Cellular Compartmentalization. Molecular and Cellular biology. 2009;29:1459–1471. doi: 10.1128/MCB.00754-08. [DOI] [PMC free article] [PubMed] [Google Scholar]
- Frangioudakis G, Cooney GJ. Acute elevation of circulating fatty acids impairs downstream insulin signalling in rat skeletal muscle in vivo independent of effects on stress signalling. J Endocrinol. 2008;197:277–85. doi: 10.1677/JOE-07-0623. [DOI] [PubMed] [Google Scholar]
- Goldfine ID, Maddux BA, Youngren JF, Reaven G, Accili D, Trischitta V, Vigneri R, Frittitta L. The Role of Membrane Glycoprotein Plasma Cell Antigen 1/Ectonucleotide Pyrophosphatase Phosphodiesterase 1 in the Pathogenesis of Insulin Resistance and Related Abnormalities. Endocrine Reviews. 2008;29:62–75. doi: 10.1210/er.2007-0004. [DOI] [PMC free article] [PubMed] [Google Scholar]
- Goto Y, Suzuki K, Ono T, Sasaki M, Toyota T. Development of diabetes in the non-obese NIDDM rat (GK rat) Adv Exptl Med Biol. 1988;246:29–31. doi: 10.1007/978-1-4684-5616-5_4. [DOI] [PubMed] [Google Scholar]
- Hundal RS, Krssak M, Dufour S, Laurent D, Lebon V, Chandramouli V, Inzucchi SE, Schumann WC, Petersen KF, Landau BR, Shulman GI. Mechanism by which metaformin reduces glucose production in type 2 diabetes. Diabetes. 2000;49:2063–2069. doi: 10.2337/diabetes.49.12.2063. [DOI] [PMC free article] [PubMed] [Google Scholar]
- Kanoh Y, Bandyopadhyay G, Sajan MP, Standaert ML, Farese RV. Rosiglitazone, insulin treatment, and fasting correct defective activation of protein kinase C-zeta/lambda by insulin in vastus lateralis muscles and adipocytes of diabetic rats. Endocrinology. 2001;142:1595–605. doi: 10.1210/endo.142.4.8066. [DOI] [PubMed] [Google Scholar]
- Koistinen HA, Zierath JR. Regulation of glucose transport in human skeletal muscle. Annals Med. 2002;34:410–418. doi: 10.1080/078538902321012351. [DOI] [PubMed] [Google Scholar]
- Krook A, Kawano Y, Song XM, Efendic S, Roth RA, Wallberg-Henriksson H, Zierath JR. Improved glucose tolerance restores insulin-stimulated Akt kinase activity and glucose transport in skeletal muscle from diabetic Goto-Kakizaki rats. Diabetes. 1997;46:2110–4. doi: 10.2337/diab.46.12.2110. [DOI] [PubMed] [Google Scholar]
- Maddux BA, Chang Y-N, Accili D, McGuinness OP, Youngren JF, Goldfine ID. Overexpression of the insulin receptor inhibitor PC-1/ENPP1 induces insulin resistance and hyperglycemia. Am J Physiol Endocrinol Metab. 2006;290:E746–E749. doi: 10.1152/ajpendo.00298.2005. [DOI] [PubMed] [Google Scholar]
- Matthews DR, Hosker JP, Rudenski AS, Naylor BA, Treacher DF, Turner RC. Homeostasis model assessment: insulin resistance and B-cell function from fasting plasma glucose and insulin concentrations in man. Diabetologia. 1985;28:412–419. doi: 10.1007/BF00280883. [DOI] [PubMed] [Google Scholar]
- Mootha VK, Lindgren CM, Eriksson KF, Subramanian A, Sihag S, Lehar J, Puigserver P, Carlsson E, Ridderstrale M, Laurila E, Houstis N, Daly MJ, Patterson N, Mesirov JP, Golub TR, Tamayo P, Spiegelman B, Lander ES, Hirschhorn JN, Altshuler D, Groop LC. PGC-1 alpha-responsive genes involved in oxidative phosphorylation are coordinately downregulated in human diabetes. Nat Genet. 2003;34:267–73. doi: 10.1038/ng1180. [DOI] [PubMed] [Google Scholar]
- Moxley RT, 3rd, Griggs RC, Goldblatt D, VanGelder V, Herr BE, Thiel R. Decreased insulin sensitivity of forearm muscle in myotonic dystrophy. J Clin Invest. 1978;62:857–67. doi: 10.1172/JCI109198. [DOI] [PMC free article] [PubMed] [Google Scholar]
- Mulvey C, Harno E, Keenan A, Ohlendieck K. Expression of the skeletal muscle dystrophin-dystroglycan complex and syntrophin-nitric oxide synthase complex is severely affected in the type 2 diabetic Goto-Kakizaki rat. Eur J Cell Biol. 2005;84:867–83. doi: 10.1016/j.ejcb.2005.06.007. [DOI] [PubMed] [Google Scholar]
- Padilla DJ, McDonough P, Behnke BJ, Kano Y, Hageman KS, Musch TI, Poole DC. Effects of Type II diabetes on capillary hemodynamics in skeletal muscle. Am J Physiol Heart Circ Physiol. 2006;291:H2439–44. doi: 10.1152/ajpheart.00290.2006. [DOI] [PubMed] [Google Scholar]
- Padilla DJ, McDonough P, Behnke BJ, Kano Y, Hageman KS, Musch TI, Poole DC. Effects of Type II diabetes on muscle microvascular oxygen pressures. Respir Physiol Neurobiol. 2007;156:187–95. doi: 10.1016/j.resp.2006.08.008. [DOI] [PubMed] [Google Scholar]
- Patti ME, Butte AJ, Crunkhorn S, Cusi K, Berria R, Kashyap S, Miyazaki Y, Kohane I, Costello M, Saccone R, Landaker EJ, Goldfine AB, Mun E, DeFronzo R, Finlayson J, Kahn CR, Mandarino LJ. Coordinated reduction of genes of oxidative metabolism in humans with insulin resistance and diabetes: Potential role of PGC1 and NRF1. Proc Natl Acad Sci U S A. 2003;100:8466–71. doi: 10.1073/pnas.1032913100. [DOI] [PMC free article] [PubMed] [Google Scholar]
- Portha B. Programmed disorders of B-cell development and function as one cause for type 2 diabetes? The GK rat paradigm. Diabet Metabol Res Rev. 2005;21:495–504. doi: 10.1002/dmrr.566. [DOI] [PubMed] [Google Scholar]
- Rome S, Clement K, Rabasa-Lhoret R, Loizon E, Poitou C, Barsh GS, Riou J-P, Laville M, Vidal H. Microarray Profiling of Human Skeletal Muscle Reveals That Insulin Regulates ~800 Genes during a Hyperinsulinemic Clamp. The Journal of Biological Chemistry. 2003;278:18063–18068. doi: 10.1074/jbc.M300293200. [DOI] [PubMed] [Google Scholar]
- Steiler TL, Galuska D, Leng Y, Chibalin AV, Gilbert M, Zierath JR. Effect of hyperglycemia on signal transduction in skeletal muscle from diabetic Goto-Kakizaki rats. Endocrinology. 2003;144:5259–67. doi: 10.1210/en.2003-0447. [DOI] [PubMed] [Google Scholar]
- Wallace TM, Levy JC, Matthews DR. Use and abuse of HOMA modeling. Diabetes Care. 2004;27:1487–1495. doi: 10.2337/diacare.27.6.1487. [DOI] [PubMed] [Google Scholar]
- Wellen KE, Hotamisligil GS. Inflammation, stress, and diabetes. J Clin Invest. 2005;115:1111–9. doi: 10.1172/JCI25102. [DOI] [PMC free article] [PubMed] [Google Scholar]
- Yasuda K, Nishikawa W, Iwanaka N, Nakamura E, Seino Y, Tsuda K, Ishihara A. Abnormality in fibre type distribution of soleus and plantaris muscles in non-obese diabetic Goto-Kakizaki rats. Clin Exp Pharmacol Physiol. 2002;29:1001–8. doi: 10.1046/j.1440-1681.2002.03757.x. [DOI] [PubMed] [Google Scholar]
- Yuan J. Modeling blood/plasma concentrations in dosed feed and dosed drinking water toxicology studies. Toxicol Appl Pharmacol. 1993;119:131–41. doi: 10.1006/taap.1993.1052. [DOI] [PubMed] [Google Scholar]
- Zhou HH, Chin CN, Wu M, Ni W, Quan S, Liu F, Dallas-Yang Q, Ellsworth K, Ho T, Zhang A, Natasha T, Li J, Chapman K, Strohl W, Li C, Wang IM, Berger J, An Z, Zhang BB, Jiang G. Suppression of PC-1/ENPP-1 expression improves insulin sensitivity in vitro and in vivo. European Journal of Pharmacology. 2009;616:346–352. doi: 10.1016/j.ejphar.2009.06.057. [DOI] [PubMed] [Google Scholar]
Associated Data
This section collects any data citations, data availability statements, or supplementary materials included in this article.


