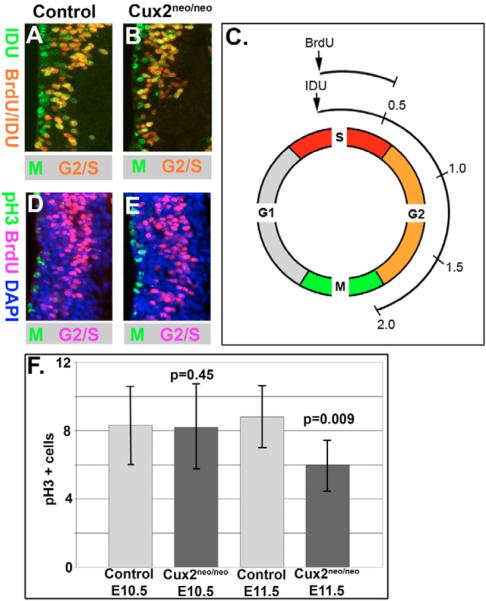
Fig. 4. Reduced cell cycle progression in Cux2 mutants.
(A,B) Detection of M phase by IDU (green), S phase by BrdU (red) and G2/S phase by IDU/BrdU (yellow/orange) labeling in E10.5 forelimb bud level neural tubes of control Cux2neo/+ (A) and Cux2neo/neo mutant (B) littermates. (C) Schematic of IDU and BrdU pulsing regime of E10.5 pregnant dams from Cux2+/− intercrosses. (D,E) G2/S- and M-phase labeling by BrdU (fuchsia) and pH3 (green) immunohistochemistry, respectively, in neural tubes of E10.5 control (D) and Cux2neo/neo mutants. (F) Bar chart summarizing pH3 counts in forelimb level neural tubes at E10.5 and 11.5. Cux2neo/neo mutants displayed normal levels of pH3 staining at E10.5, but showed significant decreases in pH3 counts at E11.5 (P=0.009).

