

Abstract
Complete lecithin cholesterol acyltransferase (LCAT) deficiency uniformly results in a profound HDL deficiency. We recently reported unexpected enhanced insulin sensitivity in LCAT knock-out mice in the LDL receptor knock-out background (Ldlr−/−×Lcat−/−; double knock-out (DKO)), when compared with their Ldlr−/−×Lcat+/+ (single knock-out (SKO)) controls. Here, we report that LCAT-deficient mice (DKO and Lcat−/−) are protected against high fat high sucrose (HFHS) diet-induced obesity without hypophagia in a gender-specific manner compared with their respective (SKO and WT) controls. The metabolic phenotypes are more pronounced in the females. Changes in endoplasmic reticulum stress were examined as a possible mechanism for the metabolic protection. The female DKO mice developed attenuated HFHS-induced endoplasmic reticulum stress as evidenced by a lack of increase in mRNA levels of the hepatic unfolded protein response (UPR) markers Grp78 and CHOP compared with SKO controls. The DKO female mice were also protected against diet-induced insulin resistance. In white adipose tissue of chow-fed DKO mice, we also observed a reduction in UPR, gene markers for adipogenesis, and markers for activation of Wnt signaling. In skeletal muscles of female DKO mice, we observed an unexpected increase in UCP1 in association with increase in phospho-AMPKα, PGC1α, and UCP3 expressions. This increase in UCP1 was associated with ectopic islands of brown adipocytes between skeletal muscle fibers. Our findings suggest that LCAT deficiency confers gender-specific protection against diet-induced obesity and insulin resistance at least in part through regulation in UPR, white adipose tissue adipogenesis, and brown adipocyte partitioning.
Keywords: Adipose Tissue, Endoplasmic Reticulum (ER), Energy Metabolism, LCAT, Obesity, Brown Adipose Tissue, Uncoupling Protein 1, Wnt Signaling
Introduction
LCAT2 is an important enzyme in the regulation of high density lipoprotein (HDL) metabolism and in modulating plasma HDL cholesterol levels. LCAT mediates the esterification of cholesterol primarily in HDL but also to a limited extent in LDLs. Familial complete LCAT deficiency in humans is characterized by extremely low levels of plasma HDL cholesterol. In addition, commonly observed lipid phenotypes include elevated plasma level of phospholipid, free cholesterol to cholesterol ester ratio, and modest hypertriglyceridemia, the latter characterized by combined hepatic triglyceride overproduction and partially reduced lipoprotein lipase activity (1, 2). Recent human studies in a large cohort of subjects with familial LCAT deficiencies suggest that low LCAT may protect against atherosclerosis (3). However, studies in subjects with low LCAT in the general population yielded conflicting results (4). On the other hand, the potential role for LCAT in the modulation of glucose and energy homeostasis has received little attention. Our laboratory was the first to report that, in the LDL receptor knock-out mouse background and under chow-fed conditions, the genetic absence of LCAT (Ldlr−/−×Lcat−/− mice) is associated with enhanced insulin sensitivity when compared with the Ldlr−/−×Lcat+/+ control mice (4, 5). The impact of these novel phenotypes in response to obesogenic and diabetogenic stresses remains to be fully elucidated.
It has recently been shown that hepatic and adipose tissue endoplasmic reticulum (ER) stress plays an important role in the development of insulin resistance. In both HFHS diet-induced and leptin-deficient genetic (ob/ob) models of obesity and insulin resistance, expression of the unfolded protein response (UPR) has been shown to be up-regulated in both the liver and adipose tissue but not skeletal muscle (6). Although the mechanism of activation of UPR in these two models is not well understood, treatment of these obese models with the small molecule chaperone phenylbutyrate led to rapid resolution of insulin resistance even prior to any significant weight loss (7). In humans, ER stress has been demonstrated in adipose tissue in obese, insulin-resistant nondiabetic subjects (8, 9). More recently, Gregor et al. (10) reported significant reduction in a number of ER stress markers in liver and adipose tissues in subjects who lost weight in response to gastric lap banding operations.
Alterations in ER stress has been linked to adipogenesis in white fat. In 3T3L1 cells, palmitate treatment induces preadipocyte ER stress with concomitant inhibition of the canonical Wnt signaling pathway (11), the latter pathway being known to inhibit adipogenesis through activation and nuclear localization of β-catenin. Basseri et al. (12) recently reported that resolution of ER stress in 3T3L1 preadipocytes through chemical chaperone treatment inhibits adipogenesis, although the role of Wnt signaling was not examined. Skeletal muscle is a major organ involved in not only insulin-stimulated glucose uptake but also in fatty acid oxidation, as well as thermogenesis.
PGC1α in skeletal muscle has been shown to play critical roles in (a) stimulating thermogenesis; (b) activating genes in oxidative phosphorylation; (c) stimulating mitochondrial biogenesis; and (d) activating GLUT4 expression (13). Pathophysiologically, skeletal muscle PGC1α mRNA expression is down-regulated along with a panel of genes in mitochondrial oxidative phosphorylation in humans with insulin resistance or diabetes (14), as well as in rodent models of obesity, insulin resistance, and/or diabetes (15, 16). Modest tissue-specific overexpression of PGC1α in skeletal muscle showed favorable metabolic changes (17) that include an increase in mitochondrial biogenesis, expression of FAT/CD36, GLUT4, and AMPKα2, and insulin sensitivity.
UCP3, like UCP1, is a member of the mitochondrial anion carrier protein family that is expressed highly and selectively in skeletal muscle. However, recent studies suggest that the major metabolic function of UCP3 is that of facilitating fatty acid transport and oxidation (18, 19).
UCP1 is predominantly expressed in brown adipose tissue, and it is regarded as the only bona fide uncoupling protein (20). Brown adipose tissue shares the same lineage as skeletal muscle, and it has been shown that PRDM16 serves as a key switch between skeletal muscle or brown fat development from the Myf5 positive progenitor cells (21, 22). UCP1 also express in white adipose tissues under specific conditions. Ectopic brown adipose-like cells expressing UCP1 in skeletal muscle were recently reported in the 129S6/SvEvTac inbred strain, putatively accounting for the relative protection from obesity, hyperglycemia, and insulin resistance (23). The lineage origin of the ectopic brown fat has not been established. The presence of UCP1 expression in WAT can be achieved through transdifferentiation of WAT into brown fat-like adipose tissue, most notably under cold exposure or direct β3 adrenergic stimulation (24). A recent study by Seale et al. (25) showed that expression of PR domain containing 16 (PRDM16) in selective WAT depots can generate a brown adipogenic program, expressing UCP1 and PDRM16.
Here we expand our investigation to whether LCAT-deficient mice are also protected against diet-induced obesity and to explore the underlying mechanisms. We examined the effect of LCAT deficiency in both the LDLR knock-out and in the wild type background treated with both chow and the obesogenic and diabetogenic high fat high sucrose (HFHS) diet to further elucidate the direct role of LCAT in these phenotypes. We hypothesize that hepatic ER stress plays a contributory role in the observed metabolic phenotypes, and we also provide evidence for presence of ectopic, UCP1-expressing brown adipose tissue in the skeletal muscle of the LCAT-deficient mice.
EXPERIMENTAL PROCEDURES
Animals
C57Bl/6 mice and Ldlr−/− mice in C57Bl/6 background were acquired from Jackson Laboratories. As reported earlier, Lcat−/− mice were backcrossed with C57Bl/6 females for more than seven generations (26). Ldlr−/− mice crossed with Lcat−/− mice generated double heterozygous offspring, Ldlr+/−×Lcat+/−, which were then cross-bred to create Ldlr−/−×Lcat−/− double knock-out (DKO) mice. The controls used were Ldlr−/−×Lcat+/+ mice and the C57Bl/6 WT mice. All of the mice used were age- and gender-matched and fed a regular chow diet or a high fat high sucrose diet (Bio-Serv F3282) (6). Chow-fed studies were carried out for mice at 12–14 weeks or 24–26 weeks of age. HFHS diet-fed studies were carried out after 24 or 42 weeks of diet treatment, beginning at 9 weeks of age. The experimental procedures used were approved by the Animal Care Committee at St. Michael's Hospital. All of the mice were fasted overnight before being sacrificed. The liver samples were flash-frozen in liquid nitrogen and stored at −80 °C.
Plasma Lipid Analyses
Plasma lipid analyses were performed on mice after 24–26 weeks of HFHS diet treatment. The samples were obtained after an overnight fast and pooled for analysis for total cholesterol, triglycerides, glycerol (to allow for correction of the triglyceride values), free cholesterol, and choline phospholipids as previously described (27).
mRNA Quantitation of Hepatic, Adipose Tissues, and Skeletal Muscle Genes
RNA was extracted from the liver, white and brown adipose tissues, and skeletal muscle using TRIzol (Invitrogen) as described previously (5). For real time PCR analysis, RNA was reverse transcribed using QuantiTect reverse transcription kit following the manufacturer's protocol (Qiagen) and SYBR Green PCR master mix (Applied Biosystems, Foster City, CA) was used in quantitative PCR and was conducted in the ABI PRISM machine 7900HT sequence detection system operated with the respective SDS software (version 2.1). GAPDH was used as an internal control. Specific primers were synthesized based on mouse cDNA sequences from GenBank. Primer pairs used to amplify these genes were as follows (forward and reverse, respectively): Grp78, 5′-tcagcatcaagcaaggattg and 3′-cttcaaatttggcccgagta; CHOP, 5′-ctgcctttcaccttggagac and 3′-tataggtgcccccattttca; c-myc, 5′-cccattgcagcgggcagaca and 3′-atcgcgggcagaggcagaga; CyclinD1, 5′-ccaggcccagcagaacgtcg and 3′-ccgggctggctccttcctct; Axin2, 5′-taggcggaatgaagatggac and 3′-ctggtcacccaacaaggagt; Pparγ, 5′-gatggaagaccactcgcatt and 3′-aaccattgggtcagctcttg; Cebpα, 5′-ctcccagaggaccaatgaaa and 3′-aagtcttagccggaggaagc; Pgc1α, 5′-caaccgcagtcgcaacatgct and 3′-ggggaacccttggggtcatttgg; Ndusf1, 5′-ggtagctgctttggaccttg and 3′-agcattttgggagggttctt; Ucp3, 5′-gtggaaagggacttggcccaaca and 3′-cagctccaaaggcagagacaaagtga; Ucp1, 5′-actgccacacctccagtcatt and 3′-ctttgcctcactcaggattgg; and Gapdh, 5′-acccagaagactgtggatgg and 3′-ggatgcagggatgatgttct. The primers were synthesized by Integrated DNA Technologies at the Hospital for Sick Children (Toronto, Canada). The optimized PCR protocol included an initial denaturation step of 95 °C for 10 min, followed by 40 cycles of 95 °C for 15 s, 62 °C for 1 min, and 95 °C for 15 s. Fluorescence measurements were made in every cycle, and they were determined at 494–521 nm. Specificity of each reaction was determined after amplification was complete. This was achieved by performing the dissociation stage (60 °C for 15 s and 95 °C for 15 s). The relative mRNA expression was determined using the comparative Ct method by calculating 2[−ΔΔCt].
Western Blot Analysis of Hepatic Protein in ER Stress
Liver samples (50–150 mg) were homogenized in 0.3 ml of ice-cold radioimmune precipitation assay lysis buffer containing 0.1 mol/liter K2HPO4, 0.25 mol/liter sucrose, and 1 mmol/liter EDTA, pH 7.4. A protease inhibitor mixture (Sigma) was added, and the sample was homogenized. The homogenate was then centrifuged for 15 min at 12,000 × g (4 °C) to remove cell debris. Protein concentrations in the supernatant were determined using the MicroBCA protein assay kit (Pierce), using the manufacturer's suggested protocol. Phospho-c-jun, phospho-PERK, and phospho-eIF2α mass levels were analyzed, and β-actin was used as the internal control. Rabbit polyclonal anti-phospho-c-jun, anti-phospho-PERK, and anti-phospho-eIF2α antibodies were purchased from Cell Signaling Technology (New England Biolabs, Pickering, Canada). Protein (100 μg) was analyzed after suspension in 2× SDS loading buffer (120 mm Tris-HCl, pH 6.8, 20% glycerol, 4% SDS, 4% 2-mercaptoethanol, and 0.02% bromphenol blue), and the samples were denatured at 95 °C for 5 min. The proteins were separated by 8% SDS-PAGE, which was run at constant voltage of 120 V for 2 h. The proteins were then transferred to a PVDF membrane. The membrane was washed with TBST (10 mm Tris-HCl, pH 7.6, 0.15 m NaCl, 0.1% Tween 20) three times for 5 min each and blocked for 1 h with TBST buffer containing 5% skim milk. The membranes were then incubated with antibodies to phospho-c-jun (1:1000 dilution), phospho-PERK (1:1000 dilution), phospho-eIF2α (1:1000 dilution), and β-actin membranes were rinsed with TBST buffer followed by incubation with horseradish peroxidase-conjugated anti-rabbit IgG for 1 h (Cayman Chemicals, Burlington, Canada). The membranes were treated with Amersham Biosciences ECL Western blotting detection reagents for visualization of the bands. Quantitative densitometry of immunoblots was performed, and the relative content of each sample protein was calculated based on the relative optical density value after normalizing by the optical density value of the internal control.
Western Blot Analysis of Skeletal Muscle Proteins
After an overnight fast, the mice were sacrificed, and the quadriceps muscles were immediately dissected and snap frozen in liquid N2. RNA and protein extractions were carried out as described above. Anti-UCP1 was purchased from Calbiochem (San Diego, CA), anti-PRDM16 was from Abcam (San Francisco, CA), and anti-tubulin and anti-P-AMPK were from Cell Signalling Technology (New England Biolabs, Pickering, Canada).
Western Blot Analysis of Fat Depot Proteins
After an overnight fast, the mice were sacrificed, and fat tissues from specific depots: interscapular brown adipose tissue (iBAT), subcutaneous white adipose tissue (sWAT), inguinal WAT (ingWAT), and epididymal WAT, were immediately dissected and snap frozen in liquid N2. RNA and protein extractions were carried out as described above.
Glucose Tolerance Test
After an overnight fast, serial plasma glucose levels were determined by glucometer after an intraperitoneal bolus injection of glucose at 1.125 g/kg of body weight as previously described (28).
Insulin Tolerance Test (ITT)
After a 6-h fast, the study mice were subjected to intraperitoneal ITT as previously described (5).
Indirect Calorimetry
The metabolic rate of mice was measured by indirect calorimetry in open circuit Oxymax chambers of the Comprehensive Lab Animal Monitoring System (Columbus Instruments, Columbus, OH). The mice were housed singly and maintained at ∼23 °C under a 12-h/12-h light-dark cycle. Food and water were available ad libitum. All of the mice were acclimatized to monitoring cages for 24 h prior to the beginning of an additional 78 h of continuous recordings of physiological parameters. The mice were weighed prior to each trial. Sample air was passed through an O2 sensor (Columbus Instruments) for determination of O2 content. VO2 and VCO2 were determined. The analyses were performed using the CLAX software as supplied by the manufacturer. The respiratory exchange ratio (RER) was calculated as VCO2/VO2, heat production was calculated as VO2 × [3.815 ± 1.232 × RER]. Activity was determined by the sum of x and z axis counts.
Electron Microscopy
The skeletal muscle was freshly dissected from the quadriceps muscle groups and fixed in 4% paraformaldehyde and 1% glutaraldehyde and secondarily fixed in 1% osmium tetraoxide buffered with 0.1 m phosphate. After washing, the samples were dehydrated sequentially with increasing concentration of ethanol followed by Epon resin infiltration, and the sections were post stained with uranyl acetate and lead citrate. EM imaging was performed at the University of Toronto Imaging Laboratory.
Statistical Analysis
Student's t test and Mann-Whitney nonparametric tests were used to compare the group means and medians, respectively. A two-tailed p value of <0.05 was considered statistically significant.
RESULTS
Diet-induced Obesity Is Attenuated in LCAT-deficient Mice in a Gender-specific Manner
Female Ldlr−/−×Lcat−/− mice fed a standard chow diet had a modest but significantly lower body weight compared with their age-matched Ldlr−/−×Lcat+/+ mice from as early as 5 weeks of age. The difference persisted through adult life, but the rate of weight gain was similar (Fig. 1a). Similarly, a small weight difference was also observed in their male counterparts but was no longer present by 10 weeks of age. On the other hand, when these mice were fed the HFHS diet, the Ldlr−/−×Lcat−/− mice showed a marked attenuation to weight gain when compared with their age-matched Ldlr−/−×Lcat+/+ controls. The differences at each age point examined were statistically significant (p < 0.05) for all of the ages tested in the females and were statistically significant in males from 13 to 23 weeks of age; thus the attenuation in diet-induced weight gain was more prominent in females (Fig. 1b). The attenuation in diet-induced weight gain was more prominent in females than in males. After 10 weeks of HFHS diet, the female Ldlr−/−×Lcat−/− mice gained 40 ± 11% of body weight compared with a 71 ± 21% gain by the male counterpart (p = 0.001). After 20 weeks of HFHS diet feeding, the weight gain in females was still lower than in males but did not reach statistical significance. To test the impact of the background absence of LDL receptor on these metabolic phenotypes, weight gain was also examined in Lcat knock-out mice (Lcat−/−) when compared with their age- and gender-matched WT controls. When fed a chow diet, Lcat−/− mouse weights did not differ from the WT controls for both male and female (data not shown). However, when fed the HFHS diet, weight gain in the female Lcat−/− mice was markedly attenuated, and the difference in weight became statistically significant after 10 weeks on the HFHS diet. In the male Lcat−/− mice, the weight gain remained similar to that in the WT controls (Fig. 1c). To test whether the attenuation of weight gain was related to reduced food intake, we measured mean food intake in both chow- and HFHS-fed LCAT-deficient mice and their respective controls. As shown in Fig. 1d, Ldlr−/−×Lcat−/− mice showed similar mean daily food intake when compared with their Ldlr−/−×Lcat+/+ controls, in both males and females. Likewise, food consumption was also similar between Lcat−/− and their WT control mice (data not shown).
FIGURE 1.

a and b, growth curves of Ldlr−/−×Lcat−/− versus Ldlr−/−×Lcat+/+ controls on chow diet (a) or HFHS diet (b) from age of 9 weeks (n = 6 for female Ldlr−/−×Lcat−/−; n ≥ 10 for other groups). c, growth curves of Lcat−/− versus WT controls on HFHS diet (n = 9 each for females and n = 6 for males). Differences in mean weight and p value were calculated for each age point. d, mean food consumption (gram/day over 4 days) in Ldlr−/−×Lcat−/− on HFHS diet (left panel) and on chow diet (right panel) (n = 5 for each genotype).
LCAT-deficient Mice Developed Attenuated HFHS Diet-induced Insulin Resistance
We previously reported that Ldlr−/−×Lcat−/− mice are more insulin-sensitive when compared with the Ldlr−/−×Lcat+/+ control on a regular chow diet on the basis of reduced fasting glucose, fasting insulin, and improved insulin tolerance tests (2, 5). Here we examined the effect of HFHS diet on the potential impairment of glucose tolerance. As found on the regular chow diet, the HFHS diet-fed female Ldlr−/−×Lcat−/− mice maintained a better glucose tolerance in comparison with Ldlr−/−×Lcat+/+ females (Fig. 2a). To test whether these protective effects were attributable to LCAT deficiency, we further examined the intraperitoneal glucose tolerance test and intraperitoneal ITT in chow-fed and HFHS diet-fed female Lcat−/− mice versus their respective age- and gender-matched WT controls. When fed a chow diet, Lcat−/− mice did not reveal insulin hypersensitivity on the basis of an intraperitoneal ITT when compared with the WT littermate controls (data not shown). However, when fed the same HFHS diet, the female Lcat−/− mice showed attenuation to diet-induced insulin resistance on the basis of a greater response during the ITT. After a 6-h fast, the Lcat−/− mice also showed significantly lower fasting glucose levels. After insulin injection, glucose levels were lower at all time points and reached statistical significance at 120 min (Fig. 2b). We also observed a trend in improved glucose tolerance in the Lcat−/− mice (Fig. 2c). Taken together, these data suggest that LCAT deficiency confers insulin sensitivity in the presence of metabolic stress, as seen in Lcat−/− mice fed a HFHS diet. Our data also suggest that LDL receptor deficiency per se may also have conferred sufficient metabolic stress to unmask the protective effect of LCAT deficiency even under the chow-fed conditions.
FIGURE 2.
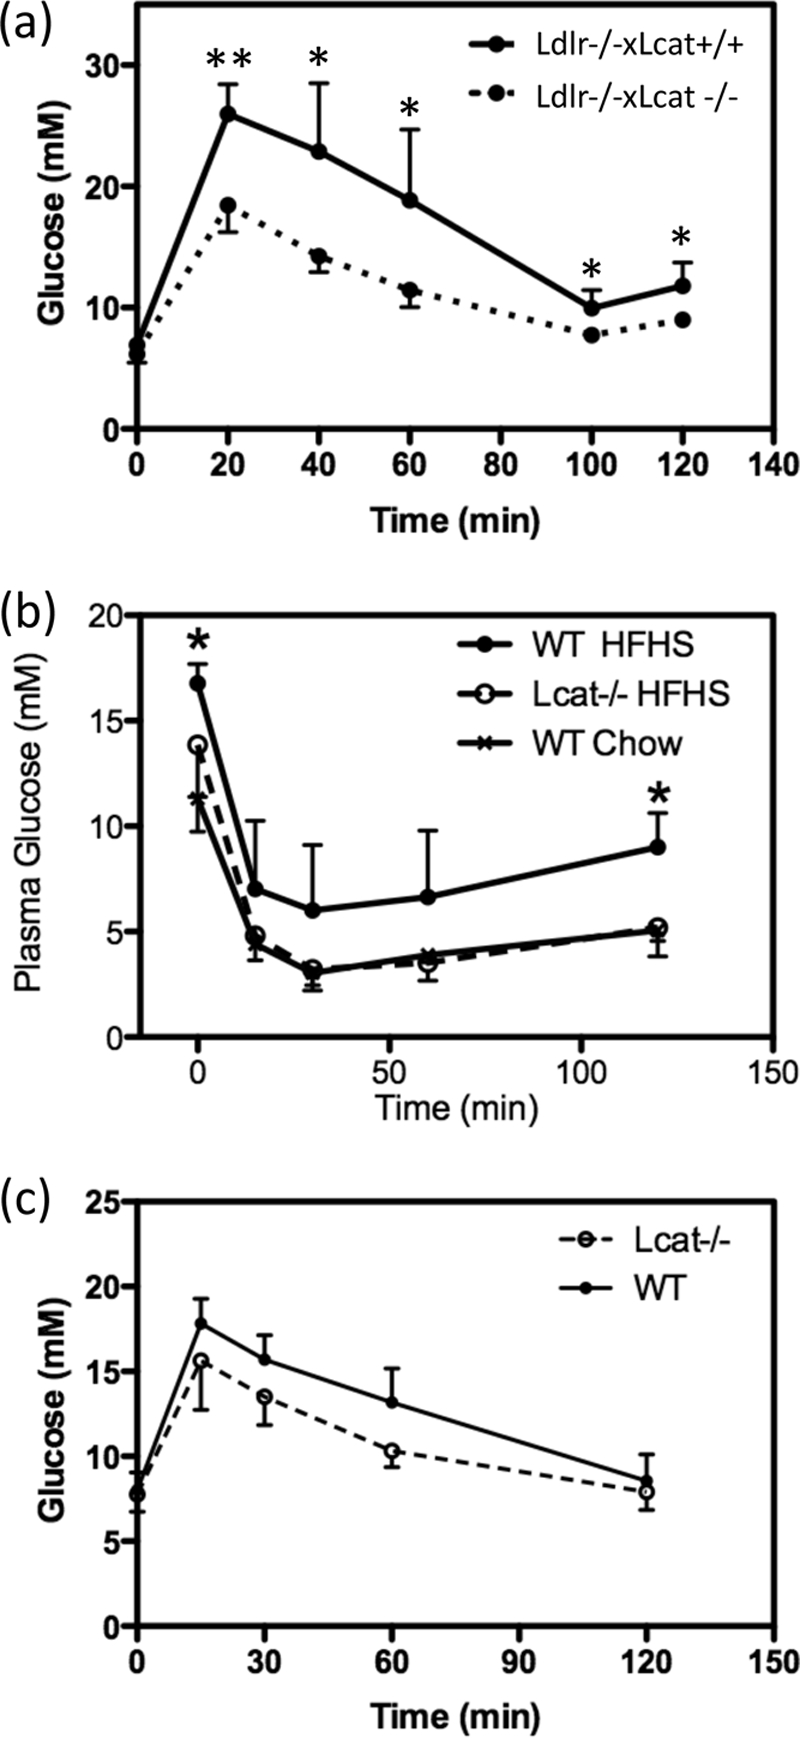
a, intraperitoneal glucose tolerance test on female Ldlr−/−× Lcat−/− (n = 5) versus age-matched Ldlr−/−×Lcat+/+ controls (n = 6) after an overnight fast. *, p < 0.05; **, p < 0.001. b, intraperitoneal insulin tolerance test on female HFHS-fed Lcat−/− (n = 5) versus age-matched WT (n = 5). c, intraperitoneal glucose tolerance test on female HFHS-fed Lcat−/− (n = 5) versus age-matched WT (n = 5).
HFHS Diet Feeding Causes Accumulation of Free Cholesterol and Phospholipids in VLDL-sized Lipid Fractions in Ldlr−/−×Lcat−/− Mice
As shown in Fig. 3, the FPLC profile of the HFHS diet-treated Ldlr−/−×Lcat−/− mice showed marked accumulation of free cholesterol and phospholipids in the large-sized fractions. Meanwhile, the hypertriglyceridemia seen in the chow-fed Ldlr−/−×Lcat−/− mice is no longer present in response to the HFHS diet.
FIGURE 3.

Lipoprotein profile in pooled (n = 5 animals each) plasma of Ldlr−/−×Lcat−/−versusLdlr−/−×Lcat+/+ mice after the high fat high sucrose diet for 16 weeks.
Hepatic ER Stress UPR Markers Are Up-regulated in Chow-fed Ldlr−/−×Lcat+/+ Mice but Are Normalized in Ldlr−/−×Lcat−/− Mice
Insulin resistance has been closely associated with and suggested to be caused by ER stress. Thus to further address the mechanism underlying the differential impact of LCAT deficiency on insulin sensitivity and diet-induced weight gain, we examined the role of hepatic ER stress by measuring UPR markers in mice with different genotypes with and without the HFHS treatment. First, we compared base-line hepatic ER stress status by examining mRNA expression levels of Grp78 and CHOP in Ldlr−/−×Lcat−/−, Ldlr−/−×Lcat+/+, and wild type mice under chow-fed conditions. We observed a 2.0-fold (p = 0.04) up-regulation of mRNA level of Grp78 in 12-week-old Ldlr−/−×Lcat+/+ mice versus WT. In Ldlr−/−×Lcat−/− mice, the Grp78 mRNA level was reduced by 59.7% when compared with the Ldlr−/−×Lcat+/+ mice (p = 0.004) and was 0.8-fold versus WT (p = not significant) (Fig. 4a). Similarly hepatic CHOP mRNA was increased 2.0-fold in Ldlr−/−×Lcat+/+ mice versus the WT (p = 0.04). In Ldlr−/−× Lcat−/− mice, there was a 71.5% reduction versus the Ldlr−/−×Lcat+/+ (p = 0.004), which was lower but not significantly different from WT (0.59-fold) (Fig. 4b). To test whether diet-induced ER stress may be linked to the observed resistance to diet-induced obesity and insulin resistance, we measured hepatic UPR markers in response to a 36-week treatment of the HFHS diet, beginning at 9 weeks of age. Compared with their chow-fed age-matched controls, Ldlr−/−×Lcat+/+ mice developed a 2.1-fold (p = 0.005) increase in Grp78 and a 2.32-fold (p = 0.03) increase in CHOP mRNA levels, respectively, whereas the Ldlr−/−×Lcat−/− showed a nonsignificant 1.37-fold increase (p = 0.32) in Grp78 and a 1.51-fold increase (p = 0.06) in CHOP (Fig. 4, c and d). Consistent with these findings, we also observed a reduction in hepatic phospho-PERK (49% p = 0.001) and phospho-eIF2α (83% p = 0.02) mass in the Ldlr−/−×Lcat−/− mice by Western blot (data not shown). Activation of UPR has been shown to be linked to an increase in phosphorylated c-Jun, which is in turn associated with inhibition of the insulin signaling cascade. We observed an increase in phospho-c-Jun in Ldlr−/−×Lcat+/+ on HFHS diet when compared with the wild type control but a markedly blunted response in the Ldlr−/−×Lcat−/− mice on the diet, in agreement with UPR marker changes (Fig. 4e).
FIGURE 4.

a and b, hepatic mRNA expression of UPR markers by quantitative PCR on Grp78 (a) and CHOP (b) in age-matched female Ldlr−/−×Lcat−/− (DKO) mice versus Ldlr−/−×Lcat+/+ (SKO) versus wild type (WT) C57Bl/6 (n = 5 for each group). c and d, fold changes in hepatic mRNA expressions of UPR markers Grp78 (c) and CHOP (d) in HFHS-fed female mice versus age-matched chow-fed mice, comparing Ldlr−/−×Lcat−/− (n = 9 for HFHS, n = 5 for chow) versus Ldlr−/−×Lcat+/+ (n = 7 for HFHS and n = 5 for chow) groups. e, Western blot analysis of hepatic phospho-c-Jun level normalized to β-actin (n = 5 for WT and Ldlr−/−×Lcat−/− (DKO), n = 4 for Ldlr−/−×Lcat+/+ (SKO). Student's t tests were performed between genotype pairs. NS, not significant.
LCAT-deficient Mice Have Altered Adipose Tissue Mass, Reduced Adipocyte Size, and ER Stress
Rodents fed high fat diets have been shown to develop enlarged and dysfunctional adipocytes, the latter of which include insulin resistance, increased lipolysis, and enhanced secretion of pro-inflammatory cytokines. In chow-fed Ldlr−/−×Lcat−/− mice, when compared with the age-matched Ldlr−/−×Lcat+/+ control, we observed a slight downward shift in cell size distribution, although the difference in mean adipocyte size was not statistically significant (Fig. 5a). However, when fed a HFHS diet, there was a marked shift in cell size distribution (Fig. 5b) and reduction in mean cell size (Fig. 5a), as well as attenuation in the increase in fat pad weight (Fig. 5c). In female Lcat−/− mice, we observed no difference in fat pad weight and cell size distribution when compared with their WT control. However, after a 20-week HFHS diet, the Lcat−/− mice developed a 26% lower fat pad weight (p = 0.06) (Fig. 5d).
FIGURE 5.

a, mean adipocyte size (cross-sectional areas) in chow-fed and HFHS-fed Ldlr−/−×Lcat−/− (DKO) female mice versus Ldlr−/−×Lcat+/+ (SKO) controls (n = 9 sections for three animals for each genotype). *, p < 0.05. b, cell size distribution in HFHS-fed female Ldlr−/−×Lcat−/− mice versus age- and gender-matched Ldlr−/−×Lcat+/+ controls. c, fat pad weights normalized to total body weights in 24-week HFHS diet-fed female Ldlr−/−×Lcat−/− versus Ldlr−/−×Lcat+/+ controls. d, perigonadal fat pad weight in HFHS diet-fed female Lcat−/− versus age- and gender-matched WT controls.
We also compared mRNA expressions of UPR markers Grp78 and CHOP in perigonadal fat pads of chow-fed female Ldlr−/−×Lcat−/− (n = 5) versus Ldlr−/−×Lcat+/+ (n = 4) controls. We observed a 39% reduction in Grp78 mRNA (p = 0.04) and a 31% reduction in CHOP mRNA (p = 0.015).
Activation of Canonical Wnt Signaling and Suppression of Adipogenic Genes in Adipose Tissue
Activation of the canonical Wnt signaling pathway is known to inhibit adipogenesis through activation and nuclear translocation of β-catenin, resulting in the suppression of two critical adipogenic genes, namely PPARγ and C/EBPα. In light of the observed reduction of adipose tissue ER stress in the chow-fed Ldlr−/−×Lcat−/− mice, we hypothesize that adipogenesis is also reduced in conjunction with activation of the canonical Wnt signaling pathway. To test this hypothesis, we first observed, in the perigonadal tissue, a 46.5% reduction in Cebpα mRNA (p < 0.001) and a 35.1% reduction in Pparγ mRNA expression (p = 0.07) (Fig. 6a). To determine whether the canonical Wnt signaling pathway is activated and could account for this suppression, we examined the mRNA levels of other known targets of Wnt signaling. We observed up-regulation of mRNA expression of three β-catenin target genes, Axin2 (1.78-fold, p = 0.04), c-myc (2.37-fold, p = 0.03), and CyclinD1 (1.47-fold, p = 0.06) (Fig. 6b). After treatment of the two strains of mice with the HFHS diet, white adipose tissue expression of the Wnt ligand, Wnt10b, and the β-catenin target gene Axin2 remained up-regulated in the Ldlr−/−×Lcat−/− mice (Fig. 6c).
FIGURE 6.

a, white adipose tissue mRNA levels of Cebpα (left panel) and Pparγ (right panel) in chow-fed female Ldlr−/−×Lcat−/− mice versus their age- and gender-matched Ldlr−/−×Lcat+/+ controls by quantitative PCR. b, white adipose tissue mRNA levels of β-catenin target genes Axin2, c-myc, and CyclinD1 in the same chow-fed mice as in a. c, white adipose tissue mRNA levels of Axin2 and Wnt10b in HFHS diet-treated female Ldlr−/−×Lcat−/− mice versus their age- and gender-matched Ldlr−/−×Lcat+/+ controls.
Activation of Skeletal Muscle Mitochondrial Function and Uncoupling Proteins in Ldlr−/−×Lcat−/− Mice
To further characterize the role of skeletal muscle in the altered energy metabolism seen in the LCAT-deficient mice, we examined the AMPK/PGC1α/UCP3 axis and the regulation of oxidative phosphorylation genes. In the skeletal muscles of overnight fasted mice, Ldlr−/−×Lcat−/− mouse skeletal muscle showed a 1.9-fold up-regulation of phosphorylation of AMPK (Thr(P)-172-AMPK) (p = 0.04), a marker of AMPK activity (Fig. 7a). We also observed a 1.5-fold up-regulation of Ucp3 mRNA (p = 0.01), a 3.1-fold up-regulation of Pgc1α mRNA (p = 0.03), and a 1.9-fold up-regulation of Ndufs1 mRNA (p < 0.001), one of the mitochondrial Complex 1 oxidative phosphorylation genes known to be downstream of PGC1α (Fig. 7b). There was also a 1.5-fold up-regulation of PGC1α protein content (p = 0.004). Collectively, these changes are remarkably similar to those seen in animals subjected to chronic exercise and are associated with enhanced fatty acid oxidation. In the chow-fed Ldlr−/−×Lcat−/− mice, we detected an increase in core body temperature when compared with their age- and gender-matched Ldlr−/−×Lcat+/+ controls (Fig. 8a).
FIGURE 7.

a, skeletal muscle levels of Thr(P)-172-AMPKα and total AMPKα protein mass by Western blot in chow-fed female Ldlr−/−×Lcat−/− (n = 5) versus age- and gender-matched Ldlr−/−×Lcat+/+ controls (n = 4) after an overnight fast. b, skeletal muscle mRNA levels of UCP3, PGC1α, and Ndusf1 in chow-fed female Ldlr−/−×Lcat−/− (white bars, n = 5) versus age- and gender-matched Ldlr−/−×Lcat+/+ (black bars, n = 5) controls.
FIGURE 8.
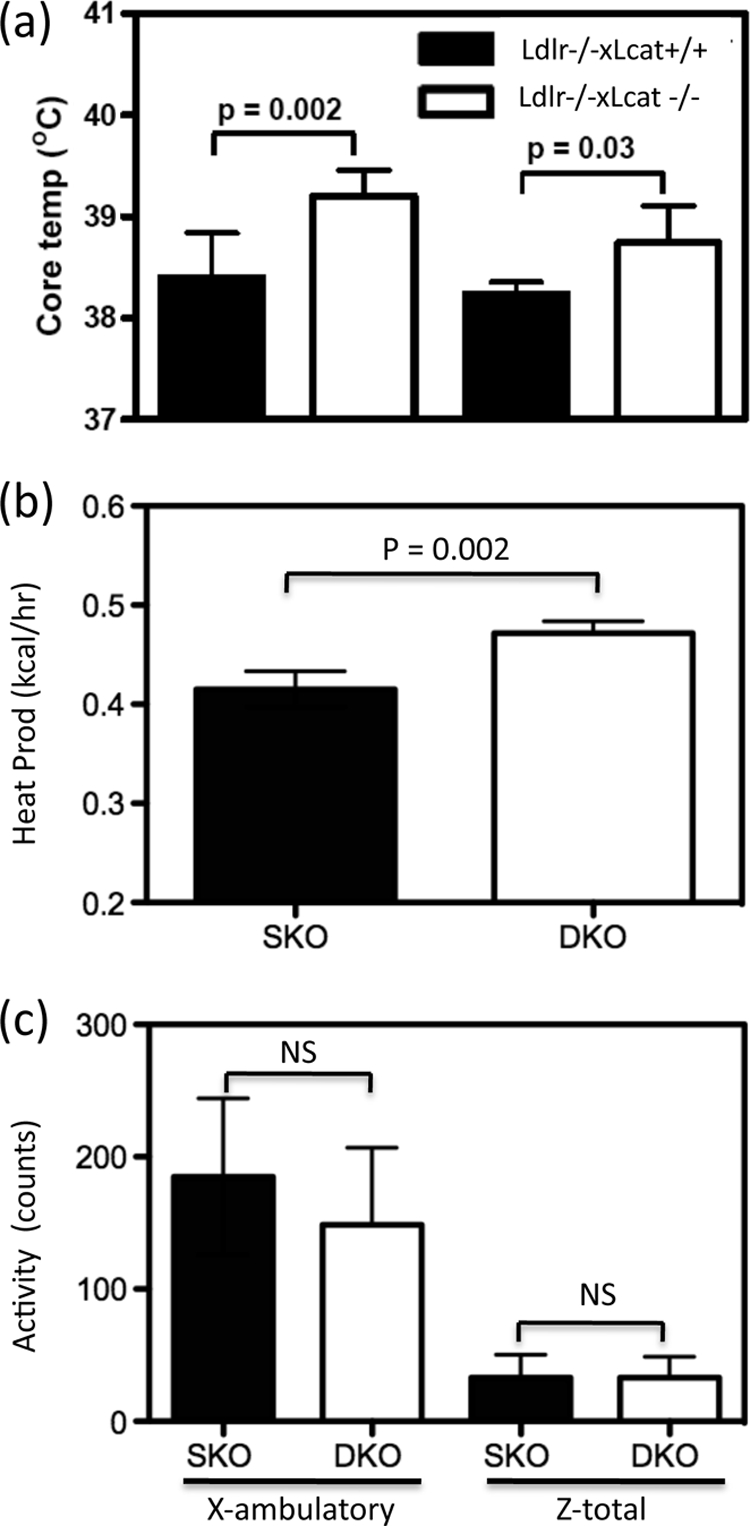
a, core temperature of Ldlr−/−×Lcat−/− mice (male and female) versus their Ldlr−/−×Lcat+/+ controls. Shown are indirect calorimetry data of female Ldlr−/−×Lcat−/− (n = 4) versus age-matched female Ldlr−/−×Lcat+/+ (n = 4) on chow diet. b, heat production (kcal/h). c, activity (X-ambulatory and Z-total counts).
Increased Energy Expenditure in Female Ldlr−/−×Lcat−/− Mice without Increased Physical Activity
To test the hypothesis that protection from diet-induced obesity is, at least in part, attributable to increased energy expenditure by using indirect calorimetry, we showed that the female Ldlr−/−×Lcat−/− mice developed a significant 14% increased in mean heat production (Fig. 8a) in the absence of any increase in physical activities (Fig. 8b). These findings are consistent with the observation of increased core temperature (Fig. 8c).
Brown Fat Cells Are Present Ectopically in Skeletal Muscle of the Ldlr−/−×Lcat−/− Mice with High Level of UCP1 Expression
In light of the significant increase in core temperature and energy expenditure observed in the Ldlr−/−×Lcat−/− mice, we hypothesized that excess UCP1 expression was the underlying cause. We first tested whether the Ldlr−/−×Lcat−/− mice developed increased iBAT mass. We compared carefully dissected iBAT pad weights from age-matched female Ldlr−/−×Lcat−/− (0.082 ± 0.025 gm, n = 9) with Ldlr−/−×Lcat+/+ (0.098 ± 0.020 gm; n = 9), and the difference was insignificant (p = 0.1). Likewise, the UCP1 protein masses in the iBAT were also similar between the two groups (Fig. 9). To test that excess energy expenditure and heat generation was not due to increased expression of UCP1 in WAT, we measured protein mass of UCP1 in both ingWAT and sWAT depots and did not see a difference in their abundance (Fig. 9). We then tested the hypothesis that UCP1 is expressed ectopically in the skeletal muscle in Ldlr−/−×Lcat−/− mice. As seen in Fig. 10a, we observed a marked up-regulation of Ucp1 mRNA in skeletal muscle of female Ldlr−/−×Lcat−/− against its age- and gender-matched Ldlr−/−×Lcat+/+ control. Likewise, we also observed a modest up-regulation of Ucp1 mRNA in Lcat−/− mice versus their wild type control (Fig. 10b). We also confirmed the marked expression of UCP1 in skeletal muscle of the female Ldlr−/−×Lcat−/− mice by Western blotting (Fig. 10c). Furthermore, by comparing the expression levels of UCP1 in skeletal muscle and in iBAT, we estimated that the whole body UCP1 abundance in skeletal muscle may be in the order of 20–30%, based on the assumption that the ectopic expression of UCP1 is evenly distributed in skeletal muscle.
FIGURE 9.

Western blotting of UCP1 in iBAT, sWAT, and ingWAT comparing chow-fed female Ldlr−/−×Lcat (DKO) with female Ldlr−/−×Lcat+/+ (SKO) mice. iBAT samples were loaded at 2 μg/lane and sWAT and ingWAT at 20 μg/lane. p > 0.05 for comparing mean of SKO versus DKO in all of the depots tested.
FIGURE 10.

a, skeletal muscle mRNA level of Ucp1 in chow-fed female Ldlr−/−×Lcat−/− mice versus their age- and gender-matched Ldlr−/−×Lcat+/+ controls. b, skeletal muscle mRNA level of Ucp1 in chow-fed female Lcat−/− mice versus their age- and gender-matched WT controls (n = 5 in each group). c, skeletal muscle Western blotting of UCP1 comparing female Ldlr−/−×Lcat−/− with age- and gender-matched Ldlr−/−×Lcat+/+ and wild type. d, Western blotting of UCP1 comparing skeletal muscle with iBAT. Skeletal muscle protein was loaded at 100 μg for each lane, and iBAT protein was loaded at 1 μg/lane. The membranes were stripped and reprobed with β-tubulin for skeletal (Sk) muscle samples and β-actin for iBAT.
To further identify the origin of the ectopic UCP1 proteins, we performed immunohistochemical staining and observed positive UCP1 staining localized to islands of cells with brown fat-like morphology, namely cells with multiple small fat droplets and prominent central nuclei. These islands were found exclusively between muscle bundles. Electron microscopy of the female Ldlr−/−×Lcat−/− quadriceps muscle showed multilocular, mitochondrion-rich brown fat cells, verifying the immunohistochemical findings (Fig. 11). To further support the presence of a development signal for the generation of brown fat cells in the skeletal muscle, we observed marked abundance of PRDM16 protein mass in skeletal muscle of the female Ldlr−/−×Lcat−/− mice (Fig. 12).
FIGURE 11.

a–c, immunohistochemical staining of skeletal muscle with UCP1. a, skeletal muscle section from Ldlr−/−×Lcat+/+ mice. b and c, skeletal muscle sections from Ldlr−/−×Lcat−/− mice. d, iBAT from wild type mice showing typical brown adipose tissue morphologic features of small, multilocular lipid droplets. e, transmission electron micrographs of a skeletal muscle section from a female Ldlr−/−×Lcat−/− mouse showing brown adipocytes with small fat droplets (white arrowheads) and abundance of mitochondria (black arrows) (5000×).
FIGURE 12.

Skeletal muscle Western blotting of PRDM16 comparing female Ldlr−/−×Lcat−/− with age- and gender-matched Ldlr−/−×Lcat+/+ and wild type.
DISCUSSION
In this paper, we observed for the first time that LCAT-deficient mice develop a gender-specific protection from HFHS diet-induced obesity and insulin resistance in the absence of hypophagia. This protective metabolic phenotype is more accentuated in the LDL receptor knock-out background and involved multiple metabolic pathways. This is also a first report of ectopic brown adipose tissue expressing high abundance of UCP1 in the skeletal muscle of LCAT-deficient mice.
Recent studies by Ozcan et al. (6) revealed that ER stress plays a crucial role in the development of both diet-induced and genetic hypertrophic obesity and its associated metabolic complications, namely insulin resistance. In this experimental paradigm, excess caloric intake-induced hypertrophic obesity is linked to activation of a number of the UPR pathways as characterized by up-regulation of mRNA levels of the chaperone Grp78 as well as CHOP, and these changes correlated well with enhanced hepatic levels of phospho-PERK and phospho-eIF2α. Furthermore, an up-regulation of phospho-c-Jun was linked to impairment of the insulin signaling cascade in the liver (6), providing further evidence that ER stress may play an important role in the development of insulin resistance in both diet-induced and genetic models of obesity. In these models, activation of UPR is also detected in white adipose tissues. Intriguingly, treatment with phenylbutyrate, a chemical chaperone, in ob/ob mice led to a rapid and dramatic resolution of insulin resistance in conjunction with normalization of the UPR markers (7), changes in disproportion to the weight change. On a chow diet, we observed a 2-fold up-regulation of hepatic mRNA levels of Grp78 and CHOP in the Ldlr−/−×Lcat+/+ mice when compared with age- and gender-matched C57Bl/6 WT mice, suggestive of an endogenous basal elevation of the UPR. Although the mechanism for the increased UPR marker expressions in Ldlr−/−×Lcat+/+ mice is not known, these findings are consistent with, and may indeed explain, the previous observation that LDL receptor knock-out mice (C57Bl/6 background) developed more severe diet-induced metabolic phenotypes, including adiposity and insulin resistance, than their C57Bl/6 wild type controls (29). Conceivably, the increased ER stress in the Ldlr−/−×Lcat+/+ mice may have provided a basal chronic metabolic stress, over which the protective effect of LCAT was unmasked. Our observation of the normalization of Grp78 and CHOP mRNA levels in the Ldlr−/−×Lcat−/− mice and the associated reduction in hepatic phospho-c-Jun level are therefore consistent with the previously reported enhanced insulin sensitivity seen in these mice (5). In chow-fed Ldlr−/−×Lcat−/− mice, the adipose tissue UPR markers were also reduced when compared with the Ldlr−/−×Lcat+/+ controls, in agreement with the changes seen in the liver.
The reduction in the expression of UPR markers and their metabolic impact seen in the Ldlr−/−×Lcat−/− mice persisted even when the mice were challenged with a long term HFHS diet, as shown in Fig. 4. As expected, the UPR markers were markedly increased in the Ldlr−/−×Lcat+/+ control mice on the HFHS diet when compared with the chow-fed controls. On the other hand, the fold increase in UPR markers in response to the same diet was significantly lower in the age- and gender-matched Ldlr−/−×Lcat−/− mice. Furthermore, Grp78 and CHOP mRNA levels in the HFHS diet-treated Ldlr−/−×Lcat−/− mice were significantly lower than the Ldlr−/−×Lcat+/+ controls at 54 weeks. These findings of reduction in the UPR were further substantiated by significant reductions in hepatic phospho-PERK and phospho-eIF2α levels by Western blot.
In addition to the important role of the adipose tissue UPR in insulin sensitivity, the biological significance of a reduction in UPR in the adipose tissue may include alteration of adipogenicity. A recent study by Basseri et al. (12) suggests that resolution of UPR in adipose tissue in response to phenylbutyrate treatment causes inhibition of adipogenesis. Our findings of concomitant reductions in the adipose tissue adipogenesis genes, Pparγ and C/ebpα, in association with a reduction in UPR markers in the Ldlr−/−×Lcat−/− mice are consistent with this notion. Furthermore, we also observed concomitant up-regulation of Axin2, c-myc, and CyclinD1, three of the well established target genes of β-catenin, suggestive of activation of canonical Wnt signaling. Because Wnt signaling has long been recognized to inhibit adipogenesis, our observed up-regulation of adipose tissue β-catenin activation may serve as a causal link to the down-regulation of adipogenic genes. After prolonged HFHS diet treatment, we observed persistence of up-regulation of Axin2 in the adipose tissue, suggestive of persistent activation of Wnt signaling under the dietary stress. Previous studies revealed that constitutive, adipose tissue-specific overexpression of Wnt10b, a Wnt ligand highly expressed in the stromovascular fraction, including preadipocytes, resulted in resistance to diet-induced obesity and insulin resistance (30, 31). In this transgenic model, the authors reported significant reduction in adult adipose tissue expression of both Cebpα and Pparγ genes. In HFHS diet-fed Ldlr−/−×Lcat−/− mouse adipose tissue, Wnt10b expression was significantly elevated (Fig. 7c), consistent with a role of activated Wnt signaling in LCAT-deficient mouse adipose tissue. The question of whether the decrease in the UPR in the Ldlr−/−×Lcat−/− mouse adipose tissue contributed to the activation of Wnt signaling requires further investigation.
In light of the observations of increased core temperature and energy expenditure in the Ldlr−/−×Lcat−/− mice, we hypothesized excess UCP1 expression as a potential cause. We systematically excluded the scenario of excess UCP1 expressed in brown (iBAT) and specific inducible white adipose depots (sWAT and ingWAT). We have identified marked excess of UCP1 expression at both the protein and mRNA levels in skeletal muscle of Ldlr−/−×Lcat−/− mice. We also observed a more modest degree of up-regulation of Ucp1 in the female Lcat−/− mice, thus suggesting that the ectopic expression is attributable to LCAT deficiency per se, and the absence of LDL receptor strongly augments this ectopic expression. Because PRDM16 has been shown to function as a key molecular switch to induce brown fat development from Myf5 positive myoblastic progenitor cells (22), the observation of increased skeletal muscle PRDM16 protein abundance supports the notion that the ectopic brown adipose tissue develops, through activation of PRDM16, from the myoblastic lineage. However, lineage tracing study is required to provide definitive proof.
By comparing the UCP1 protein abundance in the quadriceps muscle and that in the iBAT, assuming that these islands of brown fat are distributed evenly throughout the musculature, we estimated that the whole body UCP1 present in the Ldlr−/−×Lcat−/− mouse skeletal muscle was in the order of 20–30%. Because transgenic models overexpressing the Ucp1 gene in skeletal muscle and adipose tissue have all been shown to confer metabolically favorable phenotypes, including improved insulin sensitivity, reduced white fat mass and liver mass, improved skeletal muscle AMPK activities, ameliorated oxidative stress, and glucose substrate utilization (32, 33). Furthermore, it has been suggested that ectopic expression of UCP1 at as little as 10% that of the iBAT is sufficient to confer metabolic benefits (32). We therefore expect that UCP1 expression in the ectopic brown fat in the LCAT-deficient mice will also be functionally active. In addition to the ectopic expression of brown fat and UCP1, the Ldlr−/−×Lcat−/− mice also showed increased expression in the skeletal muscle of a panel of genes that includes UCP3, PGC1α, and NDUFS1 in association with elevated level of Thr(P)-172-AMPK, the active form of AMPK.
UCP3, a member of the mitochondrial anion carrier protein family that is highly expressed and selectively in skeletal muscle, has been implicated in facilitating fatty acid transport and oxidation as characterized by (a) increased fatty acid translocase (FAT/CD36) expression and (b) up-regulation of activities of carnitine palmitoyltransferase I, 3-hydroxyacyl-CoA dehydrogenase, citrate synthase, and increased expression of mitochondrial thioesterase 1 (18, 19). PGC1α has been shown to play critical roles in (a) stimulating thermogenesis; (b) activating genes in oxidative phosphorylation (13); (c) stimulating mitochondrial biogenesis through coactivation of nuclear respiratory factor-1; and (d) activating GLUT4 expression through coactivating MEF2C (13). In humans, elevated expression of skeletal muscle PGC1α has been seen in response to (a) acute endurance exercise and (b) chronically trained muscle (34). Pathophysiologically, skeletal muscle PGC1α mRNA expression is down-regulated along with a panel of genes in mitochondrial oxidative phosphorylation in humans with insulin resistance or diabetes (14) as well as in rodent models of obesity, insulin resistance, and/or diabetes (15, 16). In skeletal muscle, activated AMPK acts directly to phosphorylate and activate PGC1α on Thr-177 and Ser-538 (35). Taken together, these metabolic changes in the skeletal muscle of Ldlr−/−×Lcat−/− mice suggest enhanced β-oxidation (UCP3) and mitochondria oxidative phosphorylation, the latter as evidenced by the observed up-regulation of Ndusf1.
The mechanistic link between enzymatic action of LCAT and the metabolic phenotypes reported here is not known. LCAT deficiency is associated with a complex dyslipidemic phenotype. The changes in the FPLC profile of the Ldlr−/−× Lcat−/− mice fed a HFHS diet are unique. Most notable is the dissolution of VLDL in the chow-fed mice but the appearance of the large-sized, free cholesterol, and phospholipid-enriched lipid fractions, resembling LpX (36). However, further studies are required to elucidate the potential significance of these circulating lipid changes in the observed protection from diet-induced obesity.
In summary, in this study, we have extended the analysis of the metabolic phenotypes of LCAT-deficient mice. We found enhanced insulin sensitivity and resistance to diet-induced obesity manifested in a gender-specific manner. These protective phenotypes have been linked to protection against diet-induced hepatic and adipocytes ER stress. We are also the first to report ectopic expression of UCP1, residing in brown adipose tissues embedded in the interfiber regions of the skeletal muscle in the Ldlr−/−×Lcat−/− mice. These findings are likely the explanation for the observed increase in energy expenditure and higher core temperature. Further work is require to elucidate the cellular origin of the ectopic brown fat and the mechanism by which LCAT deficiency evokes the ectopic expressions.
Acknowledgments
We acknowledge the excellent technical support of Feilu Ye and Jenny Jin.
This work was supported in part by Grant-in-aid NA 6331 from the Heart and Stroke Foundation of Ontario; Canadian Institutes of Health Research Operating Grants MOP 77527 (to D. S. N.), MOP-191501 (to M. W.), and MOP 97979 (to I. G. F.); a Banting and Best Diabetes Center summer studentship (to L. T.); and Department of Laboratory Medicine and Pathobiology at the University of Toronto summer studentships (to S. S.).
- LCAT
- lecithin cholesterol acyltransferase
- HFHS
- high fat high sucrose
- DKO
- double knock-out
- SKO
- single knock-out
- ER
- endoplasmic reticulum
- UPR
- unfolded protein response
- PPAR
- peroxisome proliferator-activated receptor
- C/EBP
- CCAAT enhancer-binding protein
- iBAT
- interscapular brown adipose tissue
- sWAT
- subcutaneous white adipose tissue
- ingWAT
- inguinal WAT
- ITT
- insulin tolerance test
- UCP
- uncoupling protein
- PRDM16
- PR domain containing 16
- HDL
- high density lipoprotein.
REFERENCES
- 1. Rousset X., Vaisman B., Amar M., Sethi A. A., Remaley A. T. (2009) Curr Opin. Endocrinol. Diabetes Obes. 16, 163–171 [DOI] [PMC free article] [PubMed] [Google Scholar]
- 2. Ng D. S., Xie C., Maguire G. F., Zhu X., Ugwu F., Lam E., Connelly P. W. (2004) J. Biol. Chem. 279, 7636–7642 [DOI] [PubMed] [Google Scholar]
- 3. Calabresi L., Baldassarre D., Castelnuovo S., Conca P., Bocchi L., Candini C., Frigerio B., Amato M., Sirtori C. R., Alessandrini P., Arca M., Boscutti G., Cattin L., Gesualdo L., Sampietro T., Vaudo G., Veglia F., Calandra S., Franceschini G. (2009) Circulation 120, 628–635 [DOI] [PubMed] [Google Scholar]
- 4. Sethi A. A., Sampson M., Warnick R., Muniz N., Vaisman B., Nordestgaard B. G., Tybjaerg-Hansen A., Remaley A. T. (2010) Clin. Chem. 56, 1128–1137 [DOI] [PMC free article] [PubMed] [Google Scholar]
- 5. Li L., Naples M., Song H., Yuan R., Ye F., Shafi S., Adeli K., Ng D. S. (2007) Am. J. Physiol. Endocrinol. Metab. 293, E587–E594 [DOI] [PubMed] [Google Scholar]
- 6. Ozcan U., Cao Q., Yilmaz E., Lee A. H., Iwakoshi N. N., Ozdelen E., Tuncman G., Görgün C., Glimcher L. H., Hotamisligil G. S. (2004) Science 306, 457–461 [DOI] [PubMed] [Google Scholar]
- 7. Ozcan U., Yilmaz E., Ozcan L., Furuhashi M., Vaillancourt E., Smith R. O., Görgün C. Z., Hotamisligil G. S. (2006) Science 313, 1137–1140 [DOI] [PMC free article] [PubMed] [Google Scholar]
- 8. Boden G., Duan X., Homko C., Molina E. J., Song W., Perez O., Cheung P., Merali S. (2008) Diabetes 57, 2438–2444 [DOI] [PMC free article] [PubMed] [Google Scholar]
- 9. Sharma N. K., Das S. K., Mondal A. K., Hackney O. G., Chu W. S., Kern P. A., Rasouli N., Spencer H. J., Yao-Borengasser A., Elbein S. C. (2008) J. Clin. Endocrinol. Metab. 93, 4532–4541 [DOI] [PMC free article] [PubMed] [Google Scholar]
- 10. Gregor M. F., Yang L., Fabbrini E., Mohammed B. S., Eagon J. C., Hotamisligil G. S., Klein S. (2009) Diabetes 58, 693–700 [DOI] [PMC free article] [PubMed] [Google Scholar]
- 11. Guo W., Wong S., Xie W., Lei T., Luo Z. (2007) Am. J. Physiol. Endocrinol. Metab. 293, E576–E586 [DOI] [PubMed] [Google Scholar]
- 12. Basseri S., Lhoták S., Sharma A. M., Austin R. C. (2009) J. Lipid Res. 50, 2486–2501 [DOI] [PMC free article] [PubMed] [Google Scholar]
- 13. Michael L. F., Wu Z., Cheatham R. B., Puigserver P., Adelmant G., Lehman J. J., Kelly D. P., Spiegelman B. M. (2001) Proc. Natl. Acad. Sci. U.S.A. 98, 3820–3825 [DOI] [PMC free article] [PubMed] [Google Scholar]
- 14. Patti M. E., Butte A. J., Crunkhorn S., Cusi K., Berria R., Kashyap S., Miyazaki Y., Kohane I., Costello M., Saccone R., Landaker E. J., Goldfine A. B., Mun E., DeFronzo R., Finlayson J., Kahn C. R., Mandarino L. J. (2003) Proc. Natl. Acad. Sci. U.S.A. 100, 8466–8471 [DOI] [PMC free article] [PubMed] [Google Scholar]
- 15. Sparks L. M., Xie H., Koza R. A., Mynatt R., Hulver M. W., Bray G. A., Smith S. R. (2005) Diabetes 54, 1926–1933 [DOI] [PubMed] [Google Scholar]
- 16. Rong J. X., Qiu Y., Hansen M. K., Zhu L., Zhang V., Xie M., Okamoto Y., Mattie M. D., Higashiyama H., Asano S., Strum J. C., Ryan T. E. (2007) Diabetes 56, 1751–1760 [DOI] [PubMed] [Google Scholar]
- 17. Benton C. R., Wright D. C., Bonen A. (2008) Appl. Physiol. Nutr. Metab. 33, 843–862 [DOI] [PubMed] [Google Scholar]
- 18. Bezaire V., Spriet L. L., Campbell S., Sabet N., Gerrits M., Bonen A., Harper M. E. (2005) FASEB J. 19, 977–979 [DOI] [PubMed] [Google Scholar]
- 19. Moore G. B., Himms-Hagen J., Harper M. E., Clapham J. C. (2001) Biochem. Biophys. Res. Commun. 283, 785–790 [DOI] [PubMed] [Google Scholar]
- 20. Azzu V., Brand M. D. (2010) Trends Biochem. Sci. 35, 298–307 [DOI] [PMC free article] [PubMed] [Google Scholar]
- 21. Timmons J. A., Wennmalm K., Larsson O., Walden T. B., Lassmann T., Petrovic N., Hamilton D. L., Gimeno R. E., Wahlestedt C., Baar K., Nedergaard J., Cannon B. (2007) Proc. Natl. Acad. Sci. U.S.A. 104, 4401–4406 [DOI] [PMC free article] [PubMed] [Google Scholar]
- 22. Seale P., Bjork B., Yang W., Kajimura S., Chin S., Kuang S., Scimè A., Devarakonda S., Conroe H. M., Erdjument-Bromage H., Tempst P., Rudnicki M. A., Beier D. R., Spiegelman B. M. (2008) Nature 454, 961–967 [DOI] [PMC free article] [PubMed] [Google Scholar]
- 23. Almind K., Manieri M., Sivitz W. I., Cinti S., Kahn C. R. (2007) Proc. Natl. Acad. Sci. U.S.A. 104, 2366–2371 [DOI] [PMC free article] [PubMed] [Google Scholar]
- 24. Cinti S. (2009) Am. J. Physiol. Endocrinol. Metab. 297, E977–E986 [DOI] [PubMed] [Google Scholar]
- 25. Seale P., Conroe H. M., Estall J., Kajimura S., Frontini A., Ishibashi J., Cohen P., Cinti S., Spiegelman B. M. (2011) J. Clin. Invest. 121, 96–105 [DOI] [PMC free article] [PubMed] [Google Scholar]
- 26. Ng D. S., Maguire G. F., Wylie J., Ravandi A., Xuan W., Ahmed Z., Eskandarian M., Kuksis A., Connelly P. W. (2002) J. Biol. Chem. 277, 11715–11720 [DOI] [PubMed] [Google Scholar]
- 27. Ng D. S., Chu T., Esposito B., Hui P., Connelly P. W., Gross P. L. (2008) Cardiovasc. Pathol. 17, 226–232 [DOI] [PubMed] [Google Scholar]
- 28. Song H., Zhu L., Picardo C. M., Maguire G., Leung V., Connelly P. W., Ng D. S. (2006) Am. J. Physiol. Endocrinol. Metab. 290, E17–E25 [DOI] [PubMed] [Google Scholar]
- 29. Schreyer S. A., Vick C., Lystig T. C., Mystkowski P., LeBoeuf R. C. (2002) Am. J. Physiol. Endocrinol. Metab. 282, E207–E214 [DOI] [PubMed] [Google Scholar]
- 30. Prestwich T. C., Macdougald O. A. (2007) Curr. Opin. Cell Biol. 19, 612–617 [DOI] [PMC free article] [PubMed] [Google Scholar]
- 31. Wright W. S., Longo K. A., Dolinsky V. W., Gerin I., Kang S., Bennett C. N., Chiang S. H., Prestwich T. C., Gress C., Burant C. F., Susulic V. S., MacDougald O. A. (2007) Diabetes 56, 295–303 [DOI] [PubMed] [Google Scholar]
- 32. Neschen S., Katterle Y., Richter J., Augustin R., Scherneck S., Mirhashemi F., Schürmann A., Joost H. G., Klaus S. (2008) Physiol. Genomics 33, 333–340 [DOI] [PubMed] [Google Scholar]
- 33. Keipert S., Klaus S., Heldmaier G., Jastroch M. (2010) Biochim. Biophys. Acta 1797, 324–330 [DOI] [PubMed] [Google Scholar]
- 34. Handschin C., Spiegelman B. M. (2008) Nature 454, 463–469 [DOI] [PMC free article] [PubMed] [Google Scholar]
- 35. Jäger S., Handschin C., St-Pierre J., Spiegelman B. M. (2007) Proc. Natl. Acad. Sci. U.S.A. 104, 12017–12022 [DOI] [PMC free article] [PubMed] [Google Scholar]
- 36. Zhu X., Herzenberg A. M., Eskandarian M., Maguire G. F., Scholey J. W., Connelly P. W., Ng D. S. (2004) Am. J. Pathol. 165, 1269–1278 [DOI] [PMC free article] [PubMed] [Google Scholar]