Abstract
A high-fat diet (HFD) is associated with adipose inflammation, which contributes to key components of metabolic syndrome, including obesity and insulin resistance. The increased visceral adipose tissue mass associated with obesity is the result of hyperplasia and hypertrophy of adipocytes. To investigate the effects of exercise on HFD-induced metabolic disorders, male C57BL/6 mice were divided into four groups: SED (sedentary)-ND (normal diet), EX (exercise)-ND, SED-HFD, and EX-HFD. Exercise was performed on a motorized treadmill at 15 m/min, 40 min/day, and 5 day/wk for 8 wk. Exercise resulted in a decrease in abdominal fat contents and inflammation, improvements in glucose tolerance and insulin resistance, and enhancement of vascular constriction and relaxation responses. Exercise with or without HFD increased putative brown adipocyte progenitor cells in brown adipose tissue compared with groups with the same diet, with an increase in brown adipocyte-specific gene expression in brown and white adipose tissue. Exercise training enhanced in vitro differentiation of the preadipocytes from brown adipose depots into brown adipocytes and enhanced the expression of uncoupling protein 1. These findings suggest that exercise ameliorates high-fat diet-induced metabolic disorders and vascular dysfunction, and increases adipose progenitor cell population in brown adipose tissue, which might thereby contribute to enhanced functional brown adipose.
Keywords: adipocyte progenitor cells, inflammation, adiposity, insulin resistance
obesity and insulin resistance (IR) are highly prevalent conditions that result from an imbalance in energy expenditure and intake (25). At the core of abnormalities noted with these disorders is excess deposition of visceral adipose and activation of proinflammatory pathways. Recent studies suggest that brown adipose tissue (BAT) content and function may be an independent predictor of insulin sensitivity and potentially play a role in protecting against obesity in humans (6). The physiological role of BAT is to metabolize fatty acids and generate heat (29). This specialized function of brown adipose cells is thought to result from its high mitochondrial content and the ability to uncouple cellular respiration through the action of uncoupling protein-1 (UCP1). In addition, BAT is characterized by a unique transcriptional program that is typified by a high level of expression of transcription factors, such as peroxisome proliferator-activated receptor-γ coactivator 1-α (PGC-1α) and PRD1-BF1-RIZ1 homologous domain containing 16 (PRDM16) that point to a unique evolutionary pathway that is substantively different from white adipose tissue (WAT). On the other hand, WAT is the primary site of energy storage, while BAT is specialized for use in energy expenditure (29). Because of these functional differences, the balance between WAT and BAT affects systemic energy balance and may contribute to the development of obesity. Elucidating the functional relevance of brown-adipocyte differentiation and transcription factors in traditional BAT and WAT depots in response to physiological and dietary interventions may shed light on metabolic adaptations in these tissues. The perivascular and stromal areas of adipose tissue harbor progenitor cells with mitotic capability and commitment to adipocyte differentiation (27). It has been reported that ∼10% of fat cells are renewed annually at all adult ages and levels of body mass index (28). To support the expansion of adipose tissue mass if needed and to maintain adipose dynamics in adulthood, proliferative adipocyte progenitor cells (APC) must exist and respond to metabolic demands (19).
Exercise has been found to be an effective intervention for prevention of weight gain and maintenance of a stable weight. Additionally, nowadays, the high prevalence of obesity extends to the children and adolescent population in the United States (1, 5, 7). Therefore, the purpose of this study was to investigate the effects of exercise training on high-fat diet (HFD)-induced inflammation, adiposity, IR, metabolic disorders, and vascular dysfunction in C57BL/6 mice. A secondary aim was to evaluate the changes of APC population in BAT in response to exercise and/or HFD-feeding. We hypothesized that interventions such as exercise, which have an impact on energy expenditure, may do so because of important effects on brown adipose morphogenesis, which may, in turn, modulate susceptibility to obesity and IR.
MATERIALS AND METHODS
Animals and diets.
Male C57BL/6 mice (3-wk-old) were purchased from Jackson Laboratories (Bar Harbor, ME). All mice were given 7 days to adjust to their new environment. At the age of 4 wk, the animals were switched to either a high-fat diet (HFD) containing 42% of calories from saturated fat (TD.88137, Harlan, Madison, WI) or a standard normal diet (ND) containing 17% of calories from fat (7912, Harlan) and then randomly assigned to SED-HFD (sedentary and HFD), EX-HFD (exercise and HFD), SED-ND (sedentary and ND), or EX-ND (exercise and ND) for 8 wk. All groups were allowed to eat ad libitum throughout the duration of the study (except during the time periods of exercise/sedentary). The animals were housed on a 12:12-h light-dark cycle in a temperature-controlled room at 25°C. National Institutes of Health (NIH) guidelines for the care and use of laboratory animals were strictly followed, and all experiments were approved by the Animal Care and Use Committee at The Ohio State University.
Exercise intervention.
Animals were exercise-trained on a motorized treadmill (Columbus Instruments, Columbus, OH) at a speed of 15 m/min, for 40 min per day, 5 days/wk for 8 wk. At the end of the study, the animals were killed 48 h following the last exercise bout.
MRI.
Body fat mass (abdominal part) was evaluated by in vivo MRI, as described previously (31). Briefly, a Bruker 11.7T NMR system operating at a proton frequency of 500 MHz with a gradient strength of 300 G/cm was used. Mice were anesthetized with isoflurane (1.5–2.0%) and placed in a 30-mm birdcage coil. A coronal spin-echo localizing sequence was used to identify both kidneys. Thirty contiguous, 1-mm thick axial slices spanning from the superior pole of the uppermost kidney to the caudal aspect of the mouse were obtained using a spin-echo sequence with a 256×256 matrix size (pixel size, 117×117×1,000 μm3). Data analysis was performed by ImageJ software (http://rsb.info.nih.gov/ij/).
Blood glucose homeostasis and IR assessment.
Before and after 8-wk dietary and exercise interventions, the mice were fasted overnight, and dextrose (2 mg/g body wt) was injected intraperitoneally. The glucose level was measured by placing a drop of blood collected from the tail without anesthesia on an Elite Glucometer (Bayer) every 30 min from 0 to 2 h after the dextrose injection. Insulin levels were determined using an ultrasensitive mouse insulin ELISA kit (Crystal Chem, Downers Grove, IL). IR was estimated using the homeostasis model assessment method (HOMA) based on 1 mg of insulin as equivalent to 24 IU, using the formula HOMA-IR = [fasting insulin concentration (ng/ml) × 24 × fasting glucose concentration (mg/dl)]/405 (17, 33).
Measurement of blood inflammatory biomarkers and triglycerides.
At the end of the study, blood was collected and spun, and serum was stored at −80°C for analysis of cytokines and triglycerides. Cytokine levels were determined by Cytometric Bead Array (BD Biosciences, San Jose, CA). Serum was incubated with beads specific for TNF, IFN-γ, monocyte chemoattractant protein 1 (MCP-1), IL-6, IL-10, and IL-12p70, according to the manufacturer's instructions. The total amount of cytokines was then determined using a BD LSR II instrument and analyzed by the BD CBA software (BD Biosciences). Triglyceride levels were determined by using a triglyceride quantification kit (Abcam, Cambridge, MA) following the manufacturer's instructions.
Myograph experiment.
Thoracic aortic rings (2 mm each) from the mice were mounted in individual organ chambers that were filled with physiological salt solution, as described previously (30, 31). The rings were subjected to graded doses of vasoconstrictor phenylephrine (PE; 10−8 to 10−5 mol/l). After a stable contraction plateau was reached with PE, the rings were exposed to endothelium-dependent vasodilator ACh (10−8.5 to 10−5 mol/l) or endothelium-independent vasodilator sodium nitroprusside (SNP) (10−8.5-10−5 mol/l). In some aortic rings, NG-nitro-l-arginine methyl ester (l-NAME; 10−5 mol/l), an inhibitor of nitric oxide synthase, was added to the vessels on the myograph 30 min before repeating the phenylephrine dose-response measuring force.
Immunohistochemical staining.
Immunohistochemical staining was performed as previously described (33). Briefly, deparaffinized sections (5 μm) were subjected to heat-induced antigen retrieval. The slides were dipped in 0.3% H2O2 for 10 min to quench the endogenous peroxidase. The sections were then incubated in 1% BSA/PBS for 10 min, followed by overnight incubation with primary antibodies at 4°C. Afterward, the slides were incubated at room temperature for 2 h with appropriate horseradish peroxidase (HRP)-conjugated secondary antibodies. The stain was developed using fast 3,3′-diaminobenzidine tablet sets (D4293; Sigma, St. Louis, MO). The sections were counterstained with hematoxylin and examined by light microscopy. The primary antibodies were rat anti-mouse F4/80 (AbD Serotec, Raleigh, NC) and rat anti-mouse UCP1 (Abcam, Cambridge, MA). All measurements were conducted in a double-blinded manner by two independent investigators.
Transmission electron microscopy studies.
To investigate the mitochondrial changes in situ between groups, we examined the ultrastructure of visceral (epididymal) fat by transmission electron microscopy (TEM). Epididymal fat tissue was excised into small pieces (<1 mm3) at the end of the experiment and fixed in 2.5% gluteraldehyde (0.1 M phosphate buffer, pH 7.4) for 3 h. Each specimen was postfixed in 1% osmium tetroxide (OsO4) for 1 h and dehydrated through a graded ethanol series (50–100%). After treatment of propylene oxide, the specimen was embedded in eponate 12 resin, sectioned at a thickness of 80 nm, and stained by 2% aqueous uranyl acetate followed by lead citrate. The grids were then observed in a Technai G2 Spirit transmission electron microscope (FEI, Hillsboro, OR). Mitochondria were imaged at 18,500×. For the morphometric analysis, total mitochondria in five micrographs per group were counted. Mitochondrial size and number were analyzed by National Institutes of Health ImageJ software.
Fluorescence-activated cell sorting.
The APC from BAT were analyzed by flow cytometry, as described elsewhere (24). Briefly, interscapular fat tissue from the mice was excised, minced, and digested in DMEM containing 10% FBS, 1% penicillin-streptomycin, and a combination of collagenase type I (1 mg/ml) and collagenase type II (2 mg/ml) at 37°C for 45 min with constant stirring, and the preadipocytes were isolated, as described previously (31). Cells were incubated with one of the following directly coupled antibodies: Ter119-APC/Cy7, Sca-1-APC, CD34-PE, CD24-PerCP/Cy5.5, CD31-PE/Cy7, and CD29-FITC from BioLegend (San Diego, CA); and CD45-PE/Texas red from Invitrogen (Carlsbad, CA) at 4°C for 30 min. Cells were analyzed on a LSR II flow cytometer (BD Biosciences). First, endothelial cells and hematopoietic cells were depleted from preadipocytes on the basis of staining of CD31, CD45, and Ter119, generating a lineage-negative (Lin−) population. Second, Lin− population was separated on the basis of staining for CD34 and CD29, both of which are expressed by several stem cell populations. Then, the Lin−:CD34+:CD29+ subpopulation was further separated on the basis of staining for Sca-1 and CD24, both of which are expressed on stem cell populations from other tissues. The Lin−:CD34+:CD29+:Sca-1+:CD24+ subpopulation is regarded as APC (24). As negative controls, cell aliquots were incubated with isotype-matched rat IgGs or Armenian hamster IgGs under the same conditions.
Culture and differentiation of primary preadipocytes.
To investigate the effect of HFD on the primary brown preadipocyte population in response to exercise, freshly isolated preadipocytes from BAT of two HFD groups were plated onto six-well plate or eight-chamber slide in DMEM supplemented with 10% FBS (GIBCO, Carlsbad, CA) and maintained at 37°C in a 5% CO2 atmosphere. Cells were allowed to grow to confluence and were then held at confluence for 2 days without changing of the media prior to exposure to the differentiation cocktail (1 μg/ml insulin, 0.25 μg/ml dexamethasone, and 0.5 mM IBMX) in fresh media. Cells were maintained in DMEM with 10% FBS until day 12 for harvest after 72 h of exposure to the differentiation cocktail. Cells were stained with Oil Red O (0.7% in 60% isopropanol) staining or immunocytochemistry for UCP1.
Real-time PCR.
Epididymal and interscapular fat tissues from the mice were excised, and RNA was isolated using TriZOL reagent, according to the manufacturer's instructions. Total RNA was then converted into cDNA using the high-capacity cDNA reverse transcription kit (Applied Biosystems, Foster City, CA). The quantification of gene expression was determined by real-time PCR. All reactions were performed under the same conditions: 50°C for 2 min, 95°C for 10 min, 40 cycles of 95°C for 15 s, and 60°C for 1 min. The primers for mouse UCP1, PRDM16, CCAAT-enhancing binding protein β (C/EBPβ), peroxisome proliferator-activated receptor gamma 2 (Pparg2), PGC-1α, type 2 iodothyronine deiondinase (Dio2), and β-actin are showed in Supplemental Table S1. Beta-actin was used as the control gene, and all data are represented as relative mRNA expression on gene expression.
Western blot analysis.
Epididymal fat depots were homogenized in lysis buffer (Thermo Scientific) with protease inhibitor cocktail (Roche Diagnostics, Indianapolis, IN). The same amounts of protein (40 μg) were separated with SDS-PAGE in 10% polyacrylamide gel, and then transferred to PVDF membranes (Bio-Rad, Hercules, CA). The membranes were immunoblotted with rabbit anti-mouse UCP1 (Abcam) at a 1:1,000 dilution followed by treatment with horseradish peroxidase-conjugated anti-rabbit IgG (Santa Cruz) at a 1:2,000 dilution. The membranes were detected with enhanced chemiluminescence (Super Signal West Pico; Thermo Scientific, Rockford, IL) followed by exposure to X-ray film. The protein bands on the X-ray film were scanned, and the band density was calculated by Quantity One software (Bio-Rad).
Statistical analysis.
Data are expressed as means ± SE unless otherwise indicated. The results of experiments were analyzed by several statistical methods. Specifically, the data of in vitro differentiation of preadipocytes were analyzed by unpaired t-tests. The data for vascular function by myography were analyzed by χ2-test and curve-fitting functions. The data for the others were analyzed by analysis of variance. All of the analyses were performed using GraphPad Prism v4.0 (GraphPad Software, San Diego, CA). In all cases, a P value of <0.05 was considered to be statistically significant.
RESULTS
Body and tissue weights.
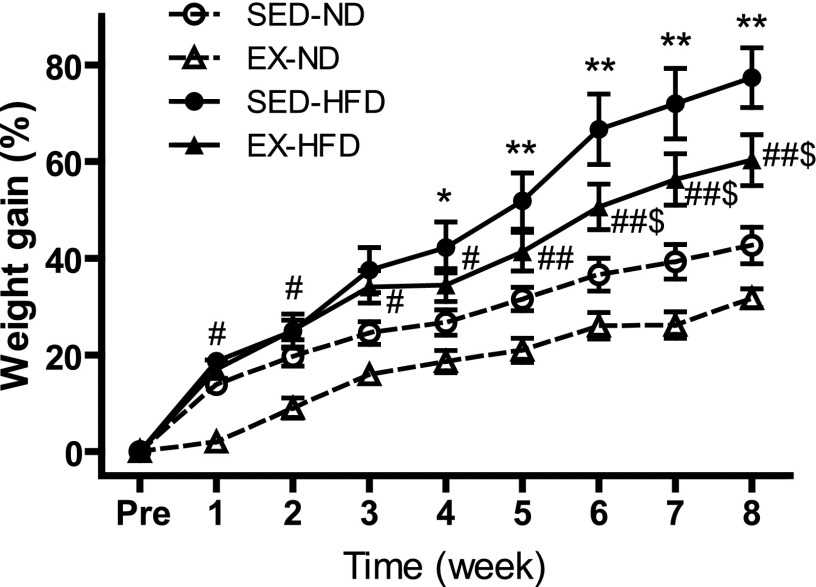
Fig. 1 and Supplemental Table S2 illustrate the changes in body weight that occurred during 8 wk of dietary and exercise interventions. At the preintervention time point, we observed no significant differences among all of the groups in initial body weight. At individual time points, both EX and SED groups that were fed a HFD were significantly heavier than the corresponding groups fed ND from week 5 through week 8, while between two HFD groups, SED groups were heavier than EX groups from week 6 to week 8. As shown in Supplemental Table S2, HFD induced an increase in epididymal and interscapular fat depots, while EX significantly decreased the weight of visceral fat (epididymal fat) but not the weight of interscapular adipose tissue. In addition, mice fed HFD in the exercise group showed a higher ratio of heart weight to body weight than in the sedentary group.
Fig. 1.
Body weight gain after 8 wk of EX or diet intervention. *P < 0.05 vs. SED-ND at each time; **P < 0.001 vs. SED-ND; #P < 0.05 vs. EX-ND; ##P < 0.001 vs. EX-ND at each time; $P < 0.05 vs. SED-HFD at each time; n = 8. Pre, preintervention; SED, sedentary; EX, exercise; ND, standard normal diet; HFD, high-fat diet.
Glucose intolerance, IR, and measurement of systemic inflammatory biomarkers and triglyceride levels.
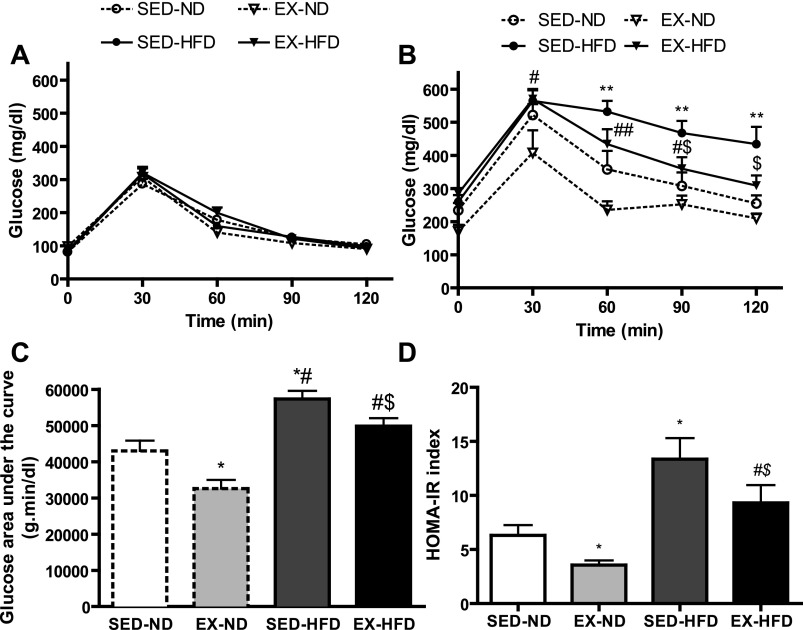
There were no significant differences among the four groups in glucose tolerance at baseline prior to exercise or diet intervention (Fig. 2A). HOMA-IR index is an indicator of insulin sensitivity (15). As shown in Fig. 2, B–D, exercise improved HOMA-IR and glucose tolerance profile in both HFD and ND groups. It is recognized that inflammatory responses at different levels (systemic and local/tissue) may have different pathophysiological impacts. We measured the inflammatory biomarkers in the blood to see whether high-fat diet could induce systemic inflammation and whether exercise might have some effect on it. Supplemental Table S3 showed the systemic inflammatory cytokines and triglyceride levels after 8 wk of exercise and diet interventions. The level of IL-10 or IL-12p70 was too low and nondetectable. Also, we did not find any significant differences in TNF, IFN-γ, or MCP-1 among all these groups, while IL-6 was markedly decreased by exercise in the ND group but not in conjunction with HFD. In addition, the level of triglycerides was remarkably decreased by exercise compared with diet-matched sedentary groups.
Fig. 2.
Blood glucose concentrations and homeostasis model assessment method-insulin resistance (HOMA-IR) index. Intraperitoneal glucose tolerance test (IPGTT) before (A) and after (B) exercise and/or diet intervention. C: glucose area under the curve calculated from the glucose tolerance test from B. D: HOMA-IR index. *P < 0.05 vs. SED-ND at each time; **P < 0.01 vs. SED-ND; #P < 0.05 vs. EX-ND, ##P < 0.01 vs. EX-ND at each time; $P < 0.05 vs. SED-HFD at each time; n = 8.
Adiposity evaluation and inflammation assessment.
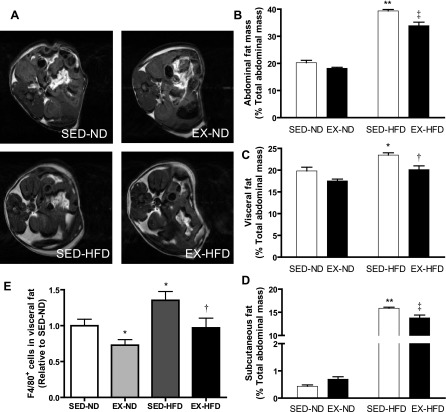
HFD feeding significantly increased total abdominal fat content, which was decreased in response to exercise compared with the sedentary mice (Fig. 3, A–D). With respect to abdominal fat distribution, both visceral and subcutaneous fat contents were increased with HFD feeding compared with those fed ND, whereas they were significantly decreased by exercise training. Regarding tissue inflammation, we investigated that in the visceral white adipose tissue, which is regarded to play a very active role in cardiovascular diseases, by immunohistochemistry. As shown in Fig. 3E, exercise reduced macrophage recruitment in the visceral fat compared with the sedentary groups.
Fig. 3.
Measurement of abdominal fat mass and distribution by magnetic resonance imaging (MRI). Representative T1-weighted spin echo images of abdominal adipose tissues by MRI (A) and analytic data for percentage of total fat content in total abdominal mass (B), percentage of visceral fat (C), and subcutaneous fat (D) in total abdominal mass. E: macrophages (F4/80+ cells) expression via immunohistochemical staining in visceral adipose tissue. *P < 0.05 vs. SED-ND; **P < 0.001 vs. SED-ND; †P < 0.05 vs. SED-HFD; ‡P < 0.001 vs. SED-HFD; n = 8.
Vascular function.
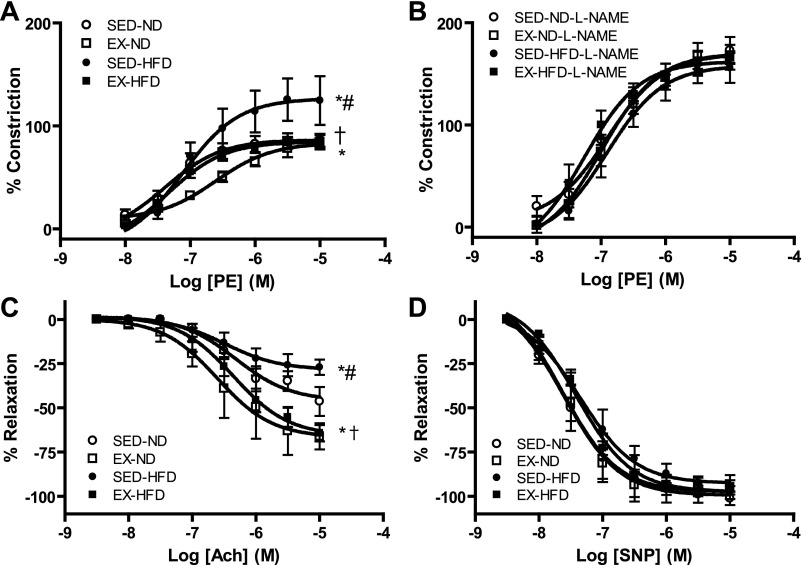
To test the vascular effects of HFD and/or exercise on vascular function, aortic rings from EX or SED mice fed ND or HFD were prepared and mounted on the myograph chamber. HFD feeding mice exhibited enhanced constriction response to phenylephrine and decreased relaxation response to endothelium-dependent vasodilator ACh, whereas these effects were significantly alleviated by exercise intervention (Fig. 4, A–D and Supplemental Table S4). Among the groups, there were no significant differences in constriction responses to phenylephrine in the presence of NOS inhibitor l-NAME and relaxation responses to endothelium-independent vasodilator SNP.
Fig. 4.
Vasomotor tone changes in aortic rings via myograph in response to phenylephrine (PE), acetylcholine (ACh), or sodium nitroprusside (SNP). A–D: vasomotor tone changes in response to PE (A), PE with NG-nitro-l- arginine methyl ester (l-NAME) (B), ACh (C), or SNP (D); n = 8. *P < 0.05 vs. SED-ND; #P < 0.05 vs. EX-ND, †P < 0.05 vs. SED-HFD. M, mol/l.
TEM analysis of in situ mitochondria.
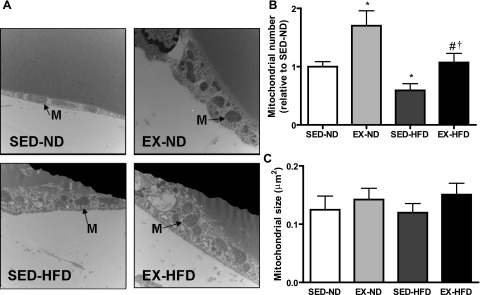
Figure 5A shows representative TEM images of mitochondria in epididymal fat tissue. Two quantitative parameters were used to assess mitochondria: mitochondrial number (Fig. 5B) and size (Fig. 5C). In the HFD feeding group, the population density declined, while the exercise-training group fed ND showed the highest values of mitochondrial population density, although no significant differences were observed for the mitochondrial size among all of the groups.
Fig. 5.
Representative transmission electronic microscopy image (A) and corresponding quantification of mitochondrial number (B) and size (C) in white adipose tissue (WAT) per field. Arrows indicate mitochondria (M). *P < 0.05 vs. SED-ND; #P < 0.05 vs. EX-ND; †P < 0.05 vs. SED-HFD; n = 8. Magnification, ×18,500.
APC population and UCP1 expression.
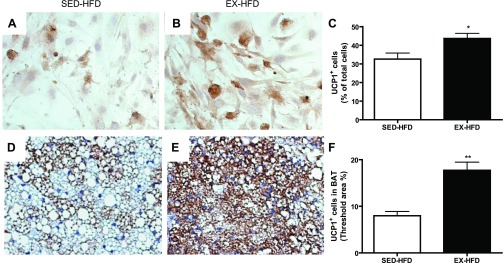
By flow cytometry analysis in the interscapular fat, which is generally considered to be BAT, exercise with or without HFD-feeding induced a significant increase in the brown APC population compared with sedentary mice with diet-matched groups (Fig. 6, A–D). Consistent with these results, ex vivo study on preadipocytes from BAT in the mice fed HFD showed that more cells could be induced and differentiated into adipocytes, as demonstrated by Oil Red O staining, in response to exercise training compared with the sedentary mice (10.2 ± 1.3 vs. 6.2 ± 1.4, P < 0.05). Furthermore, as shown in Fig. 7, A–C, exercise training induced more cells expressing UCP1, as demonstrated by immunocytochemistry. These findings were further confirmed by immunohistochemical staining for UCP1 on the sections of BAT that exercise training induced a greater level of UCP1 expression (Figs. 7, D and F), which may enhance the function of BAT, thereby ameliorating the adiposity and metabolic abnormality.
Fig. 6.
A: schematic representation of the fluorescence-activated cell sorting (FACS) strategy. B: Dot plots showing FACS staining profiles and gating (black boxes) of adipose stromal vascular fraction. The live singlets were analyzed on the basis of lack of CD31 and Ter119 expression and were further separated on the basis of expression of CD45. CD45− cells (Lin−) were then analyzed on the basis of expression of CD34 and CD29, and the CD34+ cells were analyzed on the basis of staining for Sca-1 and CD24. C: representative dot plots for adipocyte progenitor cells (APC) by flow cytometry. D: analytic data for brown APC (Lin−:CD29+:CD34+:Sca-1+:CD24+). *P < 0.05 vs. SED-ND; †P < 0.05 vs. SED-HFD; n = 8.
Fig. 7.
Preadipocytes from brown adipose tissue were cultured and differentiated into adipocytes, which were examined by immunocytochemistry for uncoupling protein 1 (UCP1). Representative images (A and B) and statistical analysis (C) for immunohistochemistry of UCP1 in cells by in vitro study. Representative images (E and F) and statistical analysis (G) for immunohistochemistry of UCP1 in interscapular brown adipose tissue from mice fed HFD. *P < 0.05 vs. SED-HFD; **P < 0.001 vs. SED-HFD; n = 8. BAT, interscapular brown adipose tissue.
BAT-specific gene expression.
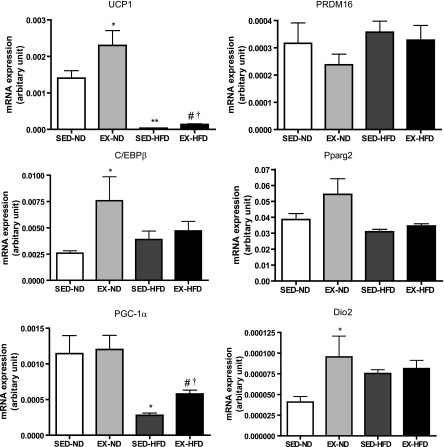
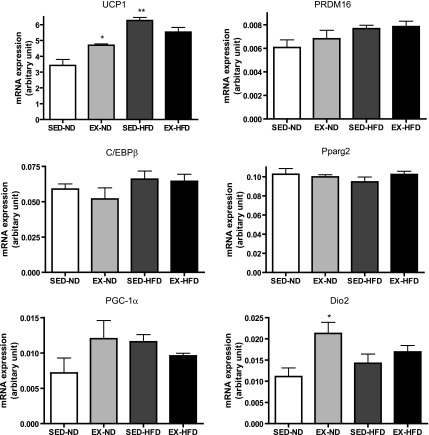
To determine gene expression profiles of WAT and BAT in response to exercise, we checked the expression levels of brown adipocyte-specific gene profiles by real-time PCR analysis (Fig. 8). We observed that the mRNA levels of the brown adipocyte-specific gene UCP1 and PGC-1α were significantly decreased in the WAT in response to HFD, while both were significantly increased by exercise training compared with the corresponding diet-matched groups. Consistent with the gene expression, the observation was further confirmed by Western blot for UCP1 at protein level, as shown in Supplemental Fig. S1. Dio2 may catalyze the conversion of T4 (thyroxine) into the active substance T3 (3,5,3′-tri-iodothyronine) in BAT. The mRNA levels of Dio2 were significantly increased in the WAT of EX mice fed ND compared with the SED mice on the same diet. In addition, C/EBPβ gene expression was enhanced in response to exercise compared with the sedentary, ND-fed group, although there were no changes in PRDM16 or Pparg2 among all of the groups. Also, we wanted to know whether exercise or HFD might change the brown adipocyte-specific gene profiles in BAT. As shown in Fig. 9, the mRNA levels of UCP1 and Dio2 were significantly increased by exercise in the mice fed ND compared with the sedentary group on the same diet.
Fig. 8.
Brown adipocyte-specific gene expression in white adipose tissue. *P < 0.05 vs. SED-ND; **P < 0.001 vs. SED-ND; #P < 0.05 vs. EX-ND; †P < 0.05 vs. SED-HFD; n = 8. UCP1, uncoupling protein 1; PRDM16, PRD1-BF1-RIZ1, homologous domain containing 16; C/EBPβ, CCAAT enhancing binding protein β; Pparg2, peroxisome proliferator-activated receptor-γ 2; PGC-1α, peroxisome proliferator-activated receptor-γ coactivator 1-α; Dio2, type 2 iodothyronine deiondinase.
Fig. 9.
Brown adipocyte-specific gene expression in brown adipose tissue. *P < 0.05 vs. SED-ND; **P < 0.001 vs. SED-ND; n = 8. PRDM16, PRD1-BF1-RIZ1 homologous domain containing 16.
DISCUSSION
In this study, we evaluated the role of exercise training on HFD-induced inflammation, adiposity, IR, metabolic disorders, and vascular dysfunction, as well as changes in brown APC population and in vitro brown adipogenesis in a rodent model. To our knowledge, this study is the first to study the effect of exercise on APC population and adipogenesis in a high-fat diet-induced mouse model. There are several important findings in this study. First, exercise increases mitochondrial number and brown adipocyte-specific gene expression in visceral fat. Second, HFD feeding induces glucose intolerance, IR, and adiposity, while exercise may ameliorate these adverse effects. Third, HFD feeding results in vascular dysfunction, while exercise improves the vascular function. Finally, exercise increases UCP1 expression, and enhances brown APC population and brown adipogenesis.
The regulation of fat tissue generation, or adipogenesis, is of paramount medical importance due to the increasing prevalence of obesity-related morbidity globally. The accumulation of fat is the net result of a prolonged state of imbalance between energy intake and energy expenditure. BAT represents a natural target for the modulation of energy expenditure. Therefore, promoting BAT function could reduce or prevent obesity. Specifically expressed in BAT mitochondria, UCP1 is largely responsible for the uncoupling of respiration from ATP synthesis, resulting in dissipation of energy as heat (23). Accordingly, BAT plays an important role in the maintenance of body temperature and energy balance. In humans, UCP1 is present in neonates but was considered until recently to disappear early in life. In adult humans, few brown APC still exist in the WAT, which can be induced to differentiate into UCP1-expressing cells (4, 8), and these “brite” (brown-in-white) adipocytes display several classical brown adipocyte characteristics, most notably the presence of UCP1 (18, 21). Besides UCP1, proteins such as Dio2 have been shown to be highly enriched in BAT (26). PGC-1α, a coactivator of multiple transcription factors, such as nuclear respiratory factor (NRF-1/2) and peroxisome proliferator-activated receptor (PPAR) (10, 11), is also highly expressed in BAT but low in WAT (16). Furthermore, PGC-1α has been shown to coordinate multiple physiological cues for mitochondrial biogenesis and activity (14). For adipogenesis, a number of growth factors and mitogens can initiate activation of C/EBPs (22). It has been reported that BAT serves a very important function in protection from diet-induced obesity, diabetes, and IR (13). In this study, we demonstrate that exercise enhances certain brown adipocyte-specific gene expression in the BAT, as well as WAT, suggesting that exercise training may induce important alteration in BAT and/or BAT-like phenotypic changes in WAT. Additionally, compared with sedentary HFD feeding group, exercise increases the brown adipocyte-specific protein UCP1 expression level in BAT, thereby enhancing the oxidative phosphorylation and dissipation of energy as heat, improving the energy balance, and ameliorating adiposity and its complications. In WAT, exercise increased mitochondrial number and also enhanced UCP1 expression levels and thus poised the mitochondria for uncoupling of respiration. Complementing the effects on tissues metabolizing fat, such as BAT, was the effect of exercise on storage tissues, such as WAT, where it reduced both fat pad mass and adipocyte size. The progenitor cells in WAT have been shown to be capable of differentiating into functional WAT in mouse models (24). The existence of a single progenitor cell type, giving rise to distinct pools of brown vs. white preadipocytes, is still unclear, as brown and white preadipocytes appear “committed” at that stage and are only able to differentiate into brown and white adipocytes, respectively (9). In this study, we found that exercise training increases brown APC population and enhances brown adipogenesis in vitro.
Exercise training is known to increase mitochondrial biogenesis in skeletal muscle (34), but little is known about the effects of exercise on mitochondrial biogenesis in WAT. Recently, Sutherland and colleagues examined the effect of both acute and chronic exercise on the markers of mitochondrial biogenesis in WAT and explored potential mechanisms by which exercise might exert these effects (32). In their study, the data showed that exercise increases mitochondrial content and function. Exercise training produced predictable changes in body composition, such that exercise-trained rats gained less weight and had smaller fat pads than sedentary rats. In accordance with their findings, our study showed that exercise induces more mitochondrial content by TEM measurement and attenuates adiposity in both subcutaneous and visceral fat mass in C57BL/6 mice by MRI analysis. Additionally, our study also demonstrated that exercise ameliorates glucose intolerance and IR and improves vascular dysfunction.
Exercise training has been shown to have anti-inflammatory properties, although the mechanism(s) responsible for this effect is not known (20). A weight-loss intervention in humans of combined diet and exercise resulted in a reduction in subcutaneous WAT inflammation, as measured by macrophage content and inflammatory cytokine gene expression, suggesting that exercise and/or dietary restriction may have anti-inflammatory effects on WAT (3). Gomez-Merino et al. (12) revealed that 7 wk of exercise training without dietary restriction reduced body weight and inflammatory cytokines in the WAT of nonobese rats. Bradley et al. (2) investigated the effects of voluntary exercise on WAT expression of inflammatory cytokines on HFD-induced obese C57BL/6 mice. They found that fat mass, as well as TNF-α and MCP-1 mRNA in WAT were reduced in exercise-trained mice, even when the mice continued with a HFD. In our study, HFD and/or exercise training did not lead to many changes in the inflammatory cytokines, whereas exercise did ameliorate the inflammation in visceral adipose tissue, which is coupled with improved glucose intolerance, IR, and vascular function.
There are several limitations in the current study. First, these findings are limited to the mice at a young age. Second, although we already demonstrated brown adipogenesis in vitro, the capability of differentiation into functional BAT from brown APC has not been shown in an in vivo study, which is under investigation in our laboratory. Additionally, the detailed mechanisms pertaining aortic vascular response are very limited, primarily due to the sample limitation of aortic rings.
Perspectives and Significance
Sedentary lifestyles and a ready supply of high-calorie foods have led to a massive rise in the prevalence of obesity. The accumulation of WAT, especially in the visceral compartment, is associated with metabolic and cardiovascular complications. Since the mechanisms underlying the beneficial effects of exercise have yet to be fully elucidated, it is critical to investigate whether BAT or brown APC contributes to enhanced insulin sensitivity and glucose homeostasis. The significance of this study was that our findings suggest that exercise could ameliorate the high-fat diet-induced obesity/IR and cardiovascular dysfunction, and induce brown APC and brown adipogenesis. The evidence supports the current public health initiative to encourage the public to adopt and maintain a physically active lifestyle, even from an early age. The identification of brown APC and the ability to induce brown adipocyte differentiation in vivo, will further explore the possibility of a therapeutic approach for obesity and metabolic diseases based on the brown adipocyte-mediated energy expenditure.
GRANTS
This work was funded by grants ES016588, ES017412, and ES018900 to Dr. Sun and ES015146 to Dr. Rajagopalan from the National Institute of Health and Diabetes Action Research and Education Foundation (Diabetes Action) to Dr. Sun.
DISCLOSURES
No conflicts of interest, financial or otherwise, are declared by the authors.
Supplementary Material
ACKNOWLEDGMENTS
The authors would like to thank the support from Campus Microscopy and Imaging Facility at The Ohio State University for the transmission electron microscopy experiment.
REFERENCES
- 1. Anderson SE, Whitaker RC. Prevalence of obesity among U.S. preschool children in different racial and ethnic groups. Arch Pediatr Adolesc Med 163: 344–348, 2009. [DOI] [PubMed] [Google Scholar]
- 2. Bradley RL, Jeon JY, Liu FF, Maratos-Flier E. Voluntary exercise improves insulin sensitivity and adipose tissue inflammation in diet-induced obese mice. Am J Physiol Endocrinol Metab 295: E586–E594, 2008. [DOI] [PMC free article] [PubMed] [Google Scholar]
- 3. Bruun JM, Helge JW, Richelsen B, Stallknecht B. Diet and exercise reduce low-grade inflammation and macrophage infiltration in adipose tissue but not in skeletal muscle in severely obese subjects. Am J Physiol Endocrinol Metab 290: E961–E967, 2006. [DOI] [PubMed] [Google Scholar]
- 4. Champigny O, Ricquier D. Evidence from in vitro differentiating cells that adrenoceptor agonists can increase uncoupling protein mRNA level in adipocytes of adult humans: an RT-PCR study. J Lipid Res 37: 1907–1914, 1996. [PubMed] [Google Scholar]
- 5. Cook S, Weitzman M, Auinger P, Nguyen M, Dietz WH. Prevalence of a metabolic syndrome phenotype in adolescents: findings from the third National Health and Nutrition Examination Survey, 1988–1994. Arch Pediatr Adolesc Med 157: 821–827, 2003. [DOI] [PubMed] [Google Scholar]
- 6. Cypess AM, Lehman S, Williams G, Tal I, Rodman D, Goldfine AB, Kuo FC, Palmer EL, Tseng YH, Doria A, Kolodny GM, Kahn CR. Identification and importance of brown adipose tissue in adult humans. N Engl J Med 360: 1509–1517, 2009. [DOI] [PMC free article] [PubMed] [Google Scholar]
- 7. de Ferranti SD, Gauvreau K, Ludwig DS, Neufeld EJ, Newburger JW, Rifai N. Prevalence of the metabolic syndrome in American adolescents: findings from the Third National Health and Nutrition Examination Survey. Circulation 110: 2494–2497, 2004. [DOI] [PubMed] [Google Scholar]
- 8. Digby JE, Montague CT, Sewter CP, Sanders L, Wilkison WO, O'Rahilly S, Prins JB. Thiazolidinedione exposure increases the expression of uncoupling protein 1 in cultured human preadipocytes. Diabetes 47: 138–141, 1998. [DOI] [PubMed] [Google Scholar]
- 9. Elabd C, Chiellini C, Carmona M, Galitzky J, Cochet O, Petersen R, Penicaud L, Kristiansen K, Bouloumie A, Casteilla L, Dani C, Ailhaud G, Amri EZ. Human multipotent adipose-derived stem cells differentiate into functional brown adipocytes. Stem Cells 27: 2753–2760, 2009. [DOI] [PubMed] [Google Scholar]
- 10. Evans MJ, Scarpulla RC. NRF-1: a trans-activator of nuclear-encoded respiratory genes in animal cells. Genes Dev 4: 1023–1034, 1990. [DOI] [PubMed] [Google Scholar]
- 11. Ferre P. The biology of peroxisome proliferator-activated receptors: relationship with lipid metabolism and insulin sensitivity. Diabetes 53 Suppl 1: S43–S50, 2004. [DOI] [PubMed] [Google Scholar]
- 12. Gomez-Merino D, Drogou C, Guezennec CY, Chennaoui M. Effects of chronic exercise on cytokine production in white adipose tissue and skeletal muscle of rats. Cytokine 40: 23–29, 2007. [DOI] [PubMed] [Google Scholar]
- 13. Hamann A, Flier JS, Lowell BB. Decreased brown fat markedly enhances susceptibility to diet-induced obesity, diabetes, and hyperlipidemia. Endocrinology 137: 21–29, 1996. [DOI] [PubMed] [Google Scholar]
- 14. Handschin C, Spiegelman BM. Peroxisome proliferator-activated receptor gamma coactivator 1 coactivators, energy homeostasis, and metabolism. Endocr Rev 27: 728–735, 2006. [DOI] [PubMed] [Google Scholar]
- 15. Katsuki A, Sumida Y, Gabazza EC, Murashima S, Furuta M, Araki-Sasaki R, Hori Y, Yano Y, Adachi Y. Homeostasis model assessment is a reliable indicator of insulin resistance during follow-up of patients with type 2 diabetes. Diabetes Care 24: 362–365, 2001. [DOI] [PubMed] [Google Scholar]
- 16. Lin J, Handschin C, Spiegelman BM. Metabolic control through the PGC-1 family of transcription coactivators. Cell Metab 1: 361–370, 2005. [DOI] [PubMed] [Google Scholar]
- 17. Lloyd DJ, Helmering J, Cordover D, Bowsman M, Chen M, Hale C, Fordstrom P, Zhou M, Wang M, Kaufman SA, Veniant MM. Antidiabetic effects of 11β-HSD1 inhibition in a mouse model of combined diabetes, dyslipidaemia and atherosclerosis. Diabetes Obes Metab 11: 688–699, 2009. [DOI] [PubMed] [Google Scholar]
- 18. Nedergaard J, Cannon B. The changed metabolic world with human brown adipose tissue: therapeutic visions. Cell Metab 11: 268–272, 2010. [DOI] [PubMed] [Google Scholar]
- 19. Park KW, Halperin DS, Tontonoz P. Before they were fat: adipocyte progenitors. Cell Metab 8: 454–457, 2008. [DOI] [PubMed] [Google Scholar]
- 20. Petersen AM, Pedersen BK. The anti-inflammatory effect of exercise. J Appl Physiol 98: 1154–1162, 2005. [DOI] [PubMed] [Google Scholar]
- 21. Petrovic N, Walden TB, Shabalina IG, Timmons JA, Cannon B, Nedergaard J. Chronic peroxisome proliferator-activated receptor gamma (PPARgamma) activation of epididymally derived white adipocyte cultures reveals a population of thermogenically competent, UCP1-containing adipocytes molecularly distinct from classic brown adipocytes. J Biol Chem 285: 7153–7164, 2010. [DOI] [PMC free article] [PubMed] [Google Scholar]
- 22. Prusty D, Park BH, Davis KE, Farmer SR. Activation of MEK/ERK signaling promotes adipogenesis by enhancing peroxisome proliferator-activated receptor gamma (PPARgamma) and C/EBPalpha gene expression during the differentiation of 3T3–L1 preadipocytes. J Biol Chem 277: 46226–46232, 2002. [DOI] [PubMed] [Google Scholar]
- 23. Ricquier D. Respiration uncoupling and metabolism in the control of energy expenditure. Proc Nutr Soc 64: 47–52, 2005. [DOI] [PubMed] [Google Scholar]
- 24. Rodeheffer MS, Birsoy K, Friedman JM. Identification of white adipocyte progenitor cells in vivo. Cell 135: 240–249, 2008. [DOI] [PubMed] [Google Scholar]
- 25. Rosen ED, Spiegelman BM. Adipocytes as regulators of energy balance and glucose homeostasis. Nature 444: 847–853, 2006. [DOI] [PMC free article] [PubMed] [Google Scholar]
- 26. Silva JE, Larsen PR. Adrenergic activation of triiodothyronine production in brown adipose tissue. Nature 305: 712–713, 1983. [DOI] [PubMed] [Google Scholar]
- 27. Sorisky A, Magun R, Gagnon AM. Adipose cell apoptosis: death in the energy depot. Int J Obes Relat Metab Disord 24 Suppl 4: S3–S7, 2000. [DOI] [PubMed] [Google Scholar]
- 28. Spalding KL, Arner E, Westermark PO, Bernard S, Buchholz BA, Bergmann O, Blomqvist L, Hoffstedt J, Naslund E, Britton T, Concha H, Hassan M, Ryden M, Frisen J, Arner P. Dynamics of fat cell turnover in humans. Nature 453: 783–787, 2008. [DOI] [PubMed] [Google Scholar]
- 29. Spiegelman BM, Flier JS. Obesity and the regulation of energy balance. Cell 104: 531–543, 2001. [DOI] [PubMed] [Google Scholar]
- 30. Sun Q, Wang A, Jin X, Natanzon A, Duquaine D, Brook RD, Aguinaldo JG, Fayad ZA, Fuster V, Lippmann M, Chen LC, Rajagopalan S. Long-term air pollution exposure and acceleration of atherosclerosis and vascular inflammation in an animal model. JAMA 294: 3003–3010, 2005. [DOI] [PubMed] [Google Scholar]
- 31. Sun Q, Yue P, Deiuliis JA, Lumeng CN, Kampfrath T, Mikolaj MB, Cai Y, Ostrowski MC, Lu B, Parthasarathy S, Brook RD, Moffatt-Bruce SD, Chen LC, Rajagopalan S. Ambient air pollution exaggerates adipose inflammation and insulin resistance in a mouse model of diet-induced obesity. Circulation 119: 538–546, 2009. [DOI] [PMC free article] [PubMed] [Google Scholar]
- 32. Sutherland LN, Bomhof MR, Capozzi LC, Basaraba SA, Wright DC. Exercise and adrenaline increase PGC-1α mRNA expression in rat adipose tissue. J Physiol 587: 1607–1617, 2009. [DOI] [PMC free article] [PubMed] [Google Scholar]
- 33. Xu X, Yavar Z, Verdin M, Ying Z, Mihai G, Kampfrath T, Wang A, Zhong M, Lippmann M, Chen LC, Rajagopalan S, Sun Q. Effect of early particulate air pollution exposure on obesity in mice: role of p47phox. Arterioscler Thromb Vasc Biol 30: 2518–2527, 2010. [DOI] [PMC free article] [PubMed] [Google Scholar]
- 34. Zong H, Ren JM, Young LH, Pypaert M, Mu J, Birnbaum MJ, Shulman GI. AMP kinase is required for mitochondrial biogenesis in skeletal muscle in response to chronic energy deprivation. Proc Natl Acad Sci USA 99: 15983–15987, 2002. [DOI] [PMC free article] [PubMed] [Google Scholar]
Associated Data
This section collects any data citations, data availability statements, or supplementary materials included in this article.


