

How can cancer cells survive the consequences of cyt-c release? Huber et al provide a quantitative analysis of the protective role of enhanced glucose utilization in cancer cells and investigate the impact of cell-to-cell heterogeneity in mitochondrial bioenergetics.
Keywords: apoptosis, bioenergetics, cancer, ODE, single-cell imaging
Abstract
Many anticancer drugs activate caspases via the mitochondrial apoptosis pathway. Activation of this pathway triggers a concomitant bioenergetic crisis caused by the release of cytochrome-c (cyt-c). Cancer cells are able to evade these processes by altering metabolic and caspase activation pathways. In this study, we provide the first integrated system study of mitochondrial bioenergetics and apoptosis signalling and examine the role of mitochondrial cyt-c release in these events. In accordance with single-cell experiments, our model showed that loss of cyt-c decreased mitochondrial respiration by 95% and depolarised mitochondrial membrane potential ΔΨm from −142 to −88 mV, with active caspase-3 potentiating this decrease. ATP synthase was reversed under such conditions, consuming ATP and stabilising ΔΨm. However, the direction and level of ATP synthase activity showed significant heterogeneity in individual cancer cells, which the model explained by variations in (i) accessible cyt-c after release and (ii) the cell's glycolytic capacity. Our results provide a quantitative and mechanistic explanation for the protective role of enhanced glucose utilisation for cancer cells to avert the otherwise lethal bioenergetic crisis associated with apoptosis initiation.
Introduction
Cytochrome-c (cyt-c) is a key component of the mitochondrial respiratory chain, located in the intermembrane space (IMS) and responsible for transporting electrons from respiratory complex III to complex IV. By converting the redox potential established by glycolysis and the tricarboxylic acid cycle (TCA) into a proton gradient across the inner mitochondrial membrane, cyt-c is required to maintain polarisation of the mitochondrial transmembrane potential (ΔΨm). In turn, ΔΨm establishes a proton-motive force for the (FoF1-)ATP synthase to produce ATP (oxidative phosphorylation—OXPHOS; Mitchell, 1961; Nicholls and Ward, 2000), which preserves the cycling of Na+, Ca2+, K+, Cl− ions and protons across the mitochondrial and the plasma membranes to maintain ionic and osmotic homeostasis and to prevent necrotic cell death (Nicholls, 1977; Nicholls and Budd, 2000).
To induce cancer cell death, chemotherapeutic agents often generate conditions such as genotoxic stress that lead to cyt-c release from the mitochondrial IMS into the cytosol, a process referred to as mitochondrial outer membrane permeabilisation (MOMP). This disrupts the mitochondrial respiratory chain and causes ΔΨm depolarisation, which in turn can result in a bioenergetic crisis characterised by ATP depletion, loss of ionic homeostasis, increased osmotic pressure and necrotic cell death (Jurgensmeier et al, 1998; Nicholls and Budd, 2000; Dussmann et al, 2003a). In addition, cyt-c release is also a direct transducer of apoptotic signals. Its presence in the cytosol enables the formation of the apoptosome, a heptameric complex of the cytosolic apoptotic protease-activating factor-1 and caspase-9 (Liu et al, 1996; Kluck et al, 1997), which activates effector caspases, in particular caspase-3 (Srinivasula et al, 1998; Slee et al, 1999).
However, many cancer cells have developed strategies to survive both consequences of cyt-c release. Some cancer cells bypass caspase-dependent apoptosis through loss-of-function mutations or overexpression of caspase inhibitors. While the molecular mechanisms and systems aspects of impairment of caspase-dependent cell death are quite well understood (Deveraux and Reed, 1999; Rehm et al, 2006; Huber et al, 2007, 2010), the means by which cancer cells can survive, despite cyt-c release-induced bioenergetic crisis, remain more elusive. The complexity of bioenergetic pathways can barely be captured by traditional studies that focus on a single metabolite or protein at a time. Moreover, interdependencies between mitochondrial and cellular bioenergetics and caspase-dependent cell death have been identified (Matsuyama et al, 2000; Ricci et al, 2003), posing the need for their coinvestigation in a holistic approach. In this report, we present the first integrated systems biology study of mitochondrial bioenergetics and apoptosis and bridge the gap between metabolic modelling and a single-cell experimental analysis. We developed a computational model that integrates existing knowledge from metabolic engineering (Beard 2005; Korzeniewski and Brown, 1998) with our recently established, ordinary differential equations (ODEs) based model of the mitochondrial apoptosis pathway (Rehm et al, 2006; Huber et al, 2007).
Our approach and findings are summarised by the chart shown in Figure 1. Challenging the model with single-cell experiments, we remodelled the kinetics of mitochondrial depolarisation after cyt-c release in the presence or absence of caspase activation. Mathematical modelling and experimental validation identified glycolysis and variations in the amount of cyt-c that remains accessible for respiration at the mitochondria to be the key factors in determining the ability of cancer cells to prevent a bioenergetic crisis post-cyt-c release.
Figure 1.

Organisation scheme of the combined single-cell microscopy and in silico analysis. The scheme shows a workflow diagram of the procedure that was pursued as outlined in the main text. Results of in silico modelling are shown in blue boxes. Red boxes indicate experimental validations as performed by single-cell microscopy or by data obtained from the literature on isolated mitochondria. Green boxes depict research findings that were identified within the text and which resulted from challenging the in silico predictions with experimental data and vice versa.
Results
Model calibration to in vitro data for ATP-producing and non-ATP-producing mitochondria
We devised our model with gradually increasing complexity and thus started with the widely studied experimental system of isolated mitochondria. We assembled the network of electrochemical reactions consisting of mitochondrial respiration, ATP production and ion transport, and used a fixed NADH/NAD disequilibrium as model input (Figure 2, and Materials and methods section). By Monte-Carlo screening, we calibrated the model into three scenarios that have been experimentally well described. These were (i) ATP producing (‘state-3’) mitochondria in buffered medium of an ATP/ADP ratio of 3:1 (75% ATP, 25% ADP), (ii) non-ATP producing, resting-state (‘state-4’) mitochondria (100% ATP, no ADP) and (iii) a situation where we considered mitochondria to change from state-3 to state-4 (Supplementary Figure 1A). Further details on the model construction and its calibration can be found in Supplementary Text I.
Figure 2.

Computational model of mitochondrial bioenergetics during cyt-c release and apoptosis. Interactions and transport processes between the mitochondrial matrix (‘Matrix’), mitochondrial intermembrane space (‘IMS’) and the cytosol (‘Cytosol’). Roman numbers indicate single-cell processes that influence mitochondrial bioenergetics: (I) model of mitochondrial apoptosis (according to Rehm et al, 2006) that activates caspase-3 upon cyt-c release; (II) cytosolic ATP production and consumption; (III) active caspase-3 cleaving complex I/II; (IV) cyt-c release. Metabolite and ion fluxes of mitochondrial bioenergetics are given by Arabic numbers: (1) input function (NADH/NAD disequilibrium=45.8:1); (2–4) respiration complexes I/II (considered together), III and IV; (5) ATP synthase; (6) adenosine nucleotide transferase (ANT); (7) mitochondrial inner membrane proton leaks; (8) passive transport of adenosine phosphates and anorganic phosphate trough the outer mitochondrial membrane; (9) phosphate–proton cotransport and (10) proton–potassium antiport.
Our best fit led to a respiratory control ratio (state-3/state-4 respiration ratio) of 6.5:1, which is in agreement with reported values of 5–10 (Nicholls, 1974a, 1974b; Nicholls and Ward, 2000). ΔΨm values were calculated to be −157 mV for state-4 and −137 mV for state-3, consistent with literature values of ΔΨm from −140 to −150 mV (Nicholls and Budd, 2000) and with a reported 10–15% increase in ΔΨm polarisation when mitochondria switch from state-3 to state-4 on ATP replenishment (Nicholls, 1974). Transmembrane ΔpH between the mitochondrial matrix and the mitochondrial IMS was calculated as 0.41 for state-3 and 0.32 for state-4 (Supplementary Figure 1B). In the case where we modelled state-3 to state-4 transitions, we achieved ATP replenishment within 2 min in accordance with the well-established rapid kinetics of ATP production, where a 90% equilibrium was reached in about 1 min (Pfaff et al, 1969; Supplementary Figure 1C for ATP/ADP ratio 1D for respiration flux and ΔΨm, 1E for ATP synthase proton flux and activity of constitutive proton leaks over time). A detailed sensitivity analysis of the influence of model parameters (Supplementary Table VII) on calibration results is given in Supplementary Figure 2. A parameter cluster analysis (Gutenkunst et al, 2007) allowed to characterise the model mechanistic and identified four principal components that explain 94% of the model parameter variations (Supplementary Figure 3). Further details on the model mechanistic and sensitivity analysis can be found in Supplementary Text II.
Cyt-c release impairs respiratory flux and leads to mitochondrial depolarisation
Mitochondrial cyt-c release following MOMP is considered as a point of no return in the mitochondrial apoptosis pathway. Loss of cyt-c disrupts the mitochondrial electron transport chain between complex III and IV, depolarises ΔΨm and impairs ATP production. Once in the cytosol, cyt-c leads to activation of the apoptosome-dependent cell death pathway and caspase-3 activation (Green and Kroemer, 2004). However, evidence has been presented that mitochondria and cellular bioenergetics can recover after the release of cyt-c, particularly when effector caspase activation is impaired (Waterhouse et al, 2001; Dussmann et al, 2003a; Colell et al, 2007). These studies suggested that cells can survive a MOMP-dependent energy crisis subsequent to cyt-c release.
We used the model to investigate the effect of cyt-c release on respiration and ΔΨm in the presence or absence of active caspases. Cyt-c release was modelled to start at time t=10 min after assuming cells in equilibrium. The kinetic parameters of cyt-c release were extracted from previous single-cell measurements (see Materials and methods section; Goldstein et al, 2000; Luetjens et al, 2001; Waterhouse et al, 2001; Dussmann et al, 2003a, Figure 3A, dotted green line). We assumed re-equilibration of cyt-c between the IMS and the cytosol, and therefore concluded that a final cyt-c fraction of 0.1% remained accessible for respiration (see Method section). We have hitherto denoted this cyt-c fraction as ‘respiration-accessible cyt-c’.
Figure 3.
Live cell imaging and computational modelling of cyt-c release and mitochondrial depolarisation in HeLa cells expressing cyt-c–GFP. (A) Remodelling of experimentally observed cyt-c release at time point t=10 min (Goldstein et al, 2000; Waterhouse et al, 2001; Dussmann et al, 2003a) with a half-time of 1.5 min and a remnant value of 0.1% (green dotted line), as described in the text, leads to active caspase-3 (black solid line) and deactivation of complex I/II (according to the model of Rehm et al, 2006) within 15–20 min after onset of cyt-c release (blue dashed line). (B) Calculated depolarisation of mitochondrial membrane potential as a consequence of cyt-c release as given in (A) with or without caspase-3-induced complex I/II cleavage (dashed red and solid blue line). (C, D) Representative single-cell traces of HeLa cells expressing cyt-c–GFP incubated with 30 nM TMRM and exposed to 3 μM staurosporine (STS). (C) Traces of cyt-c release as indicated by the decrease in the s.d. of average GFP pixel intensity and mitochondrial depolarisation measured by the average pixel intensity of TMRM (both normalised to initial values) of the two labelled cells in (E). (E) Fluorescence images of cyt-c–GFP release followed by TMRM depletion, which indicates depolarisation of ΔΨm. Residual TMRM staining is lost after addition of FCCP. Scale bar, 10 μm. (D, F) As in (C, E), but in the presence of 100 μM of the caspase inhibitor zVAD-fmk administrated 1 h prior to exposure to 3 μM STS. Source data is available for this figure at www.nature.com/msb.

We further modelled cyt-c to induce apoptosome formation and to activate caspase-3 after release. Therefore, we included our previously established model of mitochondrial apoptosis (Rehm et al, 2006) as a code subroutine and calculated the level of active caspase-3 over time. The model predicted caspase-3 activation and deactivation of complex I/II as previously reported (Ricci et al, 2003; Figure 3A, solid back and blue dashed lines, respectively) within 10–15 min of cyt-c release.
As another consequence of cyt-c release, respiratory flux was decreased after onset of cyt-c release to 5% within 10–15 min, while a further decrease to 1% was observed when caspase-3 was active (see Supplementary Figure 4A for a mechanistic scheme and 4B for results). Depolarisation to a remnant ΔΨm of −88 or −76 mV was evident in the absence or presence of active caspase-3, respectively (Figure 3B). ΔΨm depolarisation after cyt-c release and further depolarisation by active caspase-3 were robust over a wide range of model parameter variations (see Supplementary Figure 5 and Supplementary Text II for a sensitivity analysis).
To validate the kinetics of ΔΨm depolarisation and the effect of active caspase-3 in cellulo, we performed single-cell imaging experiments using HeLa cells expressing cyt-c–green fluorescent protein (GFP), which we incubated with 30 nM tetramethyl rhodamine methyl-ester (TMRM). Cyt-c release was induced with 3 μM of the broad-spectrum kinase-inhibitor staurosporine (STS). Indeed, these experiments suggested a greater degree of mitochondrial depolarisation in the absence of a broad-spectrum caspase-inhibitor Z-Val-Ala-Asp(O-methyl)-fluoromethylketone (zVAD-fmk; Figure 3C and E) than in its presence (Figure 3D and F). This indicates a role of caspase-3 in ΔΨm depolarisation after cyt-c release, although the influence of changes in plasma membrane potential on TMRM redistribution upon caspase activation cannot be excluded (Dussmann et al, 2003a).
In summary, the single-cell model mechanistically described and quantified ΔΨm depolarisation as measured in living cells subsequent to cyt-c release. Moreover, it suggested that an additional complex I/II cleavage may further impair respiration and ΔΨm.
Characterisation of ATP synthase reversal as a stabiliser of ΔΨm
Maintenance of ΔΨm subsequent to cyt-c release is essential for ionic homeostasis within the cell and thus may prevent the onset of necrotic cell death (Nicholls, 1977; Nicholls and Budd, 2000). Reversal of ATP synthase has been proposed to stabilise ΔΨm by pumping protons from the matrix into the IMS, while consuming instead of generating ATP (Goldstein et al, 2000; Chinopoulos and Adam-Vizi, 2009). However, it has also been reported that ΔΨm can stabilise in the absence of ATP synthase reversal. We therefore aimed to investigate whether and under what conditions ATP synthase reversal was present and if so what the implications on cytosolic ATP and ΔΨm were. We first confirmed that ATP synthase activity was reversed 10 min after onset of cyt-c release when respiration-accessible cyt-c decreased to 0.1% in our model (Figure 4A, blue solid line). This was slightly more pronounced when caspase-3 deactivation of complex I/II was also taken into consideration (Figure 4A, red dashed line). Moreover, our model confirmed that ATP synthase reversal consumed ATP (Supplementary Figure 6A), that glycolysis prevented ATP depletion during this reversal (Supplementary Figure 6B) and that ATP synthase reversal was robust when model parameters (Supplementary Table VII) were increased or decreased over a fivefold parameter range (Supplementary Figure 7A and Supplementary Text II).
Figure 4.
Model prediction: ATP synthase reversal stabilises ΔΨm via ATP consumption. (A) ATP synthase for the modelled cell in Figure 3 (A, B) is stably reversed from ∼10 min after the onset of cyt-c release in the presence (blue solid line) or absence (red dashed line) of caspase-3 feedback to complex I/II. (B) Inhibition of ATP synthase activity in the reversed mode according to the model in (A; and Figure 3) at time 30 min after onset of cyt-c release leads to a further depolarisation of ΔΨm, from −76 to −26 mV (model with caspase-3 cleavage of complex I/II) and from −88 to −65 mV (model without caspase-3 feedback to complex I/II). (C, D) Representative single-cell microscopic imaging of HeLa cells expressing cyt-c–GFP incubated with 30 nM TMRM and 100 μM caspase inhibitor zVAD-fmk 1 h prior to exposure to 3 μM staurosporine (STS). Five μM oligomycin was added as indicated. See text for further details on heterogeneous experimental outcome. (C) Fluorescent images of cyt-c–GFP release followed by TMRM depletion, which indicates depolarisation of ΔΨm. Residual TMRM staining is lost after addition of FCCP. Scale bar, 10 μm. (D) Traces of cyt-c release as indicated by the decrease in the s.d. of average GFP pixel intensity and mitochondrial depolarisation measured by the average pixel intensity of TMRM of two cells. Cell 1 is shown in (C). (E) Fractions of the cell population with reverse, forward or no ATP synthase activity detected by oligomycin responsiveness (237 cells, n=6 experiments). (F) ATP synthase proton flux before and after cyt-c release (t=10 min) according to the model in (A), with retention of 0.1% up to 2% respiration-accessible cyt-c. Calculations indicate a stable reversal of ATP synthase for <0.7% (blue regions) and ATP synthase in forward mode (light green to yellow) for more than 1.2% remaining respiration-accessible cyt-c. Source data is available for this figure at www.nature.com/msb.

We then examined whether ATP synthase reversal stabilised ΔΨm, as was previously suggested (Rego et al, 2001; Dussmann et al, 2003a). We therefore set ATP synthase activity to zero in our single-cell model at 30 min after onset of cyt-c release. Inhibition of the reversed ATP synthase (as in Figure 4A) predicted the occurrence of a further mitochondrial depolarisation from −88 to −65 mV (−76 to −26 mV when considering complex I/II inhibition by caspase-3, Figure 4B). Owing to the lower ΔΨm and a resulting lower electrostatic barrier for proton pumping through respiratory complexes, a slight regain of respiratory flux (Supplementary Figure 6C) was also detected.
To experimentally validate the presence of reversed ATP synthase, we added 5 μM of the ATP synthase inhibitor oligomycin to HeLa cyt-c–GFP cells subsequent to cyt-c release. Indeed, oligomycin induced a further ΔΨm depolarisation within 30 min (Figure 4C and D) indicating reverse ATP synthase activity, albeit in only 20% of a total of 237 cells (n=6 experiments). Overall, 65% of cells showed no detectable reaction. Strikingly, about 15% even showed a partial repolarisation immediately after administration of oligomycin (Figure 4E) suggesting that ATP synthase was maintained in forward mode in these cells. In all cells, the protonophore carbonyl cyanide-p-trifluoromethoxyphenylhydrazone (FCCP) could fully depolarise ΔΨm to negligible levels, demonstrating that mitochondria maintained a remnant ΔΨm. In conclusion, ATP synthase reversal was found in some cells to stabilise ΔΨm by consuming ATP after cyt-c release, yet an unexpectedly wide cell-to-cell heterogeneity was observed with regard to the direction of ATP synthase activity.
Respiration-accessible cyt-c subsequent to MOMP influences activity and direction of ATP synthase
To explain this experimentally detected cell-to-cell heterogeneity in ATP synthase activity and direction, we modelled that individual cells within a population have heterogeneous levels of respiration-accessible cyt-c subsequent to cyt-c release. As an example, cells may differ by the volume fraction of mitochondria per cell, which leads to varying amounts of cyt-c staying in the vicinity of the respiratory chain after re-equilibration between IMS and cytosol. Model results suggested that cells with respiration-accessible cyt-c levels <0.7% of the initial concentration showed reversed activity (Figure 4F, marked as ‘reverse’), whereas those that retained 1.2% or higher of their original cyt-c level maintained ATP synthase activity in ATP forward mode (Figure 4F, marked as ‘forward’). The fraction of cells with levels of accessible cyt-c between 0.7 and 1.2% were calculated to have no significant ATP synthase activity (Figure 4F, marked as ‘No act’).
Availability of bioenergetic substrates determines ATP synthase activity and direction subsequent to MOMP
The above modelling results suggested that the levels of respiration-accessible cyt-c after release influence the direction of the ATP synthase. The model further would suggest that ATP synthase directionality is linked to glycolysis, as reverse ATP synthase consumes glycolytically produced ATP (Supplementary Figure 6A and B). Therefore, we next studied the dynamics of ATP synthase activity and ΔΨm in the absence of glycolysis. To this end, we performed single-cell imaging experiments on HeLa cells exposed to 3 μM STS and measured cyt-c–GFP and ΔΨm in the absence of glucose, but in the presence of sodium pyruvate as a substrate for the mitochondrial TCA. Cells were treated with oligomycin subsequent to MOMP to evaluate in which direction ATP synthase was working. Under these conditions, we observed that oligomycin led to a repolarisation of ΔΨm in 49 out of 67 cells. This indicated that ATP synthase was maintained in forward mode in the majority of cells (n=3 experiments; see Figure 5A for single-cell kinetics, Figure 5B for images). On average, ∼12% increase in TMRM signal was detected in the absence of glucose after treatment with oligomycin, whereas cells in 5.5 mM glucose media, in contrast, showed a decrease of ∼17% in the signal (Figure 5C). Setting glycolytic ATP production to zero (Jprod =0) while maintaining cytosolic ATP consumption (Jcons=−xATPC *ATP, Equation (1)), the model indeed confirmed that cells in pyruvate medium maintain ATP synthase in forward mode (Figure 5D). Under the assumption of the same cell-to-cell variability in respiration-accessible cyt-c after release as for cells in glucose medium (0–2% of initial cyt-c), reversal was calculated to occur only transiently between t=20–40 min and to occur only in cells with 0.2% or less cyt-c remaining accessible for respiration (Figure 5D versus Figure 4F). Consequently, cell populations in low or no glucose media can be expected to show a tendency to either maintain forward or to cease ATP synthase activity after cyt-c release rather than maintaining stable ATP synthase reversal.
Figure 5.
ΔΨm Dynamics induced by oligomycin after release of cyt-c are glucose dependent. (A, B) HeLa cells expressing cyt-c–GFP were incubated with 30 nM TMRM, 2 mM sodium pyruvate in medium without glucose and 100 μM zVAD-fmk 1 h prior to the addition of 3 μM STS. Five μM oligomycin was added after cyt-c release, followed by the addition of 10 μM FCCP 30 min later, as indicated by the white and black arrows, respectively. Single-cell traces and time-lapse images are representative for 49 out of 67 cells in n=3 experiments. (A) Single-cell kinetics of two representative cells. Diamonds show data from the cell shown in (B). (B) Representative fluorescent images associated with (A). Scale bar, 10 μm. (C) Difference between the average fluorescent intensity in TMRM before and after 5 μM oligomycin addition in cell populations cultured with or without glucose. Oligomycin was added at least 15 min after onset of cyt-c–GFP release. While ATP synthase reversal was prominently present for cells in medium containing 5.5 mM D-glucose as indicated by the decrease in TMRM fluorescence, the cells depleted of D-glucose showed an increase in the TMRM average pixel intensity, indicating a slight repolarisation (difference between bars is significant, independent samples t-test, variances not equal, P<0.05). (D) Modelling of ATP synthase activity dependent on time and respiration-accessible cyt-c in cells equivalent to Figure 4f, but without glycolysis. The ATP synthase reversal only briefly occurs until the cellular ATP reservoir is depleted. The ATP synthase can still produce ATP when the respiration-accessible cyt-c is >1% of its initial value and if the mitochondrial energy metabolism has enough substrate (e.g., through TCA cycle, sodium pyruvate). Source data is available for this figure at www.nature.com/msb.

High glucose induces repolarisation of ΔΨm in HeLa cells with inhibited caspases subsequent to cyt-c release
An important conclusion from our modelling above was that glycolytic ATP production determines the dynamics of ATP synthase and thereby influences post-release bioenergetics in HeLa cells. Indeed, the switch from mitochondrial to cytosolic ATP production is a hallmark of cancerogenesis (Vander Heiden et al, 2009). To further explore this mechanistically, we modelled cells after cyt-c release assuming that glycolysis maintained cellular ATP at varying levels from >80%. We first considered a scenario with 0.1% respiration-accessible cyt-c and synthase reversal. In this study, the model predicted that subsequent to cyt-c release, an elevation of cytosolic ATP levels through increased glycolysis would increase ATP synthase reversal, leading to a higher proton efflux from the matrix and in this way partially restores ΔΨm (Figure 6A). When assuming 5% respiration-accessible cyt-c after release, where ATP synthase operates in forward mode, an elevation of cytosolic ATP from 80–100% led to a partial decrease in ATP synthase in forward activity, leading to a lower proton influx into the matrix and also to a repolarisation of ΔΨm (Figure 6B). Thus, we concluded that in both scenarios ATP increase can repolarise ΔΨm either by increasing ATP synthase reversal or decreasing its forward activity. Sensitivity analysis proved both recovery mechanisms stable over a broad range of model parameter variations (Supplementary Figure 7C, D and Supplementary Text II).
Figure 6.
Glycolysis stabilises ΔΨm subsequent to cyt-c release in the absence of active caspases. (A) Modelled ΔΨm repolarisation via higher glycolytic ATP and increased ATP synthase reversal. Cells were assumed to retain 0.1% respiration-accessible cyt-c after release (which was associated with ATP synthase reversal) and different cytosolic ATP levels were considered to be established by glycolysis (calculations for ATP between 80–99%). Elevated cytosolic ATP led to higher ATP synthase reversal (left panel) causing ΔΨm increase (right panel) over almost the entire range. (B) ΔΨm Repolarisation via higher glycolytic ATP and reduced ATP consumption. Model is presented as in Figure 6a, yet retaining 5% respiration-accessible cyt-c to preserve forward ATP synthase activity after cyt-c release. ATP derived from increased glycolysis led to a reduction in ATP synthase activity (left panel) until it has ceased and thus resulted in less proton influx into the mitochondrial matrix (left panel). As a consequence, decreased proton consumption by ATP synthesis resulted in a partial ΔΨm repolarisation. (C–E) HeLa cyt-c–GFP cells incubated with 2 mM sodium pyruvate in the absence of glucose and exposed to STS in the presence of zVAD-fmk. Following cyt-c-induced mitochondrial depolarisation, 25 mM glucose was added to the medium. (C) Representative traces of a cell with cyt-c–GFP release and recovery of ΔΨm measured by TMRM. (D) Comparison of the average TMRM fluorescence in cell populations subsequent to cyt-c release before and 30 min after addition of 25 mM glucose to medium without glucose supply. The significantly higher TMRM fluorescence in the latter scenario indicates a partial ΔΨm repolarisation (196 cells out of three experiments). (E) Cyt-c–GFP and TMRM fluorescence as well as DIC channel images during depolarisation and recovery for a typical cell. Scale bar, 10 μm. Source data is available for this figure at www.nature.com/msb.

To validate these model predictions experimentally, we treated HeLa–cyt-c–GFP cells with high extracellular glucose post-cyt-c–GFP release. Using a glucose-FRET single-cell reporter (Takanaga et al, 2008), we confirmed that cytosolic levels of glucose increased when extracellular glucose was elevated from 5.5 to 25 mM, indicating a higher glucose uptake (Supplementary Figure 8A). Likewise, we detected a higher lactate production in STS-exposed HeLa cells exposed to 25 mM compared with 5.5 mM, demonstrating that the enhanced glucose uptake resulted in increased glucose utilisation (Supplementary Figure 8B).
We next investigated whether elevated glucose was capable of stabilising ΔΨm subsequent to cyt-c release. At first, we incubated HeLa–cyt-c–GFP cells in 25 mM high glucose media for 1 h and subsequently induced cyt-c release with 3 μM STS in the presence of 100 μM zVAD-fmk. The remnant ΔΨm detected subsequent to cyt-c release was significantly higher in cells incubated with 25 mM glucose than in such with 5.5 mM glucose or glucose-free medium (Supplementary Figure 8C). To investigate whether elevated glucose led to stabilisation of ΔΨm even when added subsequent to cyt-c release, we maintained HeLa–cyt-c–GFP cells in medium supplemented with sodium pyruvate in the absence of glucose and in the presence of zVAD-fmk, and induced apoptosis with 3 μM STS. After cyt-c release, we increased the glucose concentration from 0 to 25 mM in the extracellular medium and monitored the effect of this on ΔΨm. Strikingly, we observed a significant increase in TMRM fluorescence intensity from 18.6±1.6 to 46.9±1.4 (% relative to a value of 100% before cyt-c release) averaged over 196 cells from three independent experiments (Figure 6C and E), indicating a partial ΔΨm repolarisation. A similar level of repolarisation was also detected in HeLa cells that were not transfected with cyt-c GFP (Supplementary Figure 9).
We finally tested the hypothesis that the above recovery mechanism is particularly prominent in cancer cells when compared with non-transformed cells. MCF-7 breast cancer cells expressing cyt-c–GFP (Luetjens et al, 2001) and treated with STS to induce apoptosis showed a quantitatively similar response as HeLa cells subsequent to cyt-c release. Addition of 25 mM glucose to an originally glucose-free, sodium pyruvate-containing medium led to a significant (P<0.05) ∼2.5-fold increase of TMRM average pixel intensity from 19.7±1.4% after cyt-c release to 47.7±2.6% after glucose addition (n=167 cells). In contrast, non-transformed human epithelial CRL-1807 cells expressing cyt-c–GFP did not show a significant repolarisation after cyt-c release (7.0±1.6 to 10.7±2.4%, N=21 cells) when culture medium was changed from pyruvate to 25 mM glucose (see Supplementary Figure 10A, B for a typical cell response), suggesting that cancer cells are preferentially capable of undergoing glucose-induced recovery of ΔΨm.
Discussion
Systems model of bioenergetic consequences of cyt-c release
Understanding the mechanistic details of how cancer cells are able to resist apoptotic and metabolic consequences of therapeutically induced cyt-c release can provide strategies to increase treatment efficiency and reduce clinical relapse. While cancer cells are able to evade apoptosis by impairing caspase activity by loss-of-function mutations or increased expression of their antagonists, the mechanisms by which they can survive energy crisis after metabolic impairment is a matter of extensive current research (Vander Heiden et al, 2009).
Combining computational modelling with single-cell microscopy, we provided the first systems study of cellular bioenergetics subsequent to cyt-c release. We integrated approaches from metabolic engineering (Beard, 2005; Beard and Qian, 2007; Dash and Beard, 2008) and apoptosis signalling (Rehm et al, 2006; Huber et al, 2007), gradually increased model complexity, and eventually used it as a predictive tool. To this end, we remodelled bioenergetic state variables in isolated mitochondria, described ΔΨm depolarisation subsequent to cyt-c release in the presence or absence of effector caspases, and characterised ATP synthase reversal as a consumer of cytosolic ATP and a stabiliser of ΔΨm. We identified a cell-to-cell heterogeneity in the ATP synthase direction subsequent to cyt-c release, which the model explained by variations in the amount of respiration-accessible cyt-c and the cell's glycolytic capacity. Finally, our model demonstrated that an increase in cytosolic ATP production as a consequence of higher glucose levels can repolarise ΔΨm in an ATP synthase-dependent manner and independent of its direction.
By incorporating data on cyt-c release kinetics from previous single-cell studies, the model was first able to correctly capture the kinetics of ΔΨm depolarisation observed in previous single-cell experiments in HeLa cells (Waterhouse et al, 2001), MCF7 breast cancer cells (Dussmann et al, 2003a), DU145 prostate cancer cells (Dussmann et al, 2010), and primary neurons (Nicholls and Ward, 2000). Furthermore, the model allowed to quantify the impairment of respiration and ΔΨm values before and during release as well as the feedback of active caspases to ΔΨm (Ricci et al, 2003). As experimental techniques to quantify respiration and in situ mitochondrial ATP production in a single cell are still under development (Zhdanov et al, 2008; Imamura et al, 2009), systems modelling can complement existing experimental techniques to quantitatively predict cause–effect relationships and validate the plausibility of experimental results (Bentele et al, 2004; Rehm, et al, 2006; Albeck et al, 2008; Lavrik, 2010).
ATP synthase direction after cyt-c release depends on accessible cyt-c and the cell's glycolytic capacity and exhibits a wide heterogeneity within a cell population
It was suggested previously that freely diffusing cyt-c into and out of the IMS may critically determine ΔΨm subsequent to cyt-c release. We modelled that a cyt-c fraction remains accessible for respiration subsequent to release (‘respiration-accessible cyt-c’). Our model suggested that small variations in such levels significantly account for the experimentally detected population heterogeneity in the direction and amount of ATP synthase proton flux. Variations in respiration-accessible cyt-c may arise from incomplete mitochondrial release. Such incomplete release has been associated with failure of cristae remodelling in the absence of the BH3-only family member BID or the intramitochondrial protein OPA1 (Scorrano et al, 2002; Frezza et al, 2006). Even when re-equilibration between the mitochondrial IMS and the cytosol is assumed to be complete, different amounts of volume fractions of mitochondria in a cell may result in different cytosolic cyt-c levels after cyt-c release.
The amount of ATP produced by glycolysis was found to be another key determinant for ATP synthase direction subsequent to cyt-c release. Cell populations with a reduced capability to produce ATP by glycolysis were predicted to show a tendency to maintain forward or to show no ATP synthase activity, rather than reversal of ATP synthase activity. Indeed, in cells cultured in pyruvate instead of glucose, which were therefore unable to produce ATP by glycolysis, ATP synthase reversal was barely detected. We summarise the influence of respiration-accessible cyt-c and the cell's glycolytic capacity to determine ATP synthase direction within a cell population subsequent to cyt-c release in the state-space diagram in Figure 7A. Typically, individual cells of a population have a large heterogeneity in ATP synthase direction (grey boxes) with one group showing ATP synthase reversal (indicated by ‘1’), another one having ATP synthase in forward mode (‘2’), while others do not show any detectable ATP synthase activity (cells close to the dashed line). Cells in a medium with sodium pyruvate, but lacking glucose, are not able to produce ATP by glycolysis and therefore cannot meet the ATP demand needed for mitochondria to maintain stable ATP synthase reversal. All ATP that was produced before cyt-c release will be eventually used up and ATP synthase will cease or switch back to forward mode. On a population level, less and less cells will be found with reverse ATP synthase as ATP depletes (direction indicated by the black arrow).
Figure 7.

ATP synthase activity and ΔΨm recovery in cell populations subsequent to cyt-c release. (A) ATP synthase direction in dependence on respiration-accessible cyt-c and ATP generated by glycolysis. Cell populations are depicted by grey boxes with fractions of cells having reverse (indicated by ‘1’), forward (‘2’) or no detectable ATP synthase activity (cells close to the dashed line). The black arrow attached to the lower grey box indicates that cells in pyruvate-only medium cannot generate ATP and switch back to ATP synthase in forward mode upon cytosolic ATP depletion. (B) Proposed mechanism for the ΔΨm repolarisation upon glucose elevation subsequent to cyt-c release. For cells with reverse ATP synthase (‘1’), elevated ATP levels upon higher glucose availability lead to increased proton efflux from the matrix, thereby partially repolarising ΔΨm. Cell populations with ATP synthase in forward mode (denoted by ‘2’) achieve a similar partial ΔΨm repolarisation through a reduction of proton influx after elevated ATP production.
Increased glucose utilisation leads to partial ΔΨm repolarisation
Green and colleagues (Waterhouse et al, 2001) speculated that a sufficiently high cyt-c concentration in the vicinity of mitochondria may lead to repolarisation of ΔΨm and in this way may contribute to a cellular recovery from bioenergetic crisis. Our model indeed suggested that such a recovery is possible, but requires an active mechanism, in our case an increase in cytosolic ATP production by elevated rate of glycolysis.
The proposed mechanism is summarised in Figure 7B. For cells that have ATP synthase working in reverse mode after release (indicated by ‘1’, as in Figure 7A), elevated ATP production after glucose addition leads to increased proton efflux from the matrix and thus partially repolarise ΔΨm. Likewise, cell populations that can maintain ATP synthase in forward mode in low-glucose medium (denoted by ‘2’) also increase ΔΨm upon glucose addition.
By exposure of HeLa cells to high extracellular glucose levels, we were able to increase glucose uptake and its utilisation consistent with previous studies in HeLa and INS-1E cells (Li et al, 2009; Rodriguez-Enriquez et al, 2009). We confirmed that high glucose was able to stabilise (cells maintained in high-glucose media) and/or to repolarise (cells where glucose was added subsequent to release) ΔΨm consistent with above model predictions. While we confirmed this stabilisation and recovery also in MCF7 breast cancer cells, no significant effect of elevated glucose was found in non-transformed CRL-1807 cells. In conjunction with an impairment of caspase-dependent cell death observed in many human cancers, this mechanism may provide cancer cells with a competitive advantage to evade cell death induced by anticancer drugs or other stress conditions when compared with non-transformed cells.
How do cancer cells achieve an increase in glucose uptake and utilisation? Interestingly, it has been demonstrated that mitochondrial impairment and hypoxia transcriptionally elevate glucose transporter isoform GLUT1 levels (Ebert et al, 1995) in HeLa cells arguing also for a medium-term adaptation to stress situations. Elstrom et al (2004) have shown that LN5.12 murine prolymphocytic cells increase their glycolytic rate to stabilise ΔΨm when the prosurvival serine/threonine kinase AKT was induced (Elstrom et al, 2004). The same group also reported that AKT overexpression maintains a physiological ΔΨm under growth factor withdrawal (Plas et al, 2001). Other studies reported that HeLa cells increase their turnover of the glycolytic machinery through upregulation of the rate-limiting glycolytic enzymes GAPDH and phosphofructokinase (PFK1) (Chesney et al, 1999; Colell et al, 2007), or switch between OXPHOS and glycolysis upon growth medium changes (Rossignol et al, 2004).
While this study has focused on the consequences of cyt-c release on mitochondrial bioenergetics, our model can also be exploited to study the dependency of caspase activity on cytosolic pH (Matsuyama et al, 2000) and to investigate the influence of ATP levels on apoptosome formation and mitochondrial apoptosis (Zou et al, 2003). Likewise, it can be extended to include detailed mechanistic on glycolysis, the TCA cycle (Wu et al, 2007), autophagy, or production of reactive oxygen species (Atlante et al, 2000). As novel cancer therapeutics address multiple targets in apoptotic as well as metabolic pathways (Lessene et al, 2008), such cross-talk models may become an essential tool for in silico prediction of their therapeutic effectiveness both in terms of triggering programmed cell death and in overcoming bioenergetic rescue mechanisms.
Materials and methods
Cell culture and transfection
Generation and characterisation of human HeLa D98 cervical carcinoma cells or MCF7 breast cancer cells stably expressing a cyt-c–GFP fusion protein have been described (Dussmann et al, 2003a). Non-transformed CRL-1807 cells were obtained from the ATCC. HeLa cells were cultivated in RPMI, and CRL-1807 cells were grown in DMEM at 37°C in a humidified atmosphere at 5% CO2. Both media contained 10% fetal bovine serum (FBS). CRL-1807 cells were transfected with 1-μg plasmid DNA encoding for cyt-c–GFP, as described (Luetjens et al, 2001), and 3 μl/ml Lipofectamine 2000 (Invitrogen, Biosciences, Dublin, Ireland) and grown for 2 days prior to the experiment. We have previously shown that cyt-c–GFP is imported into mitochondria and coreleased with endogenous cyt-c after selective outer membrane permeabilisation with digitonin (Luetjens et al, 2001). Concomitant release of endogenous cyt-c and cyt-c–GFP from mitochondria during apoptosis has also been demonstrated in other reports (Goldstein et al, 2000; Munoz-Pinedo et al, 2006). Cell culture ingredients were obtained from Sigma-Aldrich, Dublin, Ireland.
Live cell imaging
Cyt-c–GFP release was monitored by time-lapse confocal microscopy, and mitochondrial membrane potential (ΔΨm) was simultaneously determined by the distribution of the monovalent cationic dye TMRM (MobiTec, Göttingen, Germany) using an inverted confocal laser scanning microscope (Fluoview 200, Olympus, Hamburg, Germany), as described previously (Dussmann et al, 2003a; Rehm et al, 2003). Alternatively, confocal microscopes equipped with a 488 nm argon laser and a 543 nm HeNe Laser, a 488/543 dichroic beam splitter, and a 63 × 1.4 NA oil immersion objective (LSM 510 and 710, Carl Zeiss, Jena, Germany) were used. On the LSM 510, fluorescence emission was split with a 540 nm secondary beam splitter and detected after transmitting a 505–550 nm band-pass filter for GFP or a 560 nm long-pass emission filter for TMRM. On the LSM 710, the emission beam path was adjusted so that GFP was detected in the range of 495–550 nm and TMRM in the range of 565–750 nm. Fluorescence was detected from a 1-μm thick confocal section (full width half maximum). For time-lapse imaging, culture dishes were mounted onto the microscope stage that was equipped with a mini incubator and objective heater (Pecon, Erbach, Germany). In control experiments, constant fluorescence values for cyt-c–GFP and TMRM as well as a constant rate of cell divisions were detected over a period of 24 h. For induction of apoptosis, cells were incubated with 3-μM STS (Axxora, Alpha Technologies, Blessington, Ireland) on the stage after 1 h of equilibration with 30 nM TMRM. Caspase activation was inhibited by 1 h preincubation with 100 μM zVAD-fmk (Bachem, Heidelberg, Germany). During the measurements, cells were treated with oligomycin and FCCP (all from Sigma-Aldrich, Dublin, Ireland) as indicated. Where required, glucose-free RPMI medium was enriched with 10% FBS, 15 mM HEPES (pH 7.4), and 2 mM sodium pyruvate. D-Glucose was added at concentrations of 5.5 or 25 mM added during time-lapse imaging at times as indicated. In order to investigate the effect of enhanced glucose availability after MOMP, glucose was added when at least 75% of cells had released cyt-c–GFP. In order to prevent evaporation, the media was covered with embryo-tested paraffin oil. Images were analysed using Metamorph image processing software (Metamorph 7.1–7.6, Molecular Devices, Wokingham, UK). The distribution of cyt-c–GFP was calculated using the s.d. of the average pixel intensity as described previously (Dussmann et al, 2003a), and decreases in the s.d. value indicate the redistribution of GFP from punctuate (mitochondrial) to homogeneous (cytoplasm and nucleus) patterns. The average pixel intensity of the TMRM signal represents the mitochondrial membrane potential as described previously (Ward et al, 2000). Cells from three to six separate experiments per condition were analysed, and parameters were compared using Student's t-test for paired samples or independent samples with P<0.05 considered to be significant (SPSS 15, LEAD Technologies, Chicago, USA).
Imaging of intracellular glucose concentration
HeLa cells were transfected with IMS–RFP, a sensor of MOMP, (Albeck et al, 2008) and a glucose-sensitive CFP-Citrine FRET probe FLII12Pglu-700uDelta6 (Takanaga et al, 2008, Addgene plasmid 17866), and were used for time-lapse imaging on the LSM510 Meta confocal microscope. IMS–RFP release was observed with settings as used for TMRM. The 405 laser and the 405/514 multichroic beam splitter was used for CFP excitation, CFP emission and FRET channel were measured using the 470–500 nm band-pass filter and the 505–550 nm band-pass filter, respectively, separated by a secondary dichroic beam splitter at 515 nm. Citrine fluorescence was detected from optical slices of 3 μm thickness at settings used for GFP. FRET/CFP ratio images were following background subtraction, and an increase in average pixel intensity indicated an increase in the intracellular glucose concentration. Acceptor photobleaching was negligible at the acquisition settings used. Image processing was performed using MetaMorph software as described above. Cells were incubated with growth medium supplemented with 15 mM HEPES, 2 mM sodium pyruvate, 30 nM TMRM, 100 μM caspase inhibitor zVAD-fmk, and 5.5 mM D-glucose. Release of IMS–RFP was induced by addition of 3 μM STS. A quantity of 20 mM D-glucose was added at times as indicated in the figures.
Lactate assay
HeLa cells cultured in 96-well plates were treated with STS and zVAD-fmk as above in the presence of 0, 5.5 or 25 mM D-glucose, as indicated. After 8 h, extracellular media were removed and stored at −80°C. A 10 μl sample was diluted 20-fold and assayed with a Lactate Assay Fluorometric Kit (ab65330, Abcam plc, Cambridge, UK), as per manufacturer's protocol in a BIO TEK Synergy HT fluorometer (Winooski, Vermont, USA). Fluorescence values were calibrated to a standard curve generated using lactate standard supplied with the kit.
Computational model of mitochondrial bioenergetics
We established a model to study the temporal behaviour of the bioenergetics state variables ΔΨm, ADP/ATP ratio, respiratory flux and ATP synthase activity (Figure 2). We focused on flux through the respiratory chain and ion transporters across the mitochondrial inner membrane. Fluxes are specified by Arabic numbers and are described here in sequential order. Respiration was driven by disequilibrium of the NADH/NAD ratio (as is generated by the TCA cycle). Electrochemical flux through mitochondrial complexes I/II, III and IV in IMS, ATP synthesis, adenine nucleotide translocase, constitutive proton leaks, proton–phosphate cotransport, K+/proton-exchanger and ATP transmembrane transport were adapted from the literature (Korzeniewski and Brown, 1998; Korzeniewski and Zoladz, 2003; Beard, 2005; Beard and Qian, 2007; Dash and Beard, 2008). Unlike above reports, we also calculated all state variables for non-equilibrium states and as a function of time.
We calibrated this part of the model to results obtained from isolated mitochondria in different supporting media. These included a ‘buffered’ medium with a constant external ATP/ADP ratio of 3:1 (i.e., 25% ADP deficiency) to model mitochondria in ‘state-3’, a medium with 100% ATP and 0% ADP to model mitochondria in ‘state-4’, and one where an initial ATP deficiency of 25% was replenished by mitochondrial ATP production to model a state-3 to state-4 ‘transition’. As these scenarios have been extensively studied in the literature (Nicholls and Ferguson, 1992; Nicholls and Budd, 2000; Ward et al, 2000; Kushnareva et al, 2002), we were able to fix unknown model parameters (input NADH/NAD disequilibrium, complexes I–IV, ATP synthase and ATP transferase rates of activity) by Monte-Carlo screening to render the experimental situation (see Supplementary Text 1 for methods and results).
Modelling of cytosolic ATP, cyt-c release and caspase-mediated complex I/II deactivation
We extended the above calibrated model of mitochondrial bioenergetics and included cytosolic processes, assuming a mitochondrial volume fraction of 1% in the cell (Poppe et al, 2001). We first implemented processes for cytosolic ATP turnover (ATP production and consumption in the cytosol). Cytosolic ATP production was modelled (flux Jprod, glycolysis) by increasing the ATP concentration in proportional to the amount of available ADP (ADP → ATP, Jprod∼ADP). This was balanced by ATP-consuming processes (flux Jcons), such as Na+/K+–ATPase activity and protein synthesis, considered to be dependent on the level of available ATP (ATP → ADP, Jcons∼ ATP). Superposition of both effects led to a flux
KATDP equals the cytosolic ATP/ADP ratio at equilibrium in a cell when mitochondria are disregarded. It was set to 3 (ATP/ADP=3:1, i.e., 75% ATP; AMP neglected) to mimic cells under normal glucose and set to 0 for a pyruvate-only medium (consistent to Jprod=0). To model variable rates of glycolysis as in Figure 6, we directly fixed ATP and ADP. Combining the cytosolic (Equation (1).) and mitochondrial ATP production, we adapted the flux strength xATDP to 0.1980/s to yield an equilibrium ATP/ADP ratio of 20:1 (95% ATP), as experimentally observed in HeLa cells with intact mitochondria (Evans and Kaplan, 1977).
Cyt-c release was modelled to start at the onset time trelease=10 min after assuming cells in equilibrium. An exponential decay with half-release time t1/2_cyt_c=1.5 min was remodelled from experiments performed by our group and others (Goldstein et al, 2000; Luetjens et al, 2001; Waterhouse et al, 2001). This is equivalent to assuming the fluxes
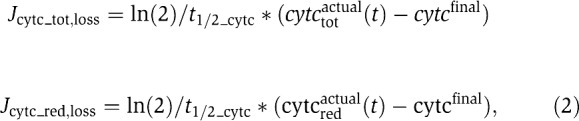 |
which describe loss of total and reduced cyt-c (cytctotactual, cytcredactual) and lead to a depletion of complex IV activity. We assumed a final cyt-c concentration cyt-cfinal to be accessible for respiratory complexes after the release. This reflected the fact that even under unimpaired cyt-c release, the cyt-c concentration in the mitochondrial IMS does not drop to zero, but re-equilibrates between IMS and cytosol. Assuming the IMS as 10% of the mitochondrial volume and a volume fraction of 1% mitochondria in a cell (Dussmann et al, 2003a), complete cyt-c release was therefore considered to lead to a final ‘accessible’ cyt-c concentration that is 0.1% of its initial value. A different ratio was used, when impaired cyt-c release was considered (Figures 4F, 5D and 6B).
Caspase-3 has been reported to deactivate complex I and II of the respiratory chain (Ricci et al, 2003). We modelled this deactivation by the enzymatic reaction Qactive+casp3(t) → Qinactive. This assumes that active complex Qactive gets cleaved to its inactive form Qinactive by the amount of caspase-3 at a certain time t (casp3(t)), subsequent to cyt-c release. This leads to the following loss-of-function fluxes.
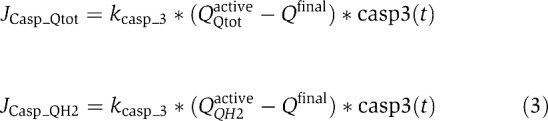 |
which modelled a disruption of the electron transfer from complex I/II to complex III.
Total ubiquinone fractions QQtotactive and reduced ubiquinone fractions QQH2active were treated independently as they represented separate degrees of freedom. A remnant fraction that remains active (Qfinal) was assumed as 1% of the initial ubiquinone concentration. Furthermore, kcasp-3 described the caspase-3 enzymatic cleavage rate (set to 12 μM/s; Stennicke et al, 2000)). The activation profile of free active caspase-3 (casp3(t)) over time was calculated using a network of ODEs, as described previously by our group (Rehm et al, 2006). Briefly, concomitant cyt-c and Smac release subsequent to MOMP led to apoptosome formation, which induced a cascade of caspase-9 and caspase-3 activation.
Model code and data
The model was constructed by a system of ODEs that describe temporal changes of metabolites, ions and biochemical parameters by biochemical fluxes. The model code was implemented in MATLAB (the Mathworks, UK) and is given in the Supplementary Dataset I. Code use is described in Supplementary Text I. State variables of the model are given in Supplementary Table I. Variables to control the code for different biological situations are given in Supplementary Table II. The ODE system is depicted in Supplementary Table III. The biochemical fluxes that are used to construct this ODE system are biologically described in Supplementary Table IV and mathematically detailed in Supplementary Table V. Biological constraints such as moiety conservation are given in Supplementary Table VI. Model parameters used in the study and discussed in the sensitivity analysis (Supplementary Text II) are given in Supplementary Table VII, while physical and chemical constants together with ion concentrations that are used in the model are described in Supplementary Table VIII. Supplementary Table IX finally describes the reaction network used for calculating caspase-3 activation over time.
Supplementary Material
Supplementary Tables SI–IX, Supplementary Figures S1–10
Code Supplement MATLAB
Acknowledgments
We thank Niamh Connolly for critical review of the manuscript and discussions, Dr Dan Beard for discussions and code advice, Dr Petronela Weisova for discussions, and Drs J Albeck, P Sorger and WB Frommer for the kind supply of materials. This research was supported by Science Foundation Ireland (grant 08/IN.1/B1949 to JHMP and HJH), by the National Biophotonics and Imaging Platform, the EU Framework Programme 7 (APO-SYS) and the Irish Health Research Board (APOCOLON; TRA/2007/26).
Author contributions: HJH: designed the study, designed and wrote the code, performed the modelling and data interpretation, wrote the paper. HD: designed the study, designed and performed the experiments, performed the data analysis, wrote the paper, SMK: performed experiments, contributed to paper writing, MR: contributed to analytical discussions, experimental design and paper writing, JHMP: directed and designed the study, led the data analysis, wrote the paper.
Footnotes
The authors declare that they have no conflict of interest.
References
- Albeck JG, Burke JM, Aldridge BB, Zhang M, Lauffenburger DA, Sorger PK (2008) Quantitative analysis of pathways controlling extrinsic apoptosis in single cells. Mol Cell 30: 11–25 [DOI] [PMC free article] [PubMed] [Google Scholar]
- Atlante A, Calissano P, Bobba A, Azzariti A, Marra E, Passarella S (2000) Cytochrome c is released from mitochondria in a reactive oxygen species (ROS)-dependent fashion and can operate as a ROS scavenger and as a respiratory substrate in cerebellar neurons undergoing excitotoxic death. J Biol Chem 275: 37159–37166 [DOI] [PubMed] [Google Scholar]
- Beard DA (2005) A biophysical model of the mitochondrial respiratory system and oxidative phosphorylation. PLoS Comput Biol 1: e36. [DOI] [PMC free article] [PubMed] [Google Scholar]
- Beard DA, Qian H (2007) Relationship between thermodynamic driving force and one-way fluxes in reversible processes. PLoS One 2: e144. [DOI] [PMC free article] [PubMed] [Google Scholar]
- Bentele M, Lavrik I, Ulrich M, Stosser S, Heermann DW, Kalthoff H, Krammer PH, Eils R (2004) Mathematical modeling reveals threshold mechanism in CD95-induced apoptosis. J Cell Biol 166: 839–851 [DOI] [PMC free article] [PubMed] [Google Scholar]
- Chesney J, Mitchell R, Benigni F, Bacher M, Spiegel L, Al-Abed Y, Han JH, Metz C, Bucala R (1999) An inducible gene product for 6-phosphofructo-2-kinase with an AU-rich instability element: role in tumor cell glycolysis and the Warburg effect. Proc Natl Acad Sci USA 96: 3047–3052 [DOI] [PMC free article] [PubMed] [Google Scholar]
- Chinopoulos C, Adam-Vizi V (2009) Mitochondria as ATP consumers in cellular pathology. Biochim Biophys Acta 1802: 221–227 [DOI] [PubMed] [Google Scholar]
- Colell A, Ricci JE, Tait S, Milasta S, Maurer U, Bouchier-Hayes L, Fitzgerald P, Guio-Carrion A, Waterhouse NJ, Li CW, Mari B, Barbry P, Newmeyer DD, Beere HM, Green DR (2007) GAPDH and autophagy preserve survival after apoptotic cytochrome c release in the absence of caspase activation. Cell 129: 983–997 [DOI] [PubMed] [Google Scholar]
- Dash RK, Beard DA (2008) Analysis of cardiac mitochondrial Na+-Ca2+ exchanger kinetics with a biophysical model of mitochondrial Ca2+ handling suggests a 3:1 stoichiometry. J Physiol 586: 3267–3285 [DOI] [PMC free article] [PubMed] [Google Scholar]
- Deveraux QL, Reed JC (1999) IAP family proteins—suppressors of apoptosis. Genes Dev 13: 239–252 [DOI] [PubMed] [Google Scholar]
- Dussmann H, Kogel D, Rehm M, Prehn JH (2003a) Mitochondrial membrane permeabilization and superoxide production during apoptosis. A single-cell analysis. J Biol Chem 278: 12645–12649 [DOI] [PubMed] [Google Scholar]
- Dussmann H, Rehm M, Kogel D, Prehn JH (2003b) Outer mitochondrial membrane permeabilization during apoptosis triggers caspase-independent mitochondrial and caspase-dependent plasma membrane potential depolarization: a single-cell analysis. J Cell Sci 116: 525–536 [DOI] [PubMed] [Google Scholar]
- Dussmann H, Rehm M, Concannon CG, Anguissola S, Wurstle M, Kacmar S, Voller P, Huber HJ, Prehn JH (2010) Single-cell quantification of Bax activation and mathematical modelling suggest pore formation on minimal mitochondrial Bax accumulation. Cell Death Differ 17: 278–290 [DOI] [PubMed] [Google Scholar]
- Ebert BL, Firth JD, Ratcliffe PJ (1995) Hypoxia and mitochondrial inhibitors regulate expression of glucose transporter-1 via distinct Cis-acting sequences. J Biol Chem 270: 29083–29089 [DOI] [PubMed] [Google Scholar]
- Elstrom RL, Bauer DE, Buzzai M, Karnauskas R, Harris MH, Plas DR, Zhuang H, Cinalli RM, Alavi A, Rudin CM, Thompson CB (2004) Akt stimulates aerobic glycolysis in cancer cells. Cancer Res 64: 3892–3899 [DOI] [PubMed] [Google Scholar]
- Evans FE, Kaplan NO (1977) 31P nuclear magnetic resonance studies of HeLa cells. Proc Natl Acad Sci USA 74: 4909–4913 [DOI] [PMC free article] [PubMed] [Google Scholar]
- Frezza C, Cipolat S, Martins de Brito O, Micaroni M, Beznoussenko GV, Rudka T, Bartoli D, Polishuck RS, Danial NN, De Strooper B, Scorrano L (2006) OPA1 controls apoptotic cristae remodeling independently from mitochondrial fusion. Cell 126: 177–189 [DOI] [PubMed] [Google Scholar]
- Garedew A, Henderson SO, Moncada S (2010) Activated macrophages utilize glycolytic ATP to maintain mitochondrial membrane potential and prevent apoptotic cell death. Cell Death Differ 17: 1540–1550 [DOI] [PubMed] [Google Scholar]
- Goldstein JC, Waterhouse NJ, Juin P, Evan GI, Green DR (2000) The coordinate release of cytochrome c during apoptosis is rapid, complete and kinetically invariant. Nat Cell Biol 2: 156–162 [DOI] [PubMed] [Google Scholar]
- Green DR, Kroemer G (2004) The pathophysiology of mitochondrial cell death. Science 305: 626–629 [DOI] [PubMed] [Google Scholar]
- Gutenkunst RN, Waterfall JJ, Casey FP, Brown KS, Myers CR, Sethna JP (2007) Universally sloppy parameter sensitivities in systems biology models. PLoS Comput Biol 3: 1871–1878 [DOI] [PMC free article] [PubMed] [Google Scholar]
- Huber HJ, Laussmann MA, Prehn JH, Rehm M (2010) Diffusion is capable of translating anisotropic apoptosis initiation into a homogeneous execution of cell death. BMC Syst Biol 4: 9. [DOI] [PMC free article] [PubMed] [Google Scholar]
- Huber HJ, Rehm M, Plchut M, Dussmann H, Prehn JH (2007) APOPTO-CELL--a simulation tool and interactive database for analyzing cellular susceptibility to apoptosis. Bioinformatics 23: 648–650 [DOI] [PubMed] [Google Scholar]
- Imamura H, Nhat KP, Togawa H, Saito K, Iino R, Kato-Yamada Y, Nagai T, Noji H (2009) Visualization of ATP levels inside single living cells with fluorescence resonance energy transfer-based genetically encoded indicators. Proc Natl Acad Sci USA 106: 15651–15656 [DOI] [PMC free article] [PubMed] [Google Scholar]
- Jurgensmeier JM, Xie Z, Deveraux Q, Ellerby L, Bredesen D, Reed JC (1998) Bax directly induces release of cytochrome c from isolated mitochondria. Proc Natl Acad Sci USA 95: 4997–5002 [DOI] [PMC free article] [PubMed] [Google Scholar]
- Kluck RM, Bossy-Wetzel E, Green DR, Newmeyer DD (1997) The release of cytochrome c from mitochondria: a primary site for Bcl-2 regulation of apoptosis. Science 275: 1132–1136 [DOI] [PubMed] [Google Scholar]
- Korzeniewski B, Brown GC (1998) Quantification of the relative contribution of parallel pathways to signal transfer: application to cellular energy transduction. Biophys Chem 75: 73–80 [DOI] [PubMed] [Google Scholar]
- Korzeniewski B, Zoladz JA (2003) Training-induced adaptation of oxidative phosphorylation in skeletal muscles. Biochem J 374: 37–40 [DOI] [PMC free article] [PubMed] [Google Scholar]
- Kushnareva Y, Murphy AN, Andreyev A (2002) Complex I-mediated reactive oxygen species generation: modulation by cytochrome c and NAD(P)+ oxidation-reduction state. Biochem J 368: 545–553 [DOI] [PMC free article] [PubMed] [Google Scholar]
- Kushnareva YE, Polster BM, Sokolove PM, Kinnally KW, Fiskum G (2001) Mitochondrial precursor signal peptide induces a unique permeability transition and release of cytochrome c from liver and brain mitochondria. Arch Biochem Biophys 386: 251–260 [DOI] [PubMed] [Google Scholar]
- Lavrik IN (2010) Systems biology of apoptosis signaling networks. Curr Opin Biotechnol 21: 551–555 [DOI] [PubMed] [Google Scholar]
- Lessene G, Czabotar PE, Colman PM (2008) BCL-2 family antagonists for cancer therapy. Nat Rev Drug Discov 7: 989–1000 [DOI] [PubMed] [Google Scholar]
- Li N, Brun T, Cnop M, Cunha DA, Eizirik DL, Maechler P (2009) Transient oxidative stress damages mitochondrial machinery inducing persistent beta-cell dysfunction. J Biol Chem 284: 23602–23612 [DOI] [PMC free article] [PubMed] [Google Scholar]
- Liu X, Kim CN, Yang J, Jemmerson R, Wang X (1996) Induction of apoptotic program in cell-free extracts: requirement for dATP and cytochrome c. Cell 86: 147–157 [DOI] [PubMed] [Google Scholar]
- Luetjens CM, Kogel D, Reimertz C, Dussmann H, Renz A, Schulze-Osthoff K, Nieminen AL, Poppe M, Prehn JH (2001) Multiple kinetics of mitochondrial cytochrome c release in drug-induced apoptosis. Mol Pharmacol 60: 1008–1019 [DOI] [PubMed] [Google Scholar]
- Matsuyama S, Llopis J, Deveraux QL, Tsien RY, Reed JC (2000) Changes in intramitochondrial and cytosolic pH: early events that modulate caspase activation during apoptosis. Nat Cell Biol 2: 318–325 [DOI] [PubMed] [Google Scholar]
- Mitchell P (1961) Coupling of phosphorylation to electron and hydrogen transfer by a chemi-osmotic type of mechanism. Nature 191: 144–148 [DOI] [PubMed] [Google Scholar]
- Munoz-Pinedo C, Guio-Carrion A, Goldstein JC, Fitzgerald P, Newmeyer DD, Green DR (2006) Different mitochondrial intermembrane space proteins are released during apoptosis in a manner that is coordinately initiated but can vary in duration. Proc Natl Acad Sci USA 103: 11573–11578 [DOI] [PMC free article] [PubMed] [Google Scholar]
- Nicholls DG (1974) Hamster brown-adipose-tissue mitochondria. The control of respiration and the proton electrochemical potential gradient by possible physiological effectors of the proton conductance of the inner membrane. Eur J Biochem 49: 573–583 [DOI] [PubMed] [Google Scholar]
- Nicholls DG (1977) The effective proton conductance of the inner membrane of mitochondria from brown adipose tissue. Dependency on proton electrochemical potential gradient. Eur J Biochem 77: 349–356 [DOI] [PubMed] [Google Scholar]
- Nicholls DG, Budd SL (2000) Mitochondria and neuronal survival. Physiol Rev 80: 315–360 [DOI] [PubMed] [Google Scholar]
- Nicholls DG, Ferguson S (1992) Bioenergetics 2, 2nd edn. New York: Academic Press. ISBN-13:978-0125181242 [Google Scholar]
- Nicholls DG, Ward MW (2000) Mitochondrial membrane potential and neuronal glutamate excitotoxicity: mortality and millivolts. Trends Neurosci 23: 166–174 [DOI] [PubMed] [Google Scholar]
- Pfaff E, Heldt HW, Klingenberg M (1969) Adenine nucleotide translocation of mitochondria. Kinetics of the adenine nucleotide exchange. Eur J Biochem 10: 484–493 [DOI] [PubMed] [Google Scholar]
- Plas DR, Talapatra S, Edinger AL, Rathmell JC, Thompson CB (2001) Akt and Bcl-xL promote growth factor-independent survival through distinct effects on mitochondrial physiology. J Biol Chem 276: 12041–12048 [DOI] [PubMed] [Google Scholar]
- Poppe M, Reimertz C, Dussmann H, Krohn AJ, Luetjens CM, Bockelmann D, Nieminen AL, Kogel D, Prehn JH (2001) Dissipation of potassium and proton gradients inhibits mitochondrial hyperpolarization and cytochrome c release during neural apoptosis. J Neurosci 21: 4551–4563 [DOI] [PMC free article] [PubMed] [Google Scholar]
- Rego AC, Vesce S, Nicholls DG (2001) The mechanism of mitochondrial membrane potential retention following release of cytochrome c in apoptotic GT1-7 neural cells. Cell Death Differ 8: 995–1003 [DOI] [PubMed] [Google Scholar]
- Rehm M, Dussmann H, Prehn JH (2003) Real-time single cell analysis of Smac/DIABLO release during apoptosis. J Cell Biol 162: 1031–1043 [DOI] [PMC free article] [PubMed] [Google Scholar]
- Rehm M, Huber HJ, Dussmann H, Prehn JH (2006) Systems analysis of effector caspase activation and its control by X-linked inhibitor of apoptosis protein. EMBO J 25: 4338–4349 [DOI] [PMC free article] [PubMed] [Google Scholar]
- Ricci JE, Gottlieb RA, Green DR (2003) Caspase-mediated loss of mitochondrial function and generation of reactive oxygen species during apoptosis. J Cell Biol 160: 65–75 [DOI] [PMC free article] [PubMed] [Google Scholar]
- Rodriguez-Enriquez S, Marin-Hernandez A, Gallardo-Perez JC, Moreno-Sanchez R (2009) Kinetics of transport and phosphorylation of glucose in cancer cells. J Cell Physiol 221: 552–559 [DOI] [PubMed] [Google Scholar]
- Rossignol R, Gilkerson R, Aggeler R, Yamagata K, Remington SJ, Capaldi RA (2004) Energy substrate modulates mitochondrial structure and oxidative capacity in cancer cells. Cancer Res 64: 985–993 [DOI] [PubMed] [Google Scholar]
- Scorrano L, Ashiya M, Buttle K, Weiler S, Oakes SA, Mannella CA, Korsmeyer SJ (2002) A distinct pathway remodels mitochondrial cristae and mobilizes cytochrome c during apoptosis. Dev Cell 2: 55–67 [DOI] [PubMed] [Google Scholar]
- Slee EA, Harte MT, Kluck RM, Wolf BB, Casiano CA, Newmeyer DD, Wang HG, Reed JC, Nicholson DW, Alnemri ES, Green DR, Martin SJ (1999) Ordering the cytochrome c-initiated caspase cascade: hierarchical activation of caspases-2, -3, -6, -7, -8, and -10 in a caspase-9-dependent manner. J Cell Biol 144: 281–292 [DOI] [PMC free article] [PubMed] [Google Scholar]
- Srinivasula SM, Ahmad M, Fernandes-Alnemri T, Alnemri ES (1998) Autoactivation of procaspase-9 by Apaf-1-mediated oligomerization. Mol Cell 1: 949–957 [DOI] [PubMed] [Google Scholar]
- Stennicke HR, Renatus M, Meldal M, Salvesen GS (2000) Internally quenched fluorescent peptide substrates disclose the subsite preferences of human caspases 1, 3, 6, 7 and 8. Biochem J 350 (Part 2): 563–568 [PMC free article] [PubMed] [Google Scholar]
- Takanaga H, Chaudhuri B, Frommer WB (2008) GLUT1 and GLUT9 as major contributors to glucose influx in HepG2 cells identified by a high sensitivity intramolecular FRET glucose sensor. Biochim Biophys Acta 1778: 1091–1099 [DOI] [PMC free article] [PubMed] [Google Scholar]
- Vander Heiden M, Cantley L, Thomson C (2009) Understanding the Warburg effect: the metabolic requirements of cell proliferation. Science 324: 1029–1033 [DOI] [PMC free article] [PubMed] [Google Scholar]
- Ward MW, Rego AC, Frenguelli BG, Nicholls DG (2000) Mitochondrial membrane potential and glutamate excitotoxicity in cultured cerebellar granule cells. J Neurosci 20: 7208–7219 [DOI] [PMC free article] [PubMed] [Google Scholar]
- Waterhouse NJ, Goldstein JC, von Ahsen O, Schuler M, Newmeyer DD, Green DR (2001) Cytochrome c maintains mitochondrial transmembrane potential and ATP generation after outer mitochondrial membrane permeabilization during the apoptotic process. J Cell Biol 153: 319–328 [DOI] [PMC free article] [PubMed] [Google Scholar]
- Wu F, Yang F, Vinnakota KC, Bea1rd DA (2007) Computer modeling of mitochondrial tricarboxylic acid cycle, oxidative phosphorylation, metabolite transport, and electrophysiology. J Biol Chem 282: 24525–24537 [DOI] [PubMed] [Google Scholar]
- Zhdanov AV, Ward MW, Prehn JH, Papkovsky DB (2008) Dynamics of intracellular oxygen in PC12 Cells upon stimulation of neurotransmission. J Biol Chem 283: 5650–5661 [DOI] [PubMed] [Google Scholar]
- Zou H, Yang R, Hao J, Wang J, Sun C, Fesik SW, Wu JC, Tomaselli KJ, Armstrong RC (2003) Regulation of the Apaf-1/caspase-9 apoptosome by caspase-3 and XIAP. J Biol Chem 278: 8091–8098 [DOI] [PubMed] [Google Scholar]
Associated Data
This section collects any data citations, data availability statements, or supplementary materials included in this article.
Supplementary Materials
Supplementary Tables SI–IX, Supplementary Figures S1–10
Code Supplement MATLAB