Abstract
The actin filament has clear polarity where one end, the pointed end, has a much slower polymerization and depolymerization rate than the other end, the barbed end. This intrinsic difference of the ends significantly affects all actin dynamics in the cell, which has central roles in a wide spectrum of cellular functions. The detailed mechanism underlying this difference has remained elusive, because high-resolution structures of the filament ends have not been available. Here, we present the structure of the actin filament pointed end obtained using a single particle analysis of cryo-electron micrographs. We determined that the terminal pointed end subunit is tilted towards the penultimate subunit, allowing specific and extra loop-to-loop inter-strand contacts between the two end subunits, which is not possible in other parts of the filament. These specific contacts prevent the end subunit from dissociating. For elongation, the loop-to-loop contacts also inhibit the incorporation of another actin monomer at the pointed end. These observations are likely to account for the less dynamic pointed end.
Keywords: actin filament, cryo-electron microscopy, cytoskeleton, motor protein, single particle analysis
Introduction
Actin is the most abundant cytoskeletal protein in eukaryotic cells and forms a double-stranded helical filament (Oda et al, 2009). It is known that one actin molecule tightly binds one ATP or ADP, and that transition from the monomeric state (G-actin state) to the fibrous state (F-actin state) activates the ATPase of actin (Pollard and Weeds, 1984; Iwasa et al, 2008). Actin continuously cycles through the processes of polymerization and depolymerization. This dynamic process is ubiquitous in eukaryotic cells, which has important functional roles that have been intensively investigated in medicine, biology and agricultural sciences. For instance, actin polymerization and depolymerization are involved: in the plasticity of memory (dendritic spine structure) (Hotulainen and Hoogenraad, 2010); in the stereocillia that are crucial in the transduction of sound or motion into the electrical signals (Manor and Kachar, 2008); in cell movement (Lai et al, 2008), including infiltration and metastasis of cancer cells (Condeelis et al, 2001); and in the extension of the pollen tube (Chen et al, 2009).
Actin filaments contain two ends, termed the ‘pointed end’ and ‘barbed end’, that each has distinct properties. The polarity of the actin filament controls the actin dynamics in the cell where elongation of the filament by polymerization occurs at the barbed end, and shortening by depolymerization occurs at the pointed end. Interestingly, in vitro, the actin filament without any binding proteins elongate at the barbed end and shortens at the pointed end in the steady state with ATP and magnesium ions, inducing a so-called ‘treadmilling’ movement (Wegner, 1976; Korn et al, 1987; Bugyi and Carlier, 2010). This suggests that the evolutionary origin of the direction of polymerization and depolymerization in the cell is an intrinsic property of the actin filament.
To understand actin dynamics that occur within the cell, it is essential to understand the intrinsic dynamics at the two ends of the actin filament, as well as to understand how the regulatory proteins change these intrinsic dynamics. The most prominent difference between the two ends of the actin filament that occurs during these dynamics is that the polymerization rate and the depolymerization rate at the pointed end are much slower than at the barbed end. This largely affects all actin dynamics and likely explains why the barbed end is used for rapid polymerization in the cell. The mechanism underlying this difference, however, is unclear, despite intensive studies to measure actin dynamics at both ends (Coue and Korn, 1985; Carlier et al, 1986; Pollard, 1986; Fujiwara et al, 2007), likely due to the lack of available high-resolution structures. In the present study, to gain insight into why the pointed end is less dynamic than the barbed end, we performed electron microscopic studies of the pointed end of the actin filament.
Results
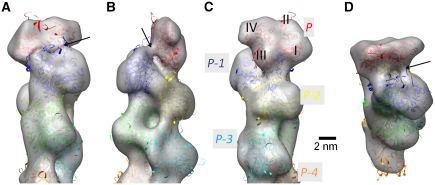
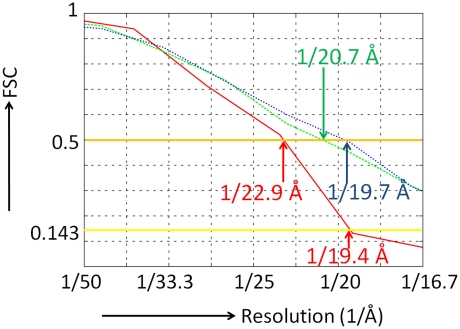
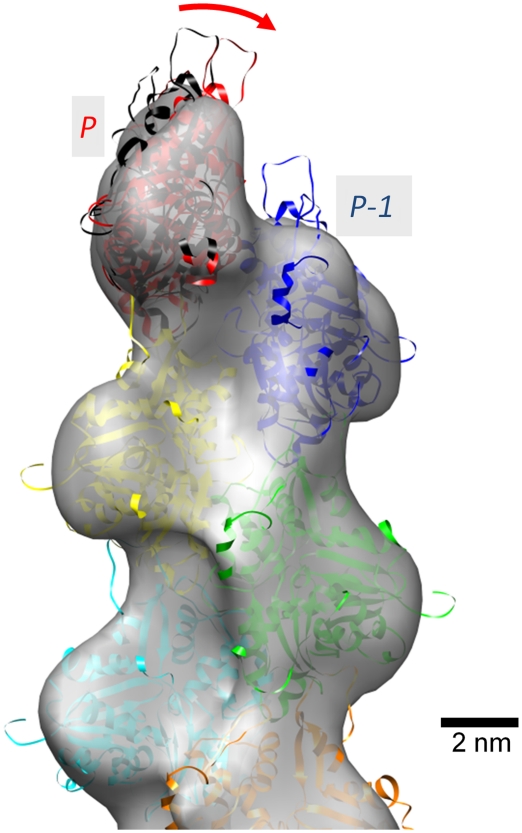
The three-dimensional (3D) structure of the pointed end of the actin filament was determined (Figure 1) from cryo-electron micrographs using single particle analysis procedures that have been developed in-house (Narita et al, 2006; Narita and Maéda, 2007). The resolution of the density map was determined as 22.9 Å with a threshold of Fourier Shell Correlation (FSC; van Heel, 1987)=0.5 (Figure 2) or 19.4 Å with another threshold of FSC=0.143 (Rosenthal and Henderson, 2003). To our knowledge, this is the first elucidation of the structure of the actin filament free end. In the density map (Figure 1), individual masses were clearly recognized as actin subunits with subdomain structures (Kabsch et al, 1990) up to the end of the filament (Figure 1C). In this study, each subunit was referred to as P, P-1, P-2, etc. from the subunit at the pointed end. The atomic model of the F-actin subunit (Oda et al, 2009) was unambiguously fitted to each mass as a rigid body. These results showed that all the subunits followed the canonical helical symmetry of the actin filament (Oda et al, 2009), except for the end subunit P that deviates significantly. The subunit P was determined to be tilted towards P-1 by ∼12° (Figure 3; Supplementary Figure S2), implying that the two subunits interact with each other more tightly than the canonical inter-strand contacts in the actin filament (Oda et al, 2009). Moreover, a bridge-like connection was observed between the subunit P-1 and the subunit P on the complementary strand, which is presumably formed between the DNase I binding loop (Kabsch et al, 1990) of P-1 and the hydrophobic plug (Holmes et al, 1990) of P (Figure 1A, B and D).
Figure 1.
The three-dimensional electron density map of the actin filament pointed end was obtained by cryo-electron microscopy at a contour level that envelops 100% of the calculated volume. (A−C) The viewing angle around the filament axis is 0, 90 or 180°, respectively. (D) As in (A), with the filament axis tilted by 60° towards the viewer. In (C), each actin subunit is labeled as P, P-1, P-2… starting from the subunit at the pointed end. Also labeled are individual subdomains (I−IV), which are clearly distinguished in each subunit up to the pointed end. The ribbon-represented atomic models, coloured separately for each subunit, superposed on the EM map in (A−D) are the final model after the molecular dynamics simulation. Black arrows in (A, B and D) indicate the bridge-like density connecting the subdomain II of P-1 with the subunit P.
Figure 2.
The resolution of the EM map and the consistency between the EM map and the atomic models were evaluated by Fourier Shell Correlation (FSC) (van Heel, 1987). The thick orange line indicates FSC=0.5, which is a standard value used for the threshold, whereas the thick yellow line is FSC=0.143, and represents a second threshold (Rosenthal and Henderson, 2003). The resolution of the map was evaluated by FSC as the consistency between the two maps, each of which was reconstructed from each half of all the EM images. The resultant FSC is presented in red, indicating a resolution of the EM map as 22.9 or 19.4 Å with thresholds of 0.5 and 0.143, respectively. The FSC between the EM map and the atomic model of the fitted subunits as rigid bodies to the EM map (Figure 4A) is presented in green, indicating the model is consistent with the map up to 20.7 Å with a threshold of 0.5. The FSC between the EM map and the final model with the two loops modified by the MD is presented in blue. The consistency was improved up to 19.7 Å.
Figure 3.
The subunit P tilted towards the subunit P-1. Superposed on the EM map of Figure 1 are ribbon models of subunits (Oda et al, 2009), each coloured separately, which were fitted to the EM map without energy minimization and MD. The fitted subunit P to the EM map (red) tilts towards subunit P-1 by ∼12° compared with the subunit according to the canonical actin helical symmetry (black). Substantial parts of the DNase I binding loops of subunits P and P-1 protrude from the envelope, indicating that these loops might adopt different conformations at the pointed end compared with those within the filament.
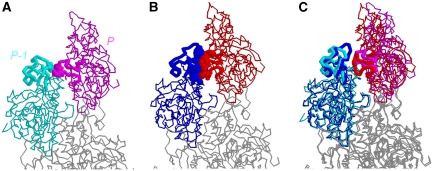
To confirm this interpretation, we performed energy minimization and molecular dynamics (MD) simulation of six sequential actin subunits positioned at the end of the filament. Following energy minimization, MD simulations at 310 K were performed with all α-carbons fixed, except for residues 35−69 of P-1 including the DNase I binding loop and residues 258−277 of P including the hydrophobic plug. Finally, energy minimization was repeated. The series of calculations were independently performed four times and the results of the four calculations were converged (Figure 4B). Despite no restrictions from the EM map being imposed on the calculation, except for the tilt of P towards P-1 achieved by the fitting (Figures 3 and 4A), the DNase I binding loop of P-1 and the hydrophobic plug of P formed a bridge between the two subunits (Figure 4B and C). This was consistent with the bridge-like density observed in the EM map (Figure 4D and E; Supplementary Movie and Supplementary Figure S3). We noted that one half of the DNase I binding loop of the subunit P-1 was left unattached and therefore freely mobile, and appears to protrude from the EM map. The lowest energy model among the four calculated models was selected as the final model. When the same simulation was performed on the putative end model in which all the subunits were placed in the canonical helical symmetry up to P, a number of residues on the loop-to-loop interface were largely limited to 20% of the final model (Figure 5). This indicated that the loop-to-loop interaction was tighter due to the tilting of P, and suggests that the tilting was energetically favoured due to the tighter loop-to-loop interactions.
Figure 4.
Positions and postures of the loops at the pointed end with the tilted end subunit. (A) The backbone models for subunits at the pointed end, in which subunit P is tilted as in Figure 3 and the loops of P and P-1 (thick tubes) are not altered by energy minimization and MD. (B) Four independent results of energy minimization and the MD were superposed. All of the models converged well. The model with the lowest energy among the four models was selected as the final model for further investigation. (C) The thick tubes in (A) were superposed on the final model presented in dark grey. In (A−C), the α-carbons that were fixed in the MD are represented by the thin tubes, whereas those that were free in the MD are represented by the thick tubes. The thick tubes connect residues 35−69 including the DNase I binding loop of P-1, and residues 258−277 including the hydrophobic plug of P. (D, E) EM maps at the contour level that envelops 105% of the calculated volume with the final ribbon model for the pointed end. Residues in the space-filling model (largely underneath the envelope) are those of the hydrophobic plug of P interacting with P-1 (in red) and those of P-1 interacting with the plug (in blue), which fit well into the bridge-like density of the EM map (arrow heads). The viewing angles of D and E are the same as for Figure 1B and D, respectively.
Figure 5.
The effect of tilting of the end subunit on the loops at the pointed end. (A) The same energy minimization and MD simulation described in the main text were performed on a putative model in which no tilting is assumed for the subunit P. The calculation was independently performed four times and the resultant model with the lowest energy is presented. The subunits P and P-1 are coloured in magenta and cyan, respectively. (B) Our final pointed end model, as presented in Figure 4C, with the subunits P and P-1 in red and blue, respectively. (C) Superposition of (A) and (B). The regions indicated by the thick tubes are the same as in Figure 4. The residues in the space-filling model in (A) and (B) are those involved at the interface between the DNase I binding loop and the hydrophobic plug in each model. The interface in (A) is largely limited, indicating that the tilting of P observed by the fitting is associated with the tighter loop-to-loop interactions at the pointed end.
The fitted atomic model, including the shapes and positions of the two contacting loops, is consistent with the EM map as evaluated by FSC (Figure 2). Even without restrictions imposed by the EM map, the MD simulation (Figure 2; Supplementary Figure S3) significantly improved the consistency. This clearly demonstrated the validity of our final model. Although the consistency (blue and green in Figure 2) was higher than the FSC curve for evaluating the resolution (red in Figure 2), it does not indicate overfitting. Rosenthal and Henderson (2003) predicted that if a true structure was available, the FSC between the true model and the obtained EM map from the full data set should remain >0.5 up to the resolution at which the FSC for evaluating the resolution is 0.143. The results obtained in this study are consistent with this prediction.
Discussion
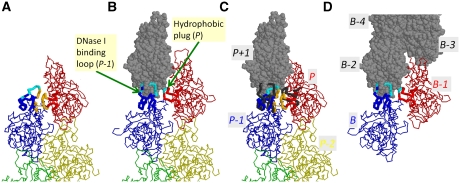
Our study indicates that in the structures we defined, the pointed end of the actin filament, the end subunit P, is tilted against the adjacent subunit P-1. These two subunits interact with each other through the apparent rearrangement of the end loops (the hydrophobic plug of the subunit P and the DNase I binding loop of the subunit P-1) (Figure 6A). The positions and the postures of the loops were compared with those within the filament (Figure 6B) and at the barbed end (Figure 6D). Inside the filament (Figure 6B), both loops bind to P+1, forming the canonical inter-subunit contacts (Oda et al, 2009). In contrast, in our pointed end model (Figure 6A and C), the two loops were substantially shifted and formed tighter contacts with each other. When a new actin molecule, P+1, associates with the pointed end, the specific conformational changes and the tighter contacts of the two loops at the pointed end likely inhibit the addition of the P+1 actin monomer, because the contacts between the two loops must be broken to form the canonical binding to P+1 (Figure 6B). At the same time, the fortified loop-to-loop contact may explain the very slow dissociation rate constants at the pointed end, because it is necessary to break the contact for P to dissociate from the filament. In contrast, at the barbed end, this loop-to-loop contact cannot readily form because the two loops are buried beneath the surface of the barbed end and integrated into the inter-subunit contacts (Figure 6D).
Figure 6.
Positions and postures of the loops at the pointed end, within the filament and at the barbed end. (A) The present model for the actin filament pointed end. (B) The putative model for the pointed end, obtained by truncation of the Oda model for F-actin (Oda et al, 2009). The subunits P, P-1 and P-2 are extracted from the Oda model and presented as wires, whereas the subunit P+1 is shown as grey balls. (C) Superposition of the models (A) and (B). The subunits P and P-1 are the same as in model (A). The thick tubes in model (B) are shown in black. (D) A putative barbed end model obtained by truncation of the Oda model for F-actin. The subunits are labeled as B, B-1, B-2… from the subunit at the barbed end. In (A−D), the thick tubes connect the α-carbon atoms of the residues in two regions: residues 35−69 including the DNase I binding loop (of the subunit P-1 in (A−C) and the subunit B in (D)) and residues 258−277 including the hydrophobic plug (of the subunit P in (A−C) and the subunit B-1 in (D)). The residues in cyan (A−D) are those involved at the interface with P+1 in the Oda model (B). The residues in orange (in A and C) are those involved in the loop-to-loop contacts between the hydrophobic plug of P and the DNase I binding loop of P-1.
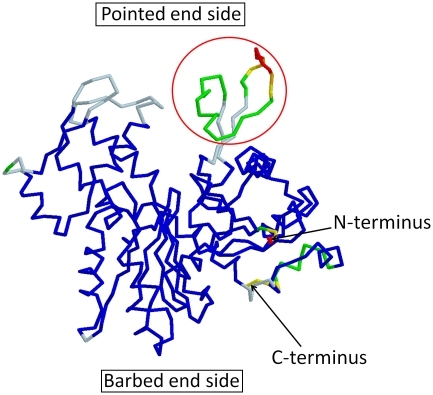
The DNase I binding loop is extremely flexible and often missing in the crystal structures of actin (Figure 7). This flexibility enables this loop to switch between binding the hydrophobic plug on P at the pointed end to the canonical intra-strand contacts in the other parts of the filament (Oda et al, 2009). In contrast, there is no such flexible loop on the barbed end side of the actin subunit, except for the C-terminus, which is not involved in subunit–subunit interactions. Therefore, it appears implausible that additional contacts form specifically between subunits at the barbed end. Collectively, we propose that the extra interactions between the two loops at the pointed end should confer a higher kinetic barrier, both for the polymerization and depolymerization, when compared with the kinetic barrier at the barbed end without changing the critical concentration. The present model is the first elucidation of the dynamics at the actin filament end based on structural data.
Figure 7.
The 88 crystal structures of monomeric actin were compared in an effort to identify flexible regions. The pdb IDs of these 88 structures are 1C0F, 1NWK, 1YAG, 2ASP, 2Q31, 2HF3, 1MA9, 2V52, 2VCP, 1D4X, 1P8Z, 1YVN, 2FXU, 2Q36, 2HF4, 1RFQ, 2VYP, 1DB0, 1QZ5, 1YXQ, 2GWJ, 2Q97, 3CHW, 1YXQ, 2FF3, 1DGA, 1QZ6, 1HLU, 2GWK, 2VCP, 3CI5, 1MDU, 3BUZ, 1EQY, 1RFQ, 1NLV, 2HMP, 2VYP, 3CJC, 2GWK, 2OAN, 1ESV, 1RGI, 1NM1, 2OAN, 2A3Z, 3DAW, 2HMP, 2OAN, 1H1V, 1S22, 1NMD, 2PAV, 2A40, 3EKS, 2OAN, 2V51, 1IJJ, 1SQK, 2A42, 2PBD, 2A41, 3EKU, 2Q1N, 2A40, 1J6Z, 1T44, 2A5X, 2Q0R, 2BTF, 3EL2, 2Q31, 1MDU, 1KXP, 1WUA, 2ASM, 2Q0U, 2D1K, 1LCU, 2V51, 1RDW, 1ATN, 1LCU, 1Y64, 2ASO, 2Q1N, 2FF6 and 1LOT. The structures were aligned against 1J6Z and the average and the s.d. of each α-carbon atom were calculated. Missing residues in the crystal structures were ignored in the calculation. The resultant averaged structure is presented. Residues with 0−0.5, 0.5−1, 1−2, 2−3, 3−4 and >4 Å s.d. were coloured in blue, light blue, green, yellow, orange and red, respectively. The residues located around the DNase I binding loop, indicated by a red circle, showed markedly large s.d. Furthermore, these residues were often missing in the crystal structures. In only 18 structures out of 88 structures, the main chain could be followed in this region, indicating that the area around the DNase I binding loop has significant flexibility.
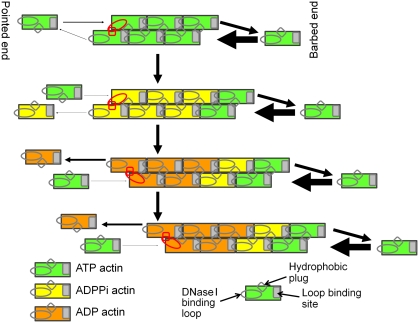
Finally, we present a simple model to explain the ‘treadmilling’ direction using our findings, as an example how the rate difference between the two ends affect actin dynamics (Figure 8). In the steady state with ATP and magnesium (reviewed by Korn et al (1987) and Bugyi and Carlier (2010)), actin polymerizes predominantly at the barbed end, while depolymerizing predominantly at the pointed end, at the same rate. As a result, the actin filament moves towards the barbed end without changing the average length. The treadmilling movement is the most typical intrinsic dynamics of the actin filament. In the molecular movement that occurs during treadmilling, the actin filament can be regarded as the simplest motor system consisting of just one kind of protein.
Figure 8.
A simplified model for actin treadmilling. Presented in red are the loop-to-loop contacts at the pointed end between the DNase I binding loop and the hydrophobic plug. The thickness of the arrows at each end of the filament are proportional to the polymerization and depolymerization rates which are used in the simulation with r=0.1 (Figure 9).
The mechanism of treadmilling involves a combination of three important intrinsic properties of the actin filament. First, ATP hydrolysis occurs within the actin filament and exchange of the bound nucleotide in the filament is negligible. Second, the critical concentration of G-actin with ATP-F-actin or ADPPi-F-actin is lower than that with ADP-F-actin. Third, both rates of polymerization and depolymerization at the pointed end are much slower than those at the barbed end, which is explained by the structure presented here.
In our model, we start with F-actin preformed from all ATP-F-actin, with a certain length, in the presence of ATP-G-actin at a concentration between the critical concentration with ATP-F-actin and that with ADP-F-actin (Figure 8). The slower rate of polymerization at the pointed end due to the loop-to-loop interaction allows a high probability of ATP hydrolysis and phosphate release in the terminal subunit before incorporation of the next monomer, while many ATP-G-actin monomers are polymerized at the barbed end before hydrolysis occurs. Therefore, the actin subunit at the pointed end should be gradually replaced by ADP-F-actin, which makes the critical concentration at the pointed end higher than the ATP-G-actin concentration in solution, resulting in depolymerization. Meanwhile, at the barbed end, ATP-F-actin is predominant, thereby keeping the critical concentration lower than the ATP-G-actin concentration. Collectively, in the steady state, the same amount of depolymerization and polymerization occurs at the pointed end and the barbed end, respectively, and the actin filament moves toward the barbed end without changing its length.
Note that the critical concentration, which is equivalent to the ratio of the depolymerization rate to the polymerization rate, is the same at the two ends when the bound nucleotide is identical (Wegner, 1976; Supplementary Figure S1). Although ATP hydrolysis is essential to provide energy for movement, the apparent difference in the critical concentration at the two ends is due to the nucleotide difference, which originates from the difference in the dynamics based on the specific loop-to-loop interaction at the pointed end. Therefore, the loop-to-loop interaction at the pointed end is the origin of the treadmilling direction.
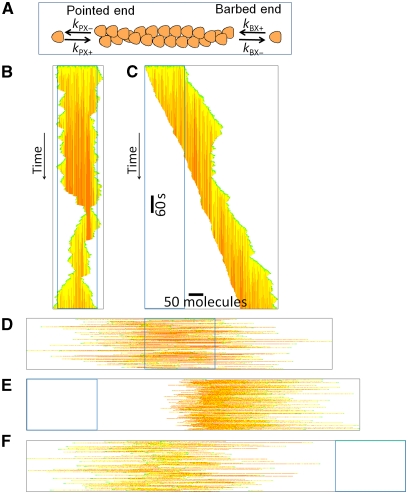
Computer simulations confirmed that the slower rate of depolymerization and polymerization at the pointed end, caused by the loop-to-loop interaction without any other difference between the two ends, accounts for the direction of movement towards the barbed end (Figure 9). An alternative model using the same set of critical concentrations, but with the dynamic pointed end and the less dynamic barbed end, predicted a reversal in the direction of treadmilling (Figure 9F).
Figure 9.
Simulation of actin treadmilling based on the present model. (A) A schematic illustration of the simulation. The kinetic parameter used are based on a recent communication (Fujiwara et al, 2007). At the barbed end: kB,ATP+=10 μM−1s−1, kB,ATP−=1 s−1, kB,ADPPi+=3 μM−1s−1, kB,ADPPi−=0.3 s−1, kB,ADP+=3 μM−1 s−1 and kB,ADP−=6 s−1, where kB,X+ and kB,X− are the rate constants for polymerization and depolymerization with nucleotide X at the barbed end, respectively. Conversely, kP,X+=rkB,X+ and kP,X−=rkB,X−, where kP,X+ and kP,X− are the rate constants for polymerization and depolymerization with nucleotide X at the pointed end, respectively. r is the ratio of the rate constants for the pointed and barbed ends. We introduced the parameter r instead of using the measured parameters (Fujiwara et al, 2007) to simplify the system, thereby emphasizing the importance of the rate difference between the two ends without changing the critical concentration. The rates are the same at both ends when r=1, whereas when r is <1, the pointed end has slower rates than those at the barbed end, with the same critical concentrations that are equivalent to the ratio k−/k+. The rate of ATP hydrolysis of each subunit in the filament was 0.3 s−1. The Pi release rate at either end was 2 s−1, whereas this release rate was 0.003 s−1 in the middle of the filament. The actin concentration was chosen so that the average length of the actin filament remained constant. The time interval of the simulation was 0.005 s. (B−F) Results of the simulation. Each horizontal line represents a single actin filament, with the pointed end to the left. On the horizontal line, each dot represents an actin subunit with ATP, ADPPi or ADP in green, yellow or orange, respectively. The blue box in each panel indicates the initial position of the filament in the simulation. (B) Time course of a single filament with r=1, represented with a time interval of 1 s. The actin filament fluctuates in length as time passes, but does not show any unidirectional movement. (C) Time course of a single filament with r=0.1, which is a realistic parameter. The filament moves towards the barbed end at a constant velocity. (D) The status of the filaments after 1250 s with r=1. Each horizontal line represents the result of a single simulation and 146 results were collected. The filaments were observed to be variable in length, but remain at the initial position. (E) The filament status after 1250 s with r=0.1. All of the filaments move towards the barbed end by approximately the same distance. The average speed is 3.7 μm/h, which is consistent with previous observations (∼2 μm/h; Selve and Wegner 1986). (F) The filament status after 1250 s with r=2. In this model, the pointed end is more dynamic than the barbed end. The direction of the movement was inverted.
This model strongly suggests that the two loops that are capable of switching between binding partners are the determining factors for the unidirectional movement of the filament. Since the present mechanism is surprisingly simple, an artificial motor system based on the information presented in this study may be possible, although the current model of the treadmilling movement may be oversimplified.
At present, we are not able to exclude possible contributions of other factors, such as long-ranged electrostatic interaction to the dynamics at the filament ends (Sept et al, 1999). We also note that the present model explains only the difference in the dynamics at the two ends. For a complete explanation of the intrinsic dynamics of the actin filament, we must answer at least two more questions: why ATP hydrolysis is induced upon polymerization and why ADP-F-actin is less stable than ATP- or ADPPi-F-actin. To address these questions, structures are required for ATP- or ADPPi-F-actin at a similar resolution as for ADP-F-actin (Oda et al, 2009).
Materials and methods
Proteins
Actin was purified from rabbit skeletal muscle, as previously described (Spudich and Watt, 1971). Chicken muscle CapZα1 and β1 were co-expressed in Escherichia coli BL21 (DE3) pLys-S (EMD Chemicals, Gibbstown, NJ) and were purified, as previously described (Soeno et al, 1998; Yamashita et al, 2003).
Cryo-electron microscopy
Actin (0.5 mg/ml) and CapZ (0.011 mg/ml) were mixed at a molar ratio of 1:70 and incubated for 45 min at 25°C in a solution containing 50 mM NaCl, 10 mM sodium phosphate buffer (pH 7.4), 3 mM MgCl2, 0.005% (w/v) NaN3 and 0.7 mM DTT. CapZ was used to increase the number of actin pointed ends in the solution. The sample solution was diluted in the buffer before application to the grid and snap-frozen by plunging into liquid ethane. The images of the ice-embedded specimens were recorded on Kodak SO163 photographic film with defocusing of 5−8 μm at a magnification of × 40 000 at 300 kV (34 electron/Å2 dose), using a liquid helium stage in a JEOL JEM3000-EFC electron microscope equipped with an energy filter. Films were digitized with a PhotoScan2000 scanner (Z/I Imaging) at 7 μm steps (1 pixel=1.75 Å). The images were subsequently shrunk and adjusted so that the final pixel size was 3.4125 Å.
Image analysis
Image analysis was performed by employing procedures that were specifically designed for single particle analysis of the actin filament end structures (Narita and Maéda, 2007) with additional refinement steps (Narita et al, 2006). All image analyses were performed on Eos (Yasunaga and Wakabayashi, 1996). The final 3D electron density map was obtained from 714 filament images. The results were evaluated as category I (Narita and Maéda, 2007), proving the structure was well determined.
Fitting of the atomic model and MD simulation
The atomic model of the F-actin subunit with ADP and Ca2+ (Oda et al, 2009) was fitted to each mass in the EM density map as a rigid body. The nucleotide and divalent cation species did not significantly affect the result because the flexible region in the MD simulation does not interact with the nucleotide or the cation. The energy minimization and the MD simulation were performed using NAMD software (Phillips et al, 2005). The calculation consisted of three steps as follows: (1) Energy minimization was performed for the six actin subunits from the pointed end for 100 000 steps (1 step=2 fs). The α-carbons of the P-5 and P-6 subunits were fixed and the other atoms were free in the calculation; (2) The MD simulation at 310 K was performed for 200 000 steps with all the α-carbons fixed, except for the following two regions: residues 35−69 of P-1 including the DNase I binding loop and residues 258−277 of P including the hydrophobic plug; and (3) Energy minimization was repeated with the same conditions as used in step 1. No restrictions from the EM map were imposed on the calculation, except for the tilt of P towards P-1 observed during fitting.
Accession codes
The EM density map of the actin filament pointed end has been submitted to EMDB (http://www.ebi.ac.uk/pdbe/emdb/) under accession code EMD-1872. The present atomic model for the actin filament pointed end has been submitted to Protein Data Bank under accession code 2y83.
Supplementary Material
Acknowledgments
This work was supported by a Grant-in-Aid for Scientific Research (S:20227008-00) from the Japan Society for the Promotion of Science (JSPS), the Uehara Memorial Foundation, Takeda Science Foundation and the Kazato Research Foundation.
Author contributions: AN designed and performed the research. AN and TO analysed the data. AN and YM wrote the paper.
Footnotes
The authors declare that they have no conflict of interest.
References
- Bugyi B, Carlier MF (2010) Control of actin filament treadmilling in cell motility. Annu Rev Biophys 39: 449–470 [DOI] [PubMed] [Google Scholar]
- Carlier MF, Criquet P, Pantaloni D, Korn ED (1986) Interaction of cytochalasin D with actin filaments in the presence of ADP and ATP. J Biol Chem 261: 2041–2050 [PubMed] [Google Scholar]
- Chen N, Qu X, Wu Y, Huang S (2009) Regulation of actin dynamics in pollen tubes: control of actin polymer level. J Integr Plant Biol 51: 740–750 [DOI] [PubMed] [Google Scholar]
- Condeelis JS, Wyckoff JB, Bailly M, Pestell R, Lawrence D, Backer J, Segall JE (2001) Lamellipodia in invasion. Semin Cancer Biol 11: 119–128 [DOI] [PubMed] [Google Scholar]
- Coue M, Korn ED (1985) Interaction of plasma gelsolin with G-actin and F-actin in the presence and absence of calcium ions. J Biol Chem 260: 15033–15041 [PubMed] [Google Scholar]
- Fujiwara I, Vavylonis D, Pollard TD (2007) Polymerization kinetics of ADP- and ADP-Pi-actin determined by fluorescence microscopy. Proc Natl Acad Sci USA 104: 8827–8832 [DOI] [PMC free article] [PubMed] [Google Scholar]
- Holmes KC, Popp D, Gebhard W, Kabsch W (1990) Atomic model of the actin filament. Nature 347: 44–49 [DOI] [PubMed] [Google Scholar]
- Hotulainen P, Hoogenraad CC (2010) Actin in dendritic spines: connecting dynamics to function. J Cell Biol 189: 619–629 [DOI] [PMC free article] [PubMed] [Google Scholar]
- Iwasa M, Maeda K, Narita A, Maeda Y, Oda T (2008) Dual roles of Gln137 of actin revealed by recombinant human cardiac muscle alpha-actin mutants. J Biol Chem 283: 21045–21053 [DOI] [PMC free article] [PubMed] [Google Scholar]
- Kabsch W, Mannherz HG, Suck D, Pai EF, Holmes KC (1990) Atomic structure of the actin:DNase I complex. Nature 347: 37–44 [DOI] [PubMed] [Google Scholar]
- Korn ED, Carlier MF, Pantaloni D (1987) Actin polymerization and ATP hydrolysis. Science 238: 638–644 [DOI] [PubMed] [Google Scholar]
- Lai FP, Szczodrak M, Block J, Faix J, Breitsprecher D, Mannherz HG, Stradal TE, Dunn GA, Small JV, Rottner K (2008) Arp2/3 complex interactions and actin network turnover in lamellipodia. EMBO J 27: 982–992 [DOI] [PMC free article] [PubMed] [Google Scholar]
- Manor U, Kachar B (2008) Dynamic length regulation of sensory stereocilia. Semin Cell Dev Biol 19: 502–510 [DOI] [PMC free article] [PubMed] [Google Scholar]
- Narita A, Maéda Y (2007) Molecular determination by electron microscopy of the actin filament end structure. J Mol Biol 365: 480–501 [DOI] [PubMed] [Google Scholar]
- Narita A, Takeda S, Yamashita A, Maéda Y (2006) Structural basis of actin filament capping at the barbed-end: a cryo-electron microscopy study. EMBO J 25: 5626–5633 [DOI] [PMC free article] [PubMed] [Google Scholar]
- Oda T, Iwasa M, Aihara T, Maéda Y, Narita A (2009) The nature of the globular- to fibrous-actin transition. Nature 457: 441–445 [DOI] [PubMed] [Google Scholar]
- Phillips JC, Braun R, Wang W, Gumbart J, Tajkhorshid E, Villa E, Chipot C, Skeel RD, Kale L, Schulten K (2005) Scalable molecular dynamics with NAMD. J Comput Chem 26: 1781–1802 [DOI] [PMC free article] [PubMed] [Google Scholar]
- Pollard TD (1986) Rate constants for the reactions of ATP- and ADP-actin with the ends of actin filaments. J Cell Biol 103: 2747–2754 [DOI] [PMC free article] [PubMed] [Google Scholar]
- Pollard TD, Weeds AG (1984) The rate constant for ATP hydrolysis by polymerized actin. FEBS Lett 170: 94–98 [DOI] [PubMed] [Google Scholar]
- Rosenthal PB, Henderson R (2003) Optimal determination of particle orientation, absolute hand, and contrast loss in single-particle electron cryomicroscopy. J Mol Biol 333: 721–745 [DOI] [PubMed] [Google Scholar]
- Selve N, Wegner A (1986) Rate of treadmilling of actin filaments in vitro. J Mol Biol 187: 627–631 [DOI] [PubMed] [Google Scholar]
- Sept D, Elcock AH, McCammon JA (1999) Computer simulations of actin polymerization can explain the barbed-pointed end asymmetry. J Mol Biol 294: 1181–1189 [DOI] [PubMed] [Google Scholar]
- Soeno Y, Abe H, Kimura S, Maruyama K, Obinata T (1998) Generation of functional beta-actinin (CapZ) in an E. coli expression system. J Muscle Res Cell Motil 19: 639–646 [DOI] [PubMed] [Google Scholar]
- Spudich JA, Watt S (1971) The regulation of rabbit skeletal muscle contraction. I. Biochemical studies of the interaction of the tropomyosin-troponin complex with actin and the proteolytic fragments of myosin. J Biol Chem 246: 4866–4871 [PubMed] [Google Scholar]
- van Heel M (1987) Similarity measures between images. Ultramicroscopy 21: 95–100 [Google Scholar]
- Wegner A (1976) Head to tail polymerization of actin. J Mol Biol 108: 139–150 [DOI] [PubMed] [Google Scholar]
- Yamashita A, Maeda K, Maéda Y (2003) Crystal structure of CapZ: structural basis for actin filament barbed end capping. EMBO J 22: 1529–1538 [DOI] [PMC free article] [PubMed] [Google Scholar]
- Yasunaga T, Wakabayashi T (1996) Extensible and object-oriented system Eos supplies a new environment for image analysis of electron micrographs of macromolecules. J Struct Biol 116: 155–160 [DOI] [PubMed] [Google Scholar]
Associated Data
This section collects any data citations, data availability statements, or supplementary materials included in this article.


