Abstract
Polymer-shelled micro-bubbles are employed as ultrasound contrast agents (UCAs) and vesicles for targeted drug delivery. UCA-based delivery of the therapeutic payload relies on ultrasound-induced shell rupture. The fragility of two polymer-shelled UCAs manufactured by Point Biomedical or Philips Research was investigated by characterizing their response to static overpressure. The nominal diameters of Point and Philips UCAs were 3 μm and 2 μm, respectively. The UCAs were subjected to static overpressure in a glycerol-filled test chamber with a microscope-reticule lid. UCAs were reconstituted in 0.1 mL of water and added over the glycerol surface in contact with the reticule. A video-microscope imaged UCAs as glycerol was injected (5 mL∕h) to vary the pressure from 2 to 180 kPa over 1 h. Neither UCA population responded to overpressure until the rupture threshold was exceeded, which resulted in abrupt destruction. The rupture data for both UCAs indicated three subclasses that exhibited different rupture behavior, although their mean diameters were not statistically different. The rupture pressures provided a measure of UCA fragility; the Philips UCAs were more resilient than Point UCAs. Results were compared to theoretical models of spherical shells under compression. Observed variations in rupture pressures are attributed to shell imperfections. These results may provide means to optimize polymeric UCAs for drug delivery and elucidate associated mechanisms.
INTRODUCTION
Conventional ultrasound imaging involves detection of backscattered acoustic radiation (1–10 MHz) from objects (i.e., tissue, bone, and blood). Stabilized micron-scale spheres composed of a thin biocompatible shell that encapsulates an inert gas are widely used and researched as ultrasound contrast agents (UCAs).1, 2, 3 Lipid shells are usually thin (<10 nm); these UCAs are considered “soft” in terms of their shell properties. Elastic properties have been attributed to albumin or protein-shelled agents.
UCAs provide increased sensitivity and specificity due to their high echogenicity relative to surrounding tissue devoid of UCAs.4, 5 Furthermore, their nonlinear oscillations generate harmonics of the incident ultrasound that can be specifically detected to further enhance the contrast-to-noise ratio.6, 7, 8 Subharmonic ultrasound contrast imaging is a particularly attractive method as it reduces the loss in signal-to-noise ratio due to frequency-dependent attenuation; this technique has been successfully applied in vascular imaging applications.6, 9
Recently, the mechanical response of existing and experimental UCAs to high-frequency (>20 MHz) ultrasound has gained interest. High-frequency ultrasound imaging facilitates high-resolution diagnosis of the microcirculation as needed in the treatment of dermal10, 11 and ophthalmic diseases.12 Small-animal high-frequency imaging, which includes monitoring the development of genetically engineered mouse embryos,13 is another area of growing interest. In fact, commercial ultrasound machines have been developed specifically for this purpose.14
UCAs can be driven to destruction by acoustic forcing, a unique property among all the contrast agents used in medical imaging. Tissue perfusion imaging is an emerging method which directly exploits this property. In perfusion imaging, UCAs flow into a region of interest providing a base-line contrast level and are subsequently destroyed by ultrasound. Perfusion rates are based on the time needed to reestablish the previous level of contrast with intact, inflowing agents.15, 16, 17, 18
Ultrasound-mediated destruction of UCAs also can be employed for therapeutic applications such as localized drug delivery and gene transfection.19, 20, 21 UCA-based delivery of a therapeutic payload can be targeted to specific pathologies by bioconjugating UCAs with appropriate ligands or antibodies.22, 23, 24 Ultrasound can noninvasively rupture UCAs bound to the disease site and trigger the local release of therapeutics. Furthermore, ultrasound-UCA interactions can produce mechanical effects such as cavitation that enhance local uptake.21 The destruction of UCAs can be detected using diagnostic ultrasound to monitor the treatment in real-time.
Optimization of UCAs for these varied and emerging applications continues to be a challenge and a subject of on-going research. Outstanding issues exist with respect to the optimal agent construction and the associated acoustic forcing. The UCA size influences the acoustic resonance response.8, 25, 26, 27, 28 Also, the material and thickness of the UCA shell are important design parameters as these not only determine the stability in the circulatory system, but also significantly influence the acoustically driven destruction characteristics. Ultimately, contrast-enhanced ultrasound imaging is contingent on the reproducibility of an agent’s response29 and the ability to adjust the response with respect to size and shell parameters.
Polymer-shelled agents have been developed to address the need for a high level of manufacturing control in terms of the UCA size and shell parameters.30, 31, 32, 33, 34 These agents are particularly attractive candidates for UCA-destruction applications as some types have an abrupt destruction threshold below which they remain largely intact.26 Polymer UCAs have been reported to exhibit oscillations without rupture at low pressure amplitudes24, 33 and undergo violent destruction at sufficiently high forcing. Upon rupture of the shell, the interior gas may escape resulting in free gas bubbles, which have been hypothesized to produce clinically relevant ultrasound backscatter24, 26, 27, 35 that can facilitate treatment monitoring. Recent studies have observed the generation of subharmonic response from polymer-shelled UCAs when excited at high frequencies (40 MHz).36, 37
However, despite these developments, polymer-shelled agents are much less studied than lipid-shelled agents. A better understanding of their response as a function of shell parameters is needed so they can be optimized for targeted drug and gene delivery applications. The elastic properties of the shell and associated dynamic behavior need to be more rigorously characterized. The shell material properties and the thickness also are necessary parameters for developing realistic theoretical models that describe the dynamic response of polymer-shelled agents;38, 39 the robustness and predictive value of these models are highly dependent on accurate values of the shell parameters.
High-speed video-microscopy of UCAs26, 27, 40 and studies characterizing acoustic backscatter from UCAs28, 37, 41, 42 have been preliminary steps in this direction. Although these techniques provide sizes of single agents and insight into the dynamic response of UCAs to ultrasonic excitation, they do not provide information on the shell’s material parameters. Leong-Poi et al. measured the volumetric change resulting from a change in static pressure and estimated the bulk modulus of polymeric UCAs using a novel technique to microscopically monitor multiple UCAs subjected to overpressure.43 Recently, an atomic force microscope (AFM) was used to estimate the shell material properties based on measurements of UCA deformation due to an external force.44 Although the AFM method provided novel quantitative insight into the elasticity of UCA shells, this method cannot be implemented efficiently to characterize a large number of UCAs.
The present study investigated the response of polymer-shelled UCAs to slowly increasing static pressure and compared the “fragility” of different UCA populations. The role of shell thickness and elasticity in the rupture process over a population of UCAs from two different manufacturers was examined.
THEORY
Polymeric contrast agent shells have been treated as homogeneous curved, solid, thinwall structures. Previous qualitative observations of their dynamics have confirmed that their behavior under low-amplitude excitation is that of an elastic material. In terms of elastic shell theory, these structures can be further classified as “axishells” because they may undergo axisymmetric deformation without rigid body motion.45 For such solid, thin-walled structures, the stability of their shape is of primary importance to their function. In buckling, the shell may bifurcate into an irreversible, asymmetric shape and undergo catastrophic failure. The buckling pressures for homogeneous spherical shells were first derived over a century ago.45 The critical pressure and stress were obtained by considering infinitesimal displacements.
Early calculations for compressive buckling of spherical shells were based on assumptions of infinitesimal displacements subjected upon a macro-scaled, perfectly spherical, thin shell. The linear elastic solution for critical buckling stress under these assumptions can be expressed as
| (1) |
and the critical buckling pressure (Pcrit = 4hσcrit∕d) is given as
| (2) |
where E is the Young’s modulus, ν is the Poisson’s ratio, h is the shell thickness, d is the diameter, A is a lumped constant describing the material properties, and χ is the shell-thickness-to-radius ratio (STRR).46 A Poisson’s ratio of 0.3 was considered an appropriate approximation for most common materials resulting in A = 1.21E (Ref. 47) (a positive coefficient of A implies compression of the sphere). Early experimental investigations indicated that the critical buckling pressure measured for spherical structures was approximately one-fourth of the theoretical predicted value, and this discrepancy was attributed to the imperfections or inhomogeneities in the shell.47 For expansion of thin-shelled structures that exhibited asphericity of less than 0.025h, the lumped material constant A was empirically determined to be −0.84E (Ref. 48) (a negative coefficient of A implies expansion of the sphere).
This classical expression for the critical buckling pressure assumes that the shell has uniform thickness and that the transverse shear components are negligible. However, variations in shell thickness can result in an effective bending thickness and transverse shear. A more complete formulation has been recently introduced to account for shear components that may be significant in biological spherical shells49 and the corresponding critical buckling pressure can be expressed as
| (3) |
where h0 is the effective bending thickness (arising due to nonuniform shell thickness), R is the median radius of the shell, G is the in-plane shear modulus, Gt is the transverse shear modulus, and ks is the shear coefficient. The corresponding critical-pressure values were found to be significantly less for the cases studied. Equation 3 reduces to the classical linear elastic equation shown in Eq. 2 when the shell is perfectly homogeneous (h0 = h) and the transverse shear is negligible (Gt ≫ G). These theoretical developments are considered in the comparisons with our experiments since structural heterogeneities and imperfections have been suggested as important considerations in previous studies involving polymeric agents.28, 33, 43, 50
MATERIALS AND METHODS
Two types of UCAs were employed in this study. These were the polycaprolactone shelled, nitrogen gas filled Point 1668 agent (Point Biomedical, San Carlos, CA) which had a nominal mean diameter of 3 μm and the polylactide-shelled, nitrogen gas filled agent (Philips Research Laboratories, Eindhoven, Netherlands) with a nominal mean diameter of 2 μm. The Point agents are no longer commercially produced but are being manufactured for academic research. Both agents are being researched and developed for perfusion imaging and localized drug delivery applications, which require acoustically induced destruction. Consequently, the Point and the Philips UCAs have a mutually common design specification of a constant STRR. The manufacturing process of both UCA populations involved creating fluid-filled capsules (e.g., cyclodecane core and polylactide shell for the Philips UCA) and removing the core to produce a polymeric bubble. Therefore, the nominal STRR values were estimated from the ratio of the initial concentrations of the core and the shell materials.34, 50 A UCA population with desired STRR can be obtained by adjusting the ratio of initial concentrations; the STRR remains constant despite variations in the UCA size. Based on this ratio of initial concentrations, the Point and the Philips UCAs had a nominal STRR of 7.5 nm∕μm and 40 nm∕μm, respectively.
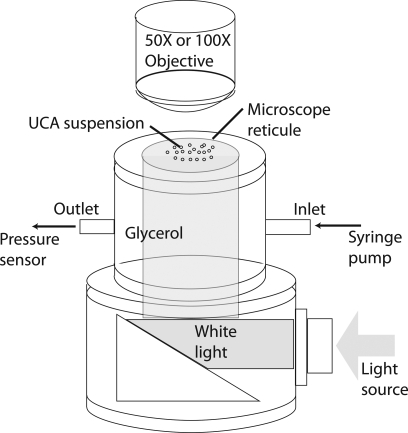
A cylindrical test chamber was custom designed for subjecting the UCAs to static overpressure (Fig. 1). The chamber had a permanent glass window at the bottom and a removable microscope reticule (secured using a lid and a rubber o-ring) at the top. The chamber was mounted on top of a right-angle light collimator which mated with a 0.25 inch light guide. This arrangement allowed uniform white-light illumination within the chamber from below. Two flow ports were installed on the chamber to facilitate the flow of fluid in and out of the chamber.
Figure 1.
(Color online) The schematic diagram of the experimental setup.
The test chamber was washed with distilled water and dried using compressed air prior to each experimental run. The outlet port was connected to a pressure sensor (PM100D, World Precision Instruments, Sarasota, FL) for monitoring the static pressure within the chamber. A syringe pump (BS-8000, Braintree Scientific, Inc., Braintree, MA) was used to slowly pump glycerol (to avoid introducing air bubbles) through the inlet of the chamber, which was open at the top, until the meniscus of glycerol exceeded the top of the chamber. A small amount of the dry-form UCAs was then reconstituted in 0.1 mL of distilled water, and carefully added at the top of the glycerol surface using a dropper; care was taken to obtain a uniform layer of UCA solution on top of the glycerol without mixing glycerol and water. The microscope reticule was gently placed on top of the chamber to prevent the unwanted intrusion of air bubbles. Thus, a relatively uniform layer of UCAs was placed directly under the markings on the microscope reticule.
The UCAs were subjected to overpressure that slowly increased from 2 to 180 kPa over a 1 h duration through the continuous injection of glycerol at a rate of 5 mL∕h. Pressure-induced changes in the UCAs were visually monitored (through the microscope reticule) using a video-microscope consisting of a 1 Mpixel CCD camera (Qcam, Qimaging, BC, Canada), and a long distance microscope objective (EO Infinity-Corrected LWDO, Edmund Optics, Barrington, NJ). The imaging setup for the Point UCAs had a 50X magnification and a 128 μm field of view (FOV) and the imaging setup for the Philips UCAs had a 100X magnification and a 64 μm FOV. A customized dynamic-focusing algorithm was implemented to autonomously reposition the camera to maximize the gradient at the edges of the reticule markings in the FOV. This algorithm ensured that the UCAs in contact with the reticule remained in the optimal focal plane of the imaging system. The dynamic focusing resulted in a variable image-capture rate, which remained between 1 and 4 frames∕s. The static pressure corresponding to each captured frame was recorded.
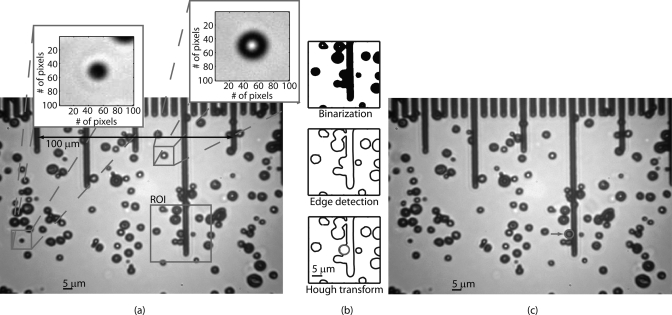
Individual UCAs in each frame were sized using semiautomated post processing (illustrated in Fig. 2) involving the following three steps: (1) a 0.5 × 0.5 µm median filter51 reduced the noise in the acquired images; (2) a region of interest (30 × 30 µm) centered around a user specified UCA was binarized; (3) thresholding the gradient calculated using a Sobel operator52 was used to detect the edges in the ROI; and (4) the position and the diameter of the UCAs within the ROI were determined by applying the generalized Hough transform for a circle.53 Thus, the algorithm detected and sized the UCAs, including those partially obscured as shown in Fig. 2c. UCAs that migrated outside of the FOV or that “clumped” together were discarded. The resulting data were analyzed using the statistics toolbox in MATLAB (Mathworks, Inc., Natick, MA) and fitted to the theoretical model presented in Sec. II for spherical-shell rupture. The dependence of rupture pressure on UCA diameter was investigated. Error bars in the results presented in the following sections indicate the standard deviation.
Figure 2.
(Color online) (a) A raw image acquired at 3.5 kPa. (b) Illustration of the steps involved in the image processing algorithm. (c) The algorithm effectively detects and sizes UCAs including those partially obscured.
RESULTS
Eleven trials (over 8 weeks) with the Point UCAs resulted in a total of 976 valid UCAs, of which 851 ruptured when subjected to overpressure in the range of 2 to 180 kPa. Similarly, 13 trials (over 8 weeks) with the Philips UCAs resulted in a total of 1048 valid UCAs, of which 961 ruptured when subjected to static overpressure in the same range.
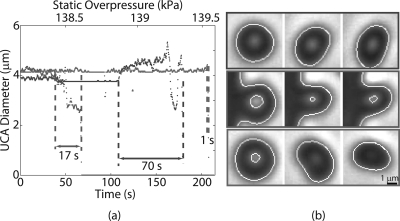
The majority (99%) of the Point and Philips UCAs in all experimental runs did not respond to the change in static pressure until the threshold for shell rupture was exceeded, resulting in an abrupt disintegration of UCA. However, 1% of the UCAs exhibited a slow reduction in size with increase in overpressure. In these cases, the process of UCA destruction lasted up to 100 s. The diameters of three Point UCAs plotted against time and corresponding overpressure are shown in Fig. 3a. The curve in red represents the majority of the UCAs and the two other curves represent the minority behavior. These three UCAs were roughly the same size (4 μm). However, at a static overpressure of roughly 139 kPa, the three UCAs exhibit significant differences in their rupture behavior. Corresponding visual observations also indicated these difference in the buckling behavior as shown in Fig. 3b. Unlike the majority of the UCAs that maintained spherical symmetry prior and during the destruction process, these UCAs became asymmetrical during the rupture process and exhibited “folding” behavior. These qualitative distinctions in the UCA rupture were not related to their size.
Figure 3.
(Color online) (a) The diameters of three illustrative UCAs that possibly exhibit different buckling modes are plotted against time and corresponding overpressure. Majority (∼99%) of UCAs rupture in a manner to that shown by the red. (b) Corresponding video observations of the three UCAs showed distinctly different rupture behavior despite being of same size and shell composition.
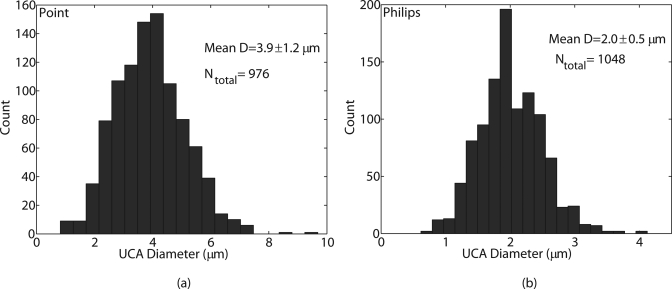
Both UCA populations exhibited a relatively polydisperse size distribution; the corresponding histograms are shown in Fig. 4. The Kolmogorov-Smirnov test indicated that neither distribution was Gaussian. The maximum likelihood estimates for the mean diameters (and the standard deviations) of the POINT (Fig. 4a) and the Philips (Fig. 4b) UCAs were 3.9 ± 1.2 μm and 2.0 ± 0.5 μm, respectively, and were consistent with their specified nominal mean diameters.
Figure 4.
(Color online) Histograms (20 bins) of diameter for (a) Point UCA and (b) Philips UCA.
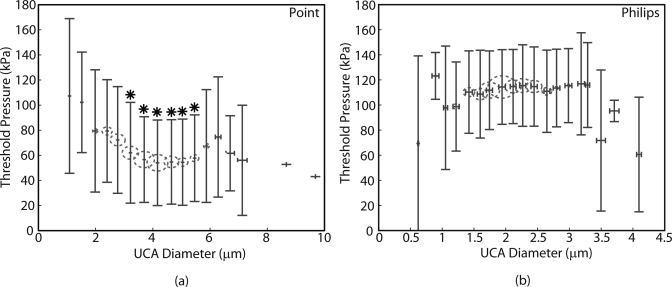
The size bins used to generate the histograms in Fig. 4 were used to divide UCA data into groups. Figure 5 shows the estimated mean rupture pressures plotted as a function of the estimated mean UCA diameters for each group (red circles). The radii of the circles are proportional to the number of UCAs in each bin. The Pearson’s correlation test between rupture pressures and UCA diameters, which produced R = 0.17 and p < 0.05 for the Point UCAs and R = 0.05 and p = 0.16 for the Philips UCAs, indicated that the threshold pressure for both UCA populations was not critically dependent on the UCA diameter.
Figure 5.
(Color online) Mean rupture pressure vs. mean diameter (red circles) for (a) Point UCAs and (b) Philips UCAs within each bin used to generate the UCA diameter histograms. The error bars represent estimated standard deviation. The radius of the circles is proportional to the number of samples in each bin. The rupture pressures exhibited variances greater than 100% and were not critically dependent on UCA diameter. The mean rupture pressures statistically different (p < 0.05) from those in the first and the second bins are indicated by *.
The lack of correlation between rupture pressure and UCA diameter was further established by performing the ANOVA analysis and multiple comparison of mean rupture pressures in different groups of UCA diameter. The mean pressures of the first and the second bins of the Point UCAs were statistically different from the mean pressures indicated by *. However, both bins only had 9 samples. Mean rupture pressures for the majority of the bins were statistically the same. Similarly, the mean rupture pressures for the Philips UCA that corresponded to different size groups were statistically the same. Rupture pressures in the majority of the bins in both populations exhibited deviations in excess of 50% of the mean value.
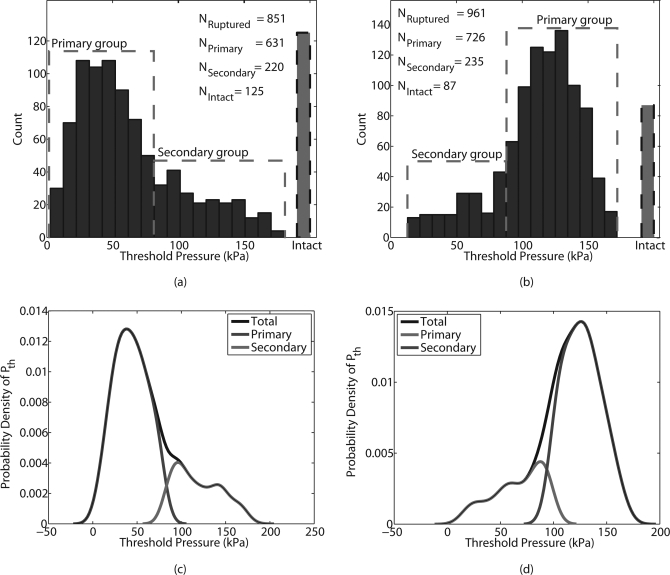
The histograms of the threshold static pressure of both UCA populations (Fig. 6) indicated a multi-modal distribution. A k-means algorithm54 was utilized to separate the rupture pressure data for each type of UCA into primary (quasinormal) and secondary (tail of the distribution) groups. The rupture-pressure histogram of the Point UCAs (Fig. 6a) revealed that 632 of the ruptured Point UCAs constituted the primary group with a mean rupture pressure of 43 ± 18.8 kPa. The Point secondary group had an estimated mean rupture pressure of 119 ± 26.1 kPa. Thus, the measurements indicated the possibility of at least three sub-groups within the Point UCA data: the primary group, the secondary group, and the intact group. The intact group refers to the UCAs that did not rupture in the pressure range of 2 to 180 kPa. The rupture pressure data for the Philips UCAs were processed in a similar manner to obtain three groups, namely the primary, secondary, and intact groups consisting of the 726, 235, and 87 UCAs, respectively. The Philips primary group had a mean rupture pressure of 126.9 ± 17.3 kPa and the Philips secondary group had a mean rupture pressure of 66.6 ± 23.8 kPa. The mean rupture pressures of the Philips primary group was roughly three times that of the mean rupture pressure of the Point primary group. The corresponding probability density functions (PDFs) of the rupture pressures for the total population, the primary group, and the secondary group for the Point and Philips UCAs were estimated using a normal kernel of bandwidth 1.2 and are shown in Figs. 6c, 6d, respectively.
Figure 6.
(Color online) Histograms (20 bins) of the static pressure threshold for both UCA populations, (a) Point and (b) Philips, suggested a multi-modal distribution. A k-means algorithm divided the pressure data into two groups: a primary group and a secondary group. Additional, a third category of UCAs that remained intact during the experimental runs were present in Point and Philips UCAs. The estimated probability densities of the rupture pressures for the collective and individual groups for Point UCA is shown in (c) and that for the Philips UCA is shown in (d).
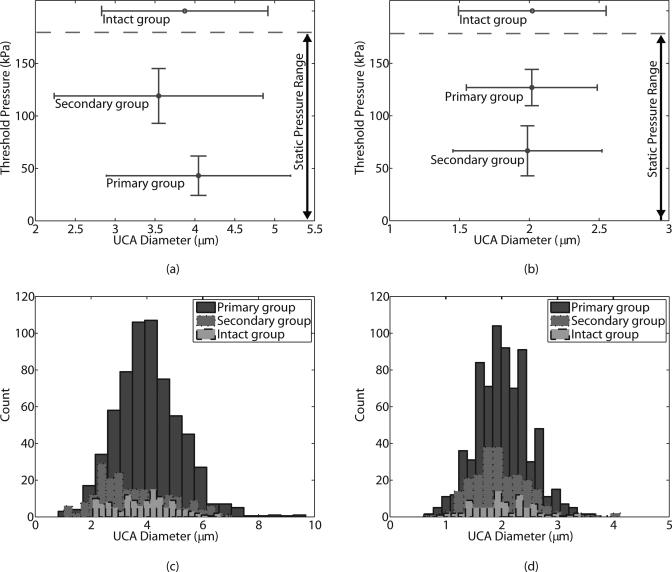
Figures 7a, 7b show the plot of mean rupture pressures in each of the three groups as a function of the corresponding mean UCA diameters for the Point and the Philips populations. ANOVA and the student t-test (p < 0.05) were performed to determine the statistical significance of comparisons between mean values from different groups. For both UCA populations, the mean of rupture pressures from the different groups were statistically different; the separation between the rupture pressure from the three groups is apparent in the graphical representation of the data. However, for both of the agent populations the diameters from the different groups exhibited a nearly 100% overlap as shown in the histograms of the UCA diameters for the three groups (Figs. 7c, 7d). Statistical analysis on the means of the diameters from the three groups indicated that the mean diameter from the Point secondary group was marginally different from the other Point groups. The means of the diameters from the three groups for the Philips UCAs were not statistically different. Thus, the primary, secondary, and intact groups of both populations of UCAs exhibited distinctly different rupture behavior despite the similarities in the corresponding size distributions in the three groups. These results provide evidence that the shell characteristics vary between the different groups of UCA populations.
Figure 7.
(Color online) Plot of mean threshold pressure as a function of mean Point UCA diameter for the three groups: primary, secondary, and intact is shown in (a). A similar plot for the Philips UCA is shown in (b). The histograms (20 bins) of UCA diameter for the three groups: primary, secondary, and intact for the Point UCA and the Philips UCA are shown in (c) and (d), respectively. The threshold pressure for rupture for both types of UCAs was independent of diameter (Pearson’s correlation test yielded R2 < 0.03). ANOVA analysis indicated that the mean rupture pressures in each group were statistically different, but the histogram of the corresponding diameters exhibited almost a 100% overlap, indicating that the UCA diameters in the three groups were essentially the same.
DISCUSSION
The “controlled fragility” of polymer agents50 makes them desirable candidates for tissue perfusion imaging and targeted drug delivery in which UCA rupture is needed and secondary intact UCAs are not desirable. Under the assumptions that the polymer-shelled UCAs responded to overpressure in a manner similar to classical buckling (described by Eq. 2), the lack of correlation between rupture pressures and diameters suggest that the rupture pressures might indeed be more critically dependent on the STRR of the UCAs and the material properties of the shell. Furthermore, a large spread in the rupture pressures (>50%) for both UCA populations and the evidence of multiple rupture pressure groups with distinctly different rupture behavior allude to the nonuniformity and shell imperfections within each of the UCA populations.
In both UCA populations, the primary (quasi-Gaussian) groups represented the majority (74% and 76% for Point and Philips, respectively) of the UCAs investigated. The mean rupture pressure of the primary groups provided a quantitative comparison of the fragility of the Point and Philips UCAs. The mean rupture pressure of the Philips primary group was approximately three times that of the Point primary group, which indicated that Philips UCAs were three times as robust as the Point UCAs. However, the Point UCAs that constituted the secondary group were more resilient to static overpressure than the Point primary group. The rupture pressure data indicated that the static pressure necessary to ensure rupture of the entire UCA population likely was the same for both Point and Philips UCAs. The secondary group of the Philips UCAs ruptured at a lower pressure in comparison to the majority of the Philips UCAs. This likely was due to manufacturing imperfections that can result in large pores and weaken the integrity of the shell.
The difference in structural integrity of the Point and Philips UCAs likely results from their material properties and STRR. The ratio of critical buckling pressures of Philips and Point UCAs can be obtained from Eq. 2 and can be expressed as
| (4) |
where A is the lumped constant describing the material properties of the shell and χ is the STRR. For agents with shells of similar materials such as these two UCAs, Eq. 4 suggests that a difference in critical pressure might be predominantly due to a difference in STRR of the UCA populations. Because the nominal STRR of the Philips UCAs is 5 times that of the Point UCAs, the measured rupture pressures of the Philips UCAs were expected to be an order of magnitude greater than the Point UCAs. However, similar to the observations made in earlier studies,47 our measured rupture pressures were considerably lower (PPhilips∕PPoint ∼3) than those predicted by classical theory, which is likely due to imperfections in the UCA shells. These imperfections have been well characterized for the Philips UCA using scanning electron microscopy, which shows roughness of the UCA surface and fissures within the shell that are inherent in the manufacturing process.33, 55
Shell imperfections likely invalidate the classical linear elastic theory for quantitatively describing the behavior of rigid UCAs to static overpressure. For instance, the Point UCAs have a nominal STRR of 7.5 nm∕μm.50 Using Eq. 2 and A = 1.21E, the Young’s modulus E for the Point UCA population employed in this study was estimated to be 630 ± 270 MPa. This value is two orders of magnitude greater than that reported by Leong-Poi et al.43 The Young’s modulus similarly estimated for the Philips UCAs (65 ± 9 MPa) in the present study also are inconsistent with those estimated using nanoprobe techniques44 in which polylactide-shelled UCAs of similar compositions (supplied by Point Biomedical), but an STRR of 7.5 nm∕μm, resulted in an E = 1500 MPa. Conversely, if the material properties are known, the STRR could be estimated. For instance, the Philips UCA data resulted in an estimated STRR of 8 nm∕μm based on a Young’s modulus of 1500 MPa. Although 5 times less than the nominal value provided by the manufacturer, this STRR could be the embodiment of all imperfections and pores present in the shell that weaken its integrity.
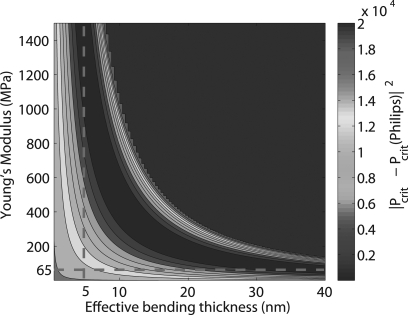
The spherical capsule model (Eq. 3) proposed by Ru49 describes the critical buckling threshold while accounting for an effective shell thickness and non-negligible transverse shear resulting from a nonuniform shell. Figure 8 shows the squared error between the mean rupture pressure of the primary Philips group and the critical buckling pressure predicted by the Ru model (R = 1 μm, STRR = 40 nm∕μm, Gt = 0.5G, G = E∕[2(1 + ν)], ks = 5∕6, ν = 0.4) for a range of values for the Young’s modulus (E) and the effective bending thickness (h0) of the shell. Similar to the comparison of experimental data with the classical linear elastic theory, the Ru model also supports the notion that the shell imperfections result in an effective bending thickness of shell that likely is significantly smaller than the nominal value. Figure 8 illustrates that for a Philips agent with a perfectly spherical shell of 40 nm (h0 = h), the Young’s modulus inferred from the rupture pressure measurement is 65 MPa, which is in agreement with the linear elastic theory. Conversely, the mean rupture pressure of the Philips UCAs and E = 1500 MPa (taken from Ref. 44) results in an effective bending thickness of 5 nm, which is in agreement with the value experimentally inferred using the AFM approach.44 The shell imperfections likely were the primary reason for the inconsistencies between our estimates for E and STRR using the classical linear elastic model and those estimated by Sboros et al.44 This experimental technique may more rigorously characterize the amount of nonuniformity in the shell by fitting the rupture pressures to models such as that proposed by Ru.49
Figure 8.
(Color online) Contour plot of the squared error between the mean rupture pressure of the primary Philips group and the critical buckling pressure predicted by the Ru model for a range of E (Young’s modulus) and effective bending thickness values.
In addition to lowering the threshold for rupture, imperfections in the UCA shell might lead to buckling modes higher than the fundamental mode predicted using the linear elastic assumptions, as evidenced by the anomalous asymmetric rupture observed in 1% of UCAs (Fig. 3a). A theoretical formulation for a sphere with an incompressible hyperelastic shell derived by Hill56 predicted the possibility of different buckling modes depending on the material properties and STRR, and supports the notion that UCAs within the same population (same size, shell composition, and nominal STRR) could rupture in distinctly different manners as observed in this study. For finite elasticity and a constitutive relationship suitable for polymer materials, Hill calculated these buckling modes for spherical shells and showed that the lowest critical pressure between modes2, 3, 4, 5, 6 is sensitive to slight variations in shell thickness. Thus, we attribute the difference illustrated in Fig. 3 to unmeasured, small variations in shell thickness. Further investigation with a high-speed camera is necessary to differentiate and elucidate these likely different buckling modes.
The fragility of the UCAs characterized in this study provides a quantitative measure of the resilience of the UCAs when subjected to overpressure during intravenous administration.57 Furthermore, the quantitative characterization of the static overpressure threshold for UCA rupture provides an insight into how different types of rigid-shelled UCAs would respond to ultrasonic excitation. Bouakaz et al. investigated the response of Point UCAs (similar to the ones employed in the present study) to 10-cycle tone bursts at 1.7 MHz using an ultra-fast camera.27 They determined that the UCAs initially responded in a predominantly “compression-only” manner, which resulted in an acoustically induced buckling or rupture of the UCAs. We also have investigated the response of individual Point and Philips UCAs to high-frequency (40 MHz) 20-cycle tone bursts (not presented); the number of Point UCAs that produced a detectable subharmonic signature (presumably from shell rupture and subsequent nonlinear oscillations of released gas bubbles) was more than 10 times that for the Philips UCAs. The high-frequency pulse echo measurements were qualitatively consistent with the rupture pressures measured for the Point and Philips UCAs. Therefore, the measure of “fragility” of the UCA populations (related to the shell material and STRR) provided by the static pressure experiments are likely related to the incident acoustic pressures necessary for inducing rupture and subsequent nonlinear oscillations of gas bubbles. The static overpressure method for characterization of the fragility of different types of UCAs provides means of selecting UCAs that are optimal for a desired application.
CONCLUSION
The experimental methods presented in this work provide a means to characterize the controlled fragility of a given population of UCAs and to compare this attribute for different types of UCAs, as illustrated by examination of two different polymer-shelled UCAs from either Point Biomedical or Philips Research. The rupture pressure results are consistent with the classical elasticity formulation for buckling of a homogeneous spherical shell which describes the rupture pressures as a function of STTR. These measurements can provide quantitative insight into the material properties of the UCA shell when compared against theoretical models that take shell imperfections into account. The rupture pressure threshold is likely related to the incident acoustic pressures necessary for rupturing polymer-shelled UCAs and subsequently inducing nonlinear oscillations of gas bubbles or delivery of a therapeutic payload. Therefore, the static overpressure method for characterizing the UCA fragility provides a means for optimizing the relevant parameters of the UCA shell for a desired medical application.
ACKNOWLEDGMENTS
This research is supported by National Institutes of Health research grant EB006372 and the Riverside Research Institute Fund for Biomedical Engineering Research. J.S. Allen and M. Böhmer also acknowledge funding from NIH-2G12-RR003016121 and EU-FP7 Sonodrugs NMP-LA-2008-213706, respectively. The authors would like to acknowledge Harriet Lloyd and Justin Rhoda for assistance with data acquisition. The authors wish to thank Point Biomedical and Philips Research for providing the polymer-shelled contrast agents.
References
- Keller M. W., Segal S. S., Kaul S., and Duling B., Circ. Res. 65, 458 (1989). [DOI] [PubMed] [Google Scholar]
- Ophir J. and Parker K. J., Ultrasound Med. Biol. 15, 319 (1989). 10.1016/0301-5629(89)90044-6 [DOI] [PubMed] [Google Scholar]
- Deng C. X. and Lizzi F. L., Ultrasound Med. Biol. 28, 277 (2002). 10.1016/S0301-5629(02)00475-1 [DOI] [PubMed] [Google Scholar]
- Goldberg B. B., Liu J., and Forsberg F., Ultrasound Med. Biol. 20, 319 (1994). 10.1016/0301-5629(94)90001-9 [DOI] [PubMed] [Google Scholar]
- Calliada F., Campani R., Bottinelli O., Bozzini A., and Sommaruga M. G., Eur. J. Radiol. 27, S157 (1998). 10.1016/S0720-048X(98)00057-6 [DOI] [PubMed] [Google Scholar]
- Goertz D. E., Frijlink M. E., de Jong N., and van der Steen A., Ultrasound Med. Biol. 32, 491 (2006) 10.1016/j.ultrasmedbio.2006.01.001 [DOI] [PubMed] [Google Scholar]
- Bouakaz A., Frigstad S., Ten Cate F. J., and de Jong N., Ultrasound Med. Biol. 28, 59 (2002). 10.1016/S0301-5629(01)00460-4 [DOI] [PubMed] [Google Scholar]
- Shankar P. M., Krishna P. D., and Newhouse V. L., J. Acoust. Soc. Am. 106, 2104 (1999). 10.1121/1.428142 [DOI] [PubMed] [Google Scholar]
- Shankar P. M., Krishna P. D., and Newhouse V. L., Ultrasound Med. Biol. 24, 395 (1998). 10.1016/S0301-5629(97)00262-7 [DOI] [PubMed] [Google Scholar]
- Harland C. C., Bamber J. C., Gusterson B. A., and Mortimer P. S., Br. J. Dermatol. 128, 525 (1993). 10.1111/j.1365-2133.1993.tb00229.x [DOI] [PubMed] [Google Scholar]
- Gupta A. K. E. A., Dermatol. Surg. 22, 131 (1996). 10.1016/1076-0512(95)00295-2 [DOI] [PubMed] [Google Scholar]
- Deng C. X., Lizzi F. L., Silverman R. H., and Ursea R., and Coleman D. J., Ultrasound Med. Biol. 24, 383 (1998). 10.1016/S0301-5629(97)00288-3 [DOI] [PubMed] [Google Scholar]
- Turnbull D. H. and Foster F. S., Trends Biotechnol. 20, 179 (2002). 10.1016/S0167-7799(02)02003-6 [DOI] [Google Scholar]
- Foster F. S., Zhang M. Y., Zhou Y. Q., Liu G., Mehi J., Cherin E., Harasiewicz K. A., Starkoski B. G., Zan L., Knapik D. A., and Adamson S. A., Ultrasound Med. Biol. 28, 1165 (2002). 10.1016/S0301-5629(02)00567-7 [DOI] [PubMed] [Google Scholar]
- Qin S., Caskey C., and Ferrara K., Phys. Med. Biol. 54, 27 (2009). 10.1088/0031-9155/54/6/R01 [DOI] [PMC free article] [PubMed] [Google Scholar]
- Schneider M., Echocardiography 17, s11 (2000). 10.1111/j.1540-8175.2000.tb01189.x [DOI] [PubMed] [Google Scholar]
- Martina A. D., Meyer-Wiethe K., Allemann E., and Seidel G., J. Neuroimaging 15, 217 (2005). 10.1111/j.1552-6569.2005.tb00314.x [DOI] [PubMed] [Google Scholar]
- Senior R., Monaghan M., and Main M. L. E. A., Eur. J. Echocardiography 10, 26 (2009). 10.1093/ejechocard/jen321 [DOI] [PubMed] [Google Scholar]
- Liu Y., Miyoshi H., and Nakamura M., J. Controlled Release 114, 89 (2006). 10.1016/j.jconrel.2006.05.018 [DOI] [PubMed] [Google Scholar]
- Sboros V., Adv. Drug Delivery Rev. 60, 1117 (2008). 10.1016/j.addr.2008.03.011 [DOI] [PubMed] [Google Scholar]
- Ferrara K., Pollard R., and Borden M., Annu. Rev. Biomed. Eng. 9, 415 (2007). 10.1146/annurev.bioeng.8.061505.095852 [DOI] [PubMed] [Google Scholar]
- Unger E. C., Matsunaga T. O., McCreery T., Schumann P., Sweitzer R., and Quigley R., Eur. J. Radiol. 42, 160 (2002). 10.1016/S0720-048X(01)00455-7 [DOI] [PubMed] [Google Scholar]
- Klibanov A. L., Invest. Radiol. 41, 354 (2006). 10.1097/01.rli.0000199292.88189.0f [DOI] [PubMed] [Google Scholar]
- Böhmer M. R., Klibanov A. L., Tiemann K., Hall C. S., Gruell H., and Steinbach O. C., Eur. J. Radiol. 70, 242 (2009). 10.1016/j.ejrad.2009.01.051 [DOI] [PubMed] [Google Scholar]
- van der Meer S. M., Dollet B., Voormolen M. M., Chin C. T., Bouakaz A., de Jong N., Versluis M., and Lohse D., J. Acoust. Soc. Am. 121, 648 (2007). 10.1121/1.2390673 [DOI] [PubMed] [Google Scholar]
- Bloch S. H., Wan M., Dayton P. A., and Ferrara K. W., Appl. Phys. Lett. 84, 631 (2004). 10.1063/1.1643544 [DOI] [Google Scholar]
- Bouakaz A., Versluis M., and de Jong N., Ultrasound Med. Biol. 31, 391 (2005). 10.1016/j.ultrasmedbio.2004.12.004 [DOI] [PubMed] [Google Scholar]
- Bloch S. H., Short R. E., Ferrara K. W., and Wisner E. R., Ultrasound Med. Biol. 31, 439 (2005). 10.1016/j.ultrasmedbio.2004.12.016 [DOI] [PubMed] [Google Scholar]
- Talu E., Hettiarachchi K., Zhao S., Powell R. L., Lee A. P., Longo M. L., and Dayton P. A., Molec. Imaging 6, 384 (2007). [PMC free article] [PubMed] [Google Scholar]
- Narayan P. and Wheatley M. A., Polym. Eng. Sci. 39, 2242 (1999). 10.1002/pen.v39:11 [DOI] [Google Scholar]
- Bjerknes K., Sontum P. C., Smistad G., and Agerkvist I., Int. J. Pharmaceutics 158, 129 (1997). 10.1016/S0378-5173(97)00228-7 [DOI] [Google Scholar]
- Böhmer M. R., Schroeders R., Steenbakkers J. A., de Winter S. H., Duineveld P. A., Lub J., Nijssen W. P., Pikkemaat J. A., and Stapert H. R., Colloids Surf., A 289, 96 (2006). 10.1016/j.colsurfa.2006.04.011 [DOI] [Google Scholar]
- Kooiman K., Böhmer M. R., Emmer M., Vos H. J., Chlon C., Shi W. T., Hall C. S., de Winter S., Schron K., Versluis M., de Jong N., and van Wamel A., J. Controlled Release 133, 109 (2009). 10.1016/j.jconrel.2008.09.085 [DOI] [PubMed] [Google Scholar]
- Böhmer M., Chlon C., Raju B., Chin C., Shevchenko T., and Klibanov A., “Focused ultrasound and microbubbles for enhanced extravasation,” J. Controlled Release (in press). [DOI] [PMC free article] [PubMed]
- Shi W., Böhmer M., de Winter S., Steenbakkers J., Emmer M., van Wamel A., de Jong N., and Hall C., in Ultrasonics Symposium, 2006, Vancouver, BC: (IEEE, 2006) pp. 301–304. [Google Scholar]
- Ketterling J. A., Mamou J., Allen, Aristizáébal J. S. O., Williamson R. G., and Turnbull D. H., J. Acoust. Soc. Am. 121, EL48 (2007). 10.1121/1.2401270 [DOI] [PMC free article] [PubMed] [Google Scholar]
- Mamou J. and Ketterling J. A., J. Acoust. Soc. Am. 125, 4078 (2009). 10.1121/1.3117384 [DOI] [PMC free article] [PubMed] [Google Scholar]
- Marmottant P., van der Meer S., Emmer M., Versluis M., de Jong N., Hilgenfeldt S., and Lohse D., J. Acoust. Soc. Am. 118, 3499 (2005). 10.1121/1.2109427 [DOI] [Google Scholar]
- Church C. C., J. Acoust. Soc. Am. 97, 1510 (1995). 10.1121/1.412091 [DOI] [Google Scholar]
- De Jong N., Frinkning P. J., Bouakaz A., Goorden M., Schourmans T., Xu J., and Mastik F., Ultrasound Med. Biol. 26, 487 (2000). 10.1016/S0301-5629(99)00159-3 [DOI] [PubMed] [Google Scholar]
- Sboros V., Moran C. M., Pye S. D., and McDicken W. N., Ultrasound Med. Biol. 29, 687 (2003). 10.1016/S0301-5629(03)00027-9 [DOI] [PubMed] [Google Scholar]
- Shi W. T. and Forsberg F., Ultrasound Med. Biol. 26, 93 (2000). 10.1016/S0301-5629(99)00117-9 [DOI] [PubMed] [Google Scholar]
- Leong-Poi H., Song J., Rim S., Christiansen J., Kaul S., and Lindner J. R., J. Am. Soc. Echocardiography 15, 1269 (2002). 10.1067/mje.2002.124516 [DOI] [PubMed] [Google Scholar]
- Sboros V., Glynos E., Pye S. D., Moran C. M., Butler M., Ross J. A., McDicken W. N., and Koutsos V., Ultrasonics 46, 349 (2007). 10.1016/j.ultras.2007.06.004 [DOI] [PubMed] [Google Scholar]
- Libai A. and Simmonds J. G., The Nonlinear Theory of Elastic Shells: One Spatial Dimension (Academic, New York, 1988). [Google Scholar]
- Fok S. L. and Allwright D. J., J. Strain Anal. 36, 535 (2001). 10.1243/0309324011514692 [DOI] [Google Scholar]
- Kaplan A., in Thin-shell Structures: Theory, Experiment And Design, edited by Fung Y. C. and Sechler E. E., (Prentice Hall, New York, 1974). [Google Scholar]
- Vinson J. R., Beams, Plates and Shells, edited by Nijhoff M.(Kluwer Academic Publishers, Dordrecht, 1989). [Google Scholar]
- Ru C. Q., J. Appl. Phys 105, 1 (2009). 10.1063/1.3141753 [DOI] [Google Scholar]
- Ottoboni T. B., Tickner E. G., Short R. E., and Yamamoto R. K., US Patent US 6776761 B2. (2004).
- Pratt W. K., Digital Image Processing (John Wiley, New York, 1989) pp. 330–333. [Google Scholar]
- Kittler J., Image Vision Comput. 1, 37 (1983). 10.1016/0262-8856(83)90006-9 [DOI] [Google Scholar]
- Yuen H. K., Princen J., Illingworth J., and Kittler J., Image Vision Comput. 8, 71 (1990). 10.1016/0262-8856(90)90059-E [DOI] [Google Scholar]
- Seber G. A. F., Multivariate Observations (John Wiley, New York, 1984). [Google Scholar]
- Chlon C., Gudon C., Verhaagen B., Shi W. T., Hall C. S., Lub J., and Böhmer M. R., Biomacromolecules 10, 1025 (2009). 10.1021/bm801243u [DOI] [PubMed] [Google Scholar]
- Hill J. M., Quart. Mech. Appl. Math. 29, 179 (1976). 10.1093/qjmam/29.2.179 [DOI] [Google Scholar]
- Barrack T. and Stride E., Ultrasound Med. Biol. 35, 515 (2009). 10.1016/j.ultrasmedbio.2008.07.008 [DOI] [PubMed] [Google Scholar]


