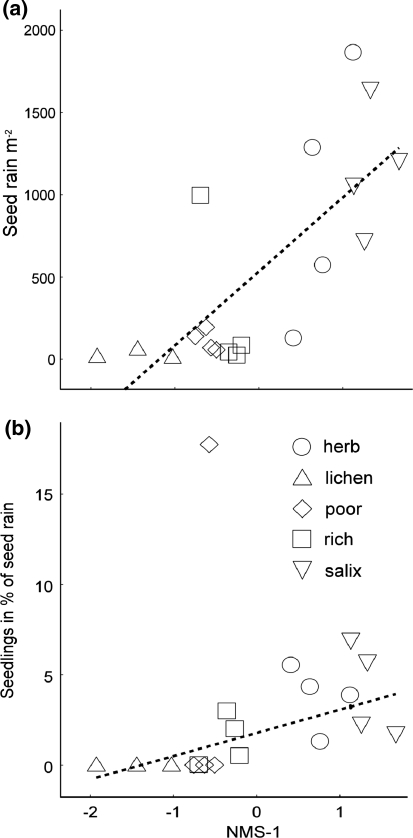
Fig. 2.
Relationships between the multivariate environmental gradient (NMS-1) and a seed rain and b the proportion of the seed rain that emerged as spontaneous seedlings. Data for each community type are indicated by symbols. Linear regression lines shown a r 2 = 0.55, P = 0.0004, n = 19, and b r 2 = 0.48, P = 0.0014, n = 18 (excluding one outlier)

