

Abstract
The pathogenesis of breast cancer involves multiple genetic and epigenetic events. In this study, we report an epigenetic alteration of DFNA5 in human breast cancer. DFNA5 gene was silenced in breast cancer cell lines that were methylated in the DFNA5 promoter, and restored by treatment with the demethylating agent, 5-aza-dC, and gene knock-down of DFNA5 increased cellular invasiveness in vitro. The mRNA expression of DFNA5 in breast cancer tissues was down-regulated as compared to normal tissues. Moreover, the DFNA5 promoter was found to be methylated in primary tumor tissues with high frequency (53%, 18/34). Quantitative methylation-specific PCR of DFNA5 clearly discriminated primary breast cancer tissues from normal breast tissues (15.3%, 2/13). Moreover, methylation status of DFNA5 was correlated with lymph node metastasis in breast cancer patients. Our data implicate DFNA5 promoter methylation as a novel molecular biomarker in human breast cancer.
Keywords: DFNA5, The human deafness, Autosomal dominant 5 gene, Promoter methylation, Breast cancer
Although breast cancer mortality declined significantly in recent years, in part due to early diagnosis by screening mammography, the limitations of mammography are well-recognized [1,2]. Therefore, novel approaches for the early detection of breast cancer are necessary. The pathogenesis of breast cancer involves multiple genetic and epigenetic events. In spite of recent advances in the assessment of breast cancer risk, the identification of crucial susceptibility genes such as BRCA1/2, PTEN, and p53 account for only about 5% of all breast cancer cases [3]. The marked cytogenetic complexity seen in advanced breast cancer precludes investigators from readily identifying primary causative genetic and epigenetic events in breast cell carcinogenesis [4].
Aberrant gene expression is a characteristic of human cancers, and change in DNA methylation status can have profound effects on the expression of genes. Tumor suppressor genes (TSGs) display both genetic and epigenetic inactivation in human tumors, and the transcriptional silencing of TSGs has established hypermethylation as a common mechanism for loss of TSG function in human cancer [5]. Thus, knowledge of methylation patterns across the genome can help to identify key TSGs inactivated during tumor formation. A number of TSGs have been identified and tested in breast cancer (APC, GSTP1, RARβ-2, and Rassf1A) [6].
DFNA5 (the human deafness, autosomal dominant 5 gene at chromosome 7p15) causes an autosomal dominant form of hearing impairment when mutated [7]. An intronic insertion and/or mutation lead to premature termination of the protein, resulting in non-syndromic progressive hearing loss [8]. In breast cancer, DFNA5 expression was lower in estrogen receptor (ER)-positive than ER-negative tumors [9]. In addition, increased expression of DFNA5 confers elevated cellular susceptibility to trigger a caspase-3-dependent apoptotic signal pathway in melanoma cells exposed to etoposide [10]. These results suggest that the DFNA5 may play roles in melanoma and breast cancer progression and perhaps resistance to chemotherapy.
Recently, we performed a combination of pharmacological unmasking and oligonucleotide microarray analysis in colon cancer cell lines [11]. The analysis enabled us to find novel methylated genes including DFNA5 in CRC cell lines and primary CRC tissues. In this study, we used a quantitative DNA methylation assay (Taq-Man-MSP) to examine the aberrant methylation of DFNA5 in primary breast cancer tissues and cell lines. We found that DFNA5 exhibited epigenetic activation at high frequency in human breast cancer. DFNA5 promoter was frequently methylated and its expression was down-regulated in primary breast cancer. In addition, the methylation status of DFNA5 correlated with lymph node metastasis in breast cancer patients.
Materials and methods
Cell lines and tissues
MCF-12A and Hs.578T were kindly provided by Dr. Nancy Davidson at the Johns Hopkins University, and the other cell lines were obtained from the ATCC (Manassas, VA). HEK293 and breast cancer cell lines were grown in DMEM supplemented with 10% fetal bovine serum. MCF-12A and MCF-10A, were grown as recommended by ATCC.
Primary breast normal and tumor tissues were obtained from patients with breast cancer who underwent surgery at the Medical Institute of Bioregulation Hospital, Kyushu University. Among them, 13 cases had pairs of normal (PN) and tumor (PT) tissues and the other 21 cases (UnPT) were tumors only. Each tumor used in this study was determined to contain greater than 70% tumor cells by H&E staining. Twenty-six of 34 cases of breast cancer had clinico-pathological data, and were included in the statistical analysis. The PN were obtained at least 5 cm away from the tumor edge by sharply dissecting the tissues off breast epithelial tissues. As the PN was obtained from adjacent normal mammary glands of cancer specimens, there was a possibility of contamination with that occult cancer cells. Seven normal breast epithelial tissues (NN) were obtained from patients without breast cancer at the Surgical Pathology archives of the Johns Hopkins Hospital. All specimens were quick-frozen in liquid nitrogen and stored at −80 °C until processing.
RT-PCR analysis
Cells were treated with 5 μM 5-aza-2′-deocycytidine (5-aza-dC) (Sigma, St. Louis, MO) every 24 h for 3 days. RT-PCR was performed with the primers specific for DFNA5 transcript as described [11].
Real-time RT-PCR
Matched and unmatched breast normal and tumor cDNAs were purchased from BioChain Institute (Hayward, CA), and used for the assay using QuantiFast SYBR Green PCR Kit (Promega, Valencia, CA) as described [11]. Expression of DFNA5 mRNA relative to GAPH was calculated based on the threshold cycle (Ct) as 2−Δ(ΔCt), where ΔCt= Ct,DFNA5 − Ct,GAPDH and Δ(ΔCt) = ΔCt,N − ΔCt,T (N, normal tissue cDNA, T, tumor tissue cDNA).
Cancer profiling array
To examine DFNA5 expression in matched human breast normal and tumor tissues, a cDNA membrane (Cancer Profiling Array II) was purchased from BD Biosciences (San Jose, CA), and the protocol was followed according to the manufacturer's recommendation. Full-length DFNA5 cDNA was PCR-amplified, gel-purified and radio-labeled using Amersham Megaprime DNA labeling system (GE Healthcare, Piscataway, NJ) and [P32]dCTP (Perkin Elmer, Waltham, MA) according to the user manual. Ubiquitin cDNA was used as a control.
Bisulfite-sequencing
Amplification of bisulfite-modified genomic DNA with the primers specific for DFNA5 and sequencing of PCR products were performed as described [11]. When methylation is found in more than 50% of total CGs in amplified PCR products, it is considered as “methylation-positive”. When methylated and unmethylated alleles are observed in chronographic pictures of sequencing, it is considered as “partial methylation (M/U). Search for CpG islands in the DFNA5 gene promoter was done by using the online accessible software (Methprimer).
Quantitative methylation-specific PCR (TaqMan-MSP)
Primers and protocols for TaqMan-MSP were performed as reported [11]. The methylation ratio was defined as the quantity of fluorescence intensity derived from the DFNA5 promoter amplification divided by fluorescence intensity from β-actin amplification, and multiplied by 100 (TaqMan methylation value: TaqMeth V). This ratio was used as a measure for the relative level of methylated DFNA5 DNA in samples. The samples were categorized as unmethylated or methylated based on the sensitivity of the assay.
Knock-down of DFNA5 and chemoinvasion assay
Two individual siRNAs targeting DFNA5 gene and non-targeting control siRNA were purchased from Dharmacon (Chicago, IL). Transfection procedure was followed as reported [11]. Twenty-four hours after transfection, cells were incubated in complete growth medium for further 48 h. Cell were re-seeded at a density of 1 × 10³/well of BioCoat invasion chambers (BD Biosciences, San Jose, CA) and incubated for 16 h. Simultaneously, equal number of cells was seeded on 24-well plates, incubated for 16 h, and MTT assay was performed. Gene knock-down was confirmed by RT-PCR as described [11].
Colony focus assay and cell growth assay
MDA-MB-231 or MCF-10A cells (1−2 × 10³/well in 6-well plates) were transfected with siRNAs and incubated for 12 days after addition of growth medium, and colony focus assay was then performed as reported [11]. For cell growth assay, cells were seeded at a density of 3 × 10³/well in 96-well plates and the MTT assay was performed at indicated time points. The results were expressed as an absorbance at 570 nm wavelength.
Statistical analysis for clinical correlation
The optimal cut-off value (0.81) for methylation positivity of DFNA5 genes in the TaqMan assay was determined by receiver operating characteristic (ROC) curves, and samples with TaqMeth V, 0.81 or higher were designated as methylated and given a value of 1 for statistical analysis, whereas samples with TaqMeth V below 0.81 were designated as unmethylated and given a value of 0. Contingency tables followed by the Chi-square test were used to determine if high or low levels of DFNA5 methylation were associated with clinical parameters. All P values are based on two-sided. The significance level used was 0.05 and all statistical analyses were conducted using STATA Version 9 (STATA Inc., College Station, TX).
Results
Down-regulation of DFNA5 in human breast cancer
To examine the transcriptional level of DFNA5, RT-PCR analysis was performed using cDNA prepared from MCF-12A non-malignant breast epithelial cell line or three breast cancer cell lines. Methylation of these cells was examined by the bisulfite-sequencing. DFNA5 was silenced only in cell lines that harbored methylation of DFNA5 (Fig. 1A). DFNA5 expression was observed in another non-tumorigenic cell lines, HEK293 and MCF-10A in which methylation of DFNA5 was not found. Re-expression of DFNA5 after 5-aza-dC treatment was found in all cell lines tested, indicating that the expression of DFNA5 is strictly correlated with promoter methylation.
Fig. 1.

Transcriptional level of DFNA5 in breast cancer. (A) RT-PCR analysis was performed using cDNA from MCF-12A, MCF-7, BT-20, and MDA-MB-231 in addition to HEK293 and MCF-10A. β-Actin expression is a loading control. m (mock), no treatment; a, 5-aza-dC treatment; M, methylated; U, unmethylated. (B) Real-time-PCR was performed using cDNA from normal (PN) and tumor (PT) tissue of a breast cancer patient (matched cDNA) (a) or normal breast tissue cDNA from a patient without cancer (NN) and tumor cDNA from a breast cancer patient (T) (unmatched cDNA) (b). Fold induction was calculated by expression of DFNA5 mRNA to GAPDH. (c) The amplification plot of DFNA5 expression in the unmatched cDNA. (C) A cancer profiling array. Full-length DFNA5 was used as a probe for hybridization. The expression of DFNA5 (left) was compared by ubiquitin expression (right) per manufacturer's recommendation. *Down-regulation of DFNA5 in tumor cases compared to corresponding normal tissues. #No difference between tumor and normal cases. Arrow, up-regulation of DFNA5 in tumor cases.
Real-time-PCR was performed in cDNA in normal and tumor tissue cDNA of a breast cancer patient (matched cDNA) (Fig. 1B-a). The expression level of DFNA5 in tumor (PT) was lower than in normal tissue (PN) (P = 0.003). In comparison between a patient with breast cancer (T) and without cancer (NN), the DFNA5 expression in breast cancer was 60 times lower than in NN (P = 0.002) (Fig. 1B-b). The amplification plot of DFNA5 expression in these tissues is shown in Fig. 1B-c. The DFNA5 expression was also examined using a cancer profiling array including normalized cDNA from tumor and corresponding normal tissues from 10 individual breast cancer patients (Fig. 1C). DFNA5 expression was clearly detected in most corresponding normal tissues (PN) in the array, and down-regulated in 50% of tumor cases (PT), suggesting a specific decrease of DFNA5 in breast cancer.
Promoter hypermethylation of DFNA5 in breast cancer
Representative sequencing results of DFNA5 in breast cancer cell lines and tissues are shown in Supplemental Fig. 1. DFNA5 methylation was investigated by TaqMan-MSP analysis in 13 pairs of breast normal (PN) and tumor tissues (PT) as well as MCF-12A and breast cancer cell lines. Seven normal breast epithelial tissues from the non-cancer patients (NN) and 21 breast tumor tissues (UnPT) were also included to compare methylation specificity between cancer and non-cancer patients. Standard curves for DFNA5 and β-actin amplification were generated using serially diluted, bisulfite-converted human lymphocyte DNA, and showed linearity over the range used (Supplemental Fig. 2). Typical real-time-MSP curves were generated for cell lines, tumor and normal tissues (Fig. 2). To get a sensitivity of the TaqMan-MSP, a mixing analysis was performed with cell lines that were methylation-positive (MCF-7 and BT-20) and -negative (MBD-MA-231, MCF-12A, Hs780, and Hs.578T) determined by the bisulfite-sequencing analysis. A threshold (1.0) was chosen at the ΔRn level discriminating these two types of cell lines in the amplification plot (Fig. 2A). Based on the threshold, the amplification of methylated DFNA5 DNA was not determined in four cell lines (MBD-MA-231, Hs780, and Hs.578T and MCF-12A) (Fig. 2A). No obvious DFNA5 methylation level was observed in NN samples (Fig. 2B), while two of 13 PN did amplify (Fig. 2C). Amplification of methylated DFNA5 was found in seven of 13 PT and 11 of 21 UnPT samples (Fig. 2D and E).
Fig. 2.
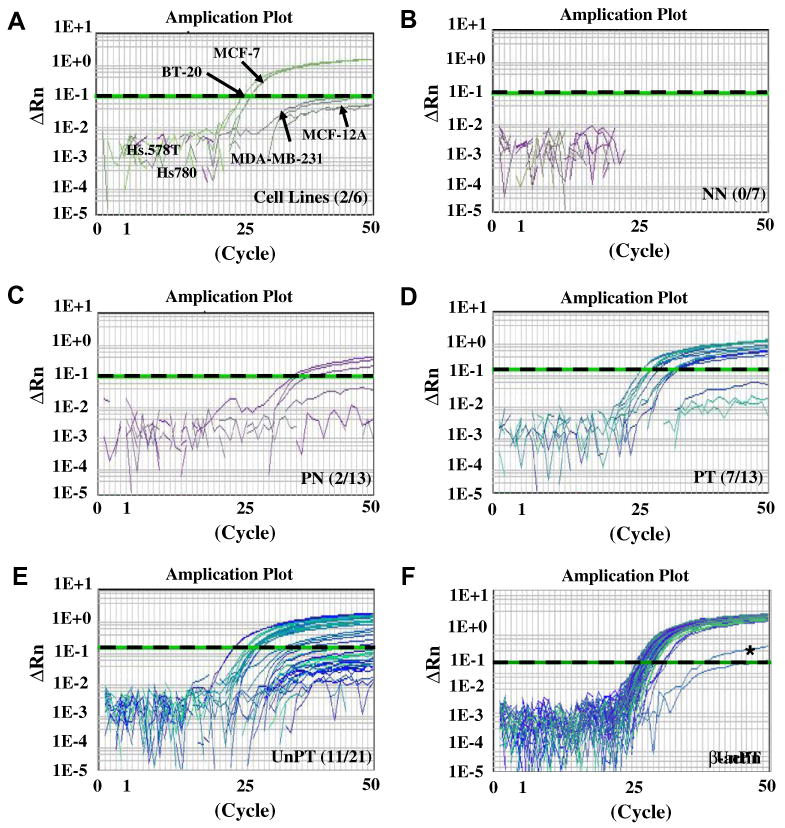
Promoter hypermethylation of DFNA5 in breast cancer. DFNA5 methylation was investigated by TaqMan-MSP analysis. Real-time-MSP curves in breast cell lines (A), NN (B), PN (C), PT (D), and UnPT (E) were generated. A threshold (1.0) was chosen at the ΔRn level to discriminate methylated and unmethylated DFNA5 DNA (dash line). Number of samples that were over the threshold is indicated in each plot. Amplification curves of β-actin in all samples tested is shown in (F).
The methylation ratio was calculated with β-actin level, an internal reference standard, to measure the relative levels of DFNA5 methylation (TaqMeth V). The TaqMeth V of DFNA5 was used to construct receiver operating characteristic (ROC) curves. Using this approach, the AUROC (Area under ROC) identified optimal sensitivity and specificity levels (i.e., cut-offs) to distinguish normal from malignant breast tissue. Methylation of DFNA5 showed significantly discriminative ROC curve profiles, clearly distinguishing breast cancer from PN (AUROC, 0.7353; P < 0.001) or NN (AUROC, 0.7647; P < 0.001) (Fig. 3). The optimal cut-off (value, 0.81) was calculated from the ROC curve (T vs. PN) in order to maximize sensitivity and specificity, and applied to determine the frequency of DFNA5 methylation. The scatter plot of TaqMeth V of DFNA5 is shown in Fig. 3. No NN (0%) and two out of 13 PN samples (15.3%) displayed TaqMeth V above the cut-off. Eighteen of 34 breast cancer tissues (PT+UnPT) displayed TaqMeth V over the value 0.81 (53%) (P = 0.006, Chi-square test) (Table 1) whereas the methylation of all remaining 16 cases of breast cancer tissues was undetectable. High levels of DFNA5 promoter methylation were found in MCF-7 and BT-20.
Fig. 3.
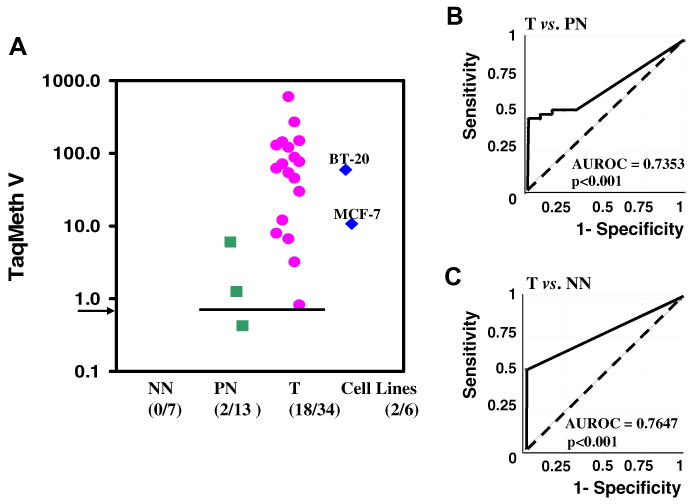
Quantitative level of DFNA5 promoter methylation. (A) The scatter plot of TaqMeth V of DFNA5. Arrow, a cut-off value of 0.81. Samples with a ratio equal to zero could not be plotted correctly on a log scale, so are presented here as 0.001. TaqMeth V is described in Materials and methods. (B,C) ROC curves of DFNA5 methylation for the detection of breast cancer. The optimal cut-off (value, 0.81) was calculated from the ROC curve (T vs. PN) in order to determine the frequency of DFNA5 methylation. Solid line, DFNA5; dash line, no discrimination.
Table 1. Sensitivity and specificity of DFNA5 promoter methylation.
| Cut-off value | % Sensitivity | % Specificity | P valuea | TaqMeth V | ||
|---|---|---|---|---|---|---|
| T | N | P valueb | ||||
| 0.1 | 53 (18/34) | 77 (10/13) | 0.023 | |||
| 0.81 | 53 (18/34) | 85 (11/13) | 0.006 | 54.27 ± 113.53 | 0.59 ± 1.66 | 0.0094 |
| 10 | 41 (14/34) | 100 (13/13) | 0.001 | |||
Sensitivity, positive methylation/total tumor cases; specificity, negative methylation/total normal cases.
Note. TaqMeth V is expressed as means ± SD.
P value was calculated from the Chi-square test.
P value was derived from the Student's t-test.
The cut-off lines of TaqMeth V from 0.1 to 10 were all statistically significant for the Chi-square test (PN vs. PT + UnPT and methylation vs. unmethylation cases). At the cut-off with 100% specificity, the sensitivity of DFNA5 methylation was 41% (Table 1). The TaqMeth V in tumor ranged from 0 to 596.14 (median value 1.97), and in normal breast from 0 to 5.97 (median value 0). The overall TaqMeth V levels detected in PT (53.27 ± 113.53, means ± SD) were also significantly higher than those in PN (0.59 ± 1.66, means ± SD) (P = 0.0094, Student's t-test). Taken together, DFNA5 was frequently methylated in primary breast cancer tissues but at minimal levels in corresponding normal tissues.
Correlation between DFNA5 methylation breast cancer metastasis
Twenty six breast cancers with clinico-pathological variables were analyzed for clinical contribution of DFNA5 methylation to tumor aggressiveness. A significant correlation for the Chi-square test was found between methylation of DFNA5 and lymph node metastasis in breast cancer patients (P = 0.001) (Table 2). No significant association was found between the DFNA5 methylation status and other clinical features including histologic grade (well-moderate/poor) and ER status.
Table 2. Clinico-pathologic variables and DFNA5 methylation in primary breast cancer.
| DFNA5 TaqMan methylaiton analysis | ||||
|---|---|---|---|---|
| M+n = 12 | M−n = 14 | P value | UC | |
| Age (years) | 54.5 ± 10.7 | 52.9 ± 27.2 | ||
| Differentiation | 1.000 | 2 | ||
| Well and moderately | 8 | 8 | ||
| Poorly | 4 | 4 | ||
| Lymph node metastasis | 0.001* | 5 | ||
| Absence | 2 | 11 | ||
| Presence | 7 | 1 | ||
| Lymphatic permeation | 0.305 | 3 | ||
| Absence | 4 | 6 | ||
| Presence | 8 | 5 | ||
| Vacsular permeation | 0.315 | 5 | ||
| Absence | 9 | 10 | ||
| Presence | 3 | 1 | ||
| Estrogen receptor | 0.219 | |||
| Absence | 8 | 5 | ||
| Presence | 4 | 7 | ||
| Progesteron receptor | 0.673 | |||
| Absence | 8 | 7 | ||
| Presence | 4 | 5 | ||
| Tumor size | 0.750 | |||
| <2 cm | 2 | 3 | ||
| >2 cm | 10 | 11 | ||
| TNM staging | 0.208 | |||
| Stage I and II | 9 | 13 | ||
| Stage III and IV | 3 | 1 | ||
Note. Some patients did not have clinical information.
#UC = number of patients that the clinical variables indicated were uncharaterized.
Age was shown as means ± SD in each group with (M+) or without methylation (M−).
Chi-square test for age was not performed in this study.
Methylation positivity (M+) and negativity (M−) were based on TaqMeth V at a cutoff value 0.81. M+, TaqMeth V over 0.81; M−, TaqMeth V below 0.81.
LNM determined by surgeons.
P value was calculated from the Chi-square test.
Significant (P < 0.05).
Gene knock-down of DFNA5 increases cellular invasive activity and growth
In vitro cell invasion assay was performed in MDA-MB-231 cells after transfection of two individual siRNAs targeting DFNA5 and a non-targeting control. As shown in Fig. 4A, the number of cells passing into the chamber increased about 5- and 3-fold in the cells transfected with siRNA-DFNA5-#1 and #2, respectively, compared to control. Increases of colony numbers was also observed in the cells with knock-down of DFNA5 (MDA-MB-231 and MCF-10A) (Fig. 4B and C). Colony size in DFNA5 siRNA-transfected MDA-MB-231 cells was two to three times bigger than that in control (data not shown). Cell growth in MDA-MB-231 also increased after transfection of DFNA5 siRNAs (Fig. 4D).
Fig. 4.
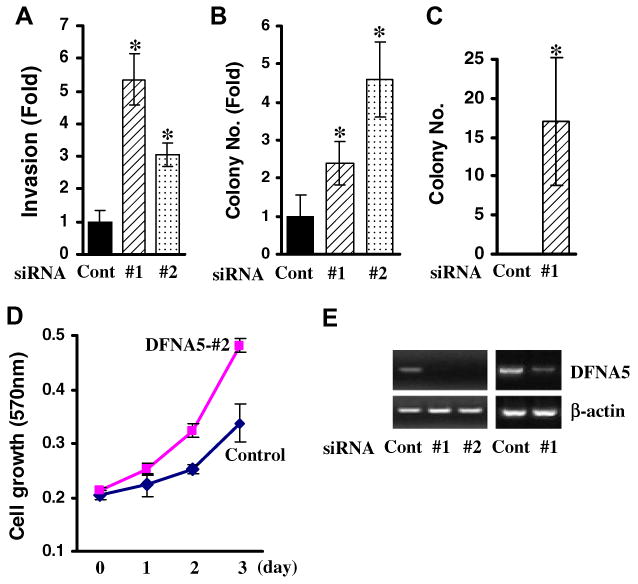
Gene knock-down of DFNA5 in MDA-MB-231 and MCF-10A. (A) Gene knock-down of DFNA5 increased the number of invading cells. Cell growth for 16 h determined by MTT assay was not significant (data not shown). Cont, control. Colony focus assay was performed after transfection of DFNA5 siRNAs into MDA-MB-231 (B) or MCF-10A (C). No colonies from control siRNA-transfected MCF-10A cells were observed. Values are expressed as means ± SD and are derived from two independent experiments done in triplicate. *P < 0.05. (D) Cell growth in MDA-MB-231 after transfection of DFNA5 siRNA-#2. MTT assay results are expressed as absorbance (570 nm), and experiments were performed twice in triplicate. (E) Since no commercial anti-DFNA5 antibody is currently available, gene knock-down was confirmed by RT-PCR in each cell line. Left, MDA-MB-231, Right, MCF-10A. β-actin was used as a loading control.
Discussion
We previously identified candidate methylated genes in human cancers [11,12], and DFNA5 remains a gene of particular interest. In this study, the DFNA5 promoter was found to be frequently methylated in primary breast cancer tissues compared to corresponding normal tissues or normal breast tissues from patients without cancer. The level of methylation of DFNA5 was much higher in tumor than in normal tissues and correlated with expression levels. The optimal cut-off calculated from the ROC curve was reliable for detection of DFNA5 methylation since the population of primary tumor tissues was well discriminated from normal tissues by the quantitative analysis of the gene. This result suggests that DFNA5 should be studied further as a diagnostic marker for breast cancer. In addition, the frequency of DFNA5 methylation in metastasis-positive cancer tissues was higher than that in metastasis-negative tissues. Therefore, DFNA5 methylation may identify patients at increased risk of lymph node metastasis in breast cancer. Since the in vitro invasion of MDA-MB-231 cells was increased by knock-down of DFNA5, DFNA5 methylation may modulate the metastatic potential of breast cancer cells in vivo.
The inverse correlation of DFNA5 methylation and metastasis is not likely to be a common event in all types of cancer. It was reported that methylation of the DFNA5 gene was less frequently associated in metastatic gastric cancers [13]. Among the eight regions (A–H) analyze in the study, cancer-specific methylation was found only in region C at the first exon downstream of the TSS. Methylation of the region C was thus applied for statistical correlation of clinical variables in gastric cancer. It is not clear whether the discrepancy is because of the different promoter regions of DFNA5 analyzed in our study (the first CG island upstream TSS) [11]. Further studies will be necessary to determine precisely the association of cancer metastasis and DFNA5 methylation in human cancer.
This study demonstrated that quantification of DFNA5 methylation may be a useful tool for detection of several cancers. Aberrant methylation of DFNA5 was detected in 54% (17/31) of primary gastric cancer but only in 9% (1/11) of normal gastric tissues from cancer patients at an optimal cut-off value, 1 (data not shown). The result was almost the same as that of Akino et al. who found the gene methylation in 52% of primary gastric cancers by combined bisulfite-restriction analysis (COBRA) [13]. A use of real-time PCR technology further enhances the approach as a powerful tool in molecular detection of human cancer. It is intriguing that methylated DNA was recently detected by using quantitative real-time MSP in urine and plasma samples from patients with breast and prostate cancer [6,16]. Thus, detection of DFNA5 methylation by quantitative real-time MSP in body fluids could also be useful for identifying individuals with cancer.
In this study, an inverse correlation of DFNA5 expression was found between ER-positive (MCF-7 and BT-20) and ER-negative breast cancer cell lines (MBD-MA-231) as reported [9]. The basal expression of DFNA5 in CRC cell lines (HCT116, HT29, DLD-1, and SW480) was also undetectable or very low [11], but these CRC cell lines express ER mRNA (β-isoform) [14,15]. Interestingly, DFNA5 methylation was found only in ER-positive cell lines. These results suggest that ER might negatively regulate DFNA5 expression by epigenetic alterations of the DFNA5 gene promoter in breast cancer. Further study is needed to reveal the mechanisms by which ER can regulate DFNA5 expression in human breast cancer.
In summary, frequent methylation of the DFNA5 promoter in primary human breast cancer associated with minimal or absent expression was demonstrated. Moreover, the methylation status of DFNA5 correlated with lymph node metastasis in breast cancer patients. These data support further studies of this novel biomarker in human breast cancer, particularly in the area of diagnosis and clinical outcome.
Supplementary Material
Footnotes
Under a licensing agreement between OncoMethylome Sciences, SA and the Johns Hopkins University, Dr. Sidransky is entitled to a share of royalty received by the University on sales of products described in this article. Dr. Sidransky owns OncoMethylome Sciences, SA stock, which is subject to certain restrictions under University policy. Dr. Sidransky is a paid consultant to OncoMethylome Sciences, SA and is a paid member of the company's Scientific Advisory Board. The term of this arrangement is being managed by the Johns Hopkins University in accordance with its conflict of interest policies.
Appendix A. Supplementary data: Supplementary data associated with this article can be found, in the online version, at doi:10.1016/j.bbrc.2008.03.026.
References
- 1.Rosenberg K. Ten-year risk of false positive screening mammograms and clinical breast examinations. J Nurse Midwifery. 1998;43:394–395. doi: 10.1016/s0091-2182(98)00041-x. [DOI] [PubMed] [Google Scholar]
- 2.Elmore JG, Barton MB, Moceri VM, Polk S, Arena PJ, Fletcher SW. Ten-year risk of false positive screening mammograms and clinical breast examinations. N Engl J Med. 1998;338:1089–1096. doi: 10.1056/NEJM199804163381601. [DOI] [PubMed] [Google Scholar]
- 3.Baselga J, Norton L. Focus on breast cancer. Cancer Cell. 2002;1:319–322. doi: 10.1016/s1535-6108(02)00066-1. [DOI] [PubMed] [Google Scholar]
- 4.Tognon C, Knezevich SR, Huntsman D, Roskelley CD, Melnyk N, Mathers JA, Becker L, Carneiro F, MacPherson N, Horsman D, Poremba C, Sorensen PH. Expression of the ETV6-NTRK3 gene fusion as a primary event in human secretory breast carcinoma. Cancer Cell. 2002;2:367–376. doi: 10.1016/s1535-6108(02)00180-0. [DOI] [PubMed] [Google Scholar]
- 5.Herman JG. Hypermethylation of tumor suppressor genes in cancer, Semin. Cancer Biol. 1999;9:359–367. doi: 10.1006/scbi.1999.0138. [DOI] [PubMed] [Google Scholar]
- 6.Hoque MO, Feng Q, Toure P, Dem A, Critchlow CW, Hawes SE, Wood T, Jeronimo C, Rosenbaum E, Stern J, Yu M, Trink B, Kiviat NB, Sidransky D. Detection of aberrant methylation of four genes in plasma DNA for the detection of breast cancer. J Clin Oncol. 2006;24:4262–4269. doi: 10.1200/JCO.2005.01.3516. [DOI] [PubMed] [Google Scholar]
- 7.van Camp G, Coucke P, Balemans W, van Velzen D, van de Bilt C, van Laer L, Smith RJ, Fukushima K, Padberg GW, Frants RR, et al. Localization of a gene for non-syndromic hearing loss (DFNA5) to chromosome 7p15. Hum Mol Genet. 1995;4:2159–2163. doi: 10.1093/hmg/4.11.2159. [DOI] [PubMed] [Google Scholar]
- 8.Van Laer L, Huizing EH, Verstreken M, van Zuijlen D, Wauters JG, Bossuyt PJ, VandeHeyning P, McGuirt WT, Smith RJ, Willems PJ, Legan PK, Richardson GP, Van Camp G. Nonsyndromic hearing impairment is associated with a mutation in DFNA5. Nat Genet. 1998;20:194–197. doi: 10.1038/2503. [DOI] [PubMed] [Google Scholar]
- 9.Thompson DA, Weigel RJ. Characterization of a gene that is inversely correlated with estrogen receptor expression (ICERE-1) in breast carcinomas. Eur J Biochem. 1998;252:169–177. doi: 10.1046/j.1432-1327.1998.2520169.x. [DOI] [PubMed] [Google Scholar]
- 10.Lage H, Helmbach H, Grottke C, Dietel M, Schadendorf D. DFNA5 (ICERE-1) contributes to acquired etoposide resistance in melanoma cells. FEBS Lett. 2001;494:54–59. doi: 10.1016/s0014-5793(01)02304-3. [DOI] [PubMed] [Google Scholar]
- 11.Kim MS, Chang X, Yamashita K, Nagpal JK, Baek JH, Wu G, Trink B, Ratovitski EA, Mori M, Sidransky D. Aberrant promoter methylation and tumor suppressive activity of the DFNA5 gene in colorectal carcinoma. Oncogene. doi: 10.1038/sj.onc.1211021. in press. [DOI] [PubMed] [Google Scholar]
- 12.Kim MS, Yamashita K, Baek JH, Park HL, Carvalho AL, Osada M, Hoque MO, Upadhyay S, Mori M, Moon C, Sidransky D. N-Methyl-d-aspartate receptor type 2B is epigenetically inactivated and exhibits tumor-suppressive activity in human esophageal cancer. Cancer Res. 2006;66:3409–3418. doi: 10.1158/0008-5472.CAN-05-1608. [DOI] [PubMed] [Google Scholar]
- 13.Akino K, Toyota M, Suzuki H, Imai T, Maruyama R, Kusano M, Nishikawa N, Watanabe Y, Sasaki Y, Abe T, Yamamoto E, Tarasawa I, Sonoda T, Mori M, Imai K, Shinomura Y, Tokino T. Identification of DFNA5 as a target of epigenetic inactivation in gastric cancer. Cancer Sci. 2007;98:88–95. doi: 10.1111/j.1349-7006.2006.00351.x. [DOI] [PMC free article] [PubMed] [Google Scholar]
- 14.Fiorelli G, Picariello L, Martineti V, Tonelli F, Brandi ML. Functional estrogen receptor beta in colon cancer cells. Biochem Biophys Res Commun. 1999;261:521–527. doi: 10.1006/bbrc.1999.1062. [DOI] [PubMed] [Google Scholar]
- 15.Arai N, Strom A, Rafter JJ, Gustafsson JA. Estrogen receptor beta mRNA in colon cancer cells: growth effects of estrogen and genistein. Biochem Biophys Res Commun. 2000;270:425–431. doi: 10.1006/bbrc.2000.2444. [DOI] [PubMed] [Google Scholar]
- 16.Hoque MO, Topaloglu O, Begum S, Henrique R, Rosenbaum E, Van Criekinge W, Westra WH, Sidransky D. Quantitative methylation-specific polymerase chain reaction gene patterns in urine sediment distinguish prostate cancer patients from control subjects. J Clin Oncol. 2005;23:6569–6575. doi: 10.1200/JCO.2005.07.009. [DOI] [PubMed] [Google Scholar]
Associated Data
This section collects any data citations, data availability statements, or supplementary materials included in this article.