

Abstract
Background and Purpose
The purpose of this study was to develop a novel MRI method for imaging clot lysis in a rat embolic stroke model, and to compare tissue plasminogen activator (tPA) based clot lysis with and without recombinant Annexin-2 (rA2).
Methods
Experiment 1: In vitro optimization of clot visualization using multiple MRI contrast agents in concentrations ranging from 5 to 50μL in 250μL blood. Experiment 2: In vivo characterization of the time course of clot lysis using the clot developed in the previous experiment. Diffusion, perfusion, angiography, and T1-weighted MRI for clot imaging were conducted prior to and during treatment with vehicle (n=6), tPA (n=8) or rA2+tPA (n=8) at multiple time-points. Brains were removed for ex vivo clot localization.
Results
Clots created with 25μL Magnevist© were the most stable and provided the highest contrast-to-noise ratio. In the vehicle group, clot length as assessed by T1-weighted imaging correlated with histology (r=0.93). Clot length and CBF-derived ischemic lesion volume were significantly smaller than vehicle at 15 minutes post-treatment initiation in the rA2+tPA group, while in the tPA group no significant reduction from vehicle was observed until 30 minutes post-treatment initiation. The rA2+tPA group had a significantly shorter clot length than the tPA group at 60 and 90 minutes post-treatment initiation, and significantly smaller CBF deficit than the tPA group at 90 minutes post-treatment initiation.
Conclusions
We introduce a novel MRI based clot imaging method for in vivo monitoring of clot lysis. Lytic efficacy of tPA was enhanced by rA2.
Keywords: Acute Stroke, Animal Models, Ischemia, MRI, Thrombolysis
Introduction
Previous studies in experimental stroke models demonstrated that tissue plasminogen activator (tPA) mediated recanalization and subsequent reperfusion leads to reduced final infarct volumes.1–3 Currently available magnetic resonance imaging (MRI) methods to determine arterial patency such as time of flight angiography (TOF) in small animals are sensitive to a number of parameters including flow, blood longitudinal relaxation time, and sequence parameters.4 Signal intensity is based on a combination of these parameters and may make quanitative analysis of thrombolysis difficult. This might explain why a relationship between recanalization and reperfusion has not been clearly established.5 Direct clot imaging has been proposed, but these techniques typically require a multimodality approach or targeted contrast agents not readily available to investigators.6–8 Though in vitro assays are available to test the effects of thrombolytics on blood clots, these systems cannot sufficiently mimic the in vivo environment.9 Direct in vivo MRI-based visualization of the embolus will allow for near real time quantification of clot dissolution and provide unique information regarding lytic efficacy of thrombolytic agents.
In this study, we present a novel MRI methodology for clot visualization in an experimental stroke model using a commercially available contrast agent. Further goals of this study were to characterize clot lysis dynamics during thrombolytic therapy and to evaluate the lytic efficacy of tPA with or without recombinant Annexin-2 (rA2), a compound thought to enhance the lytic action of tPA.1
Methods
This study consisted of two experiments. The first (in vitro) experiment involved designing a robust method for modifying standard clots for visualization on MRI and histology. The second (in vivo) experiment characterized the temporal evolution of clot lysis mediated by tPA vs. tPA combined with rA2 (rA2+tPA) utilizing MRI.
In vitro experiment (Experiment 1)
Standard clots10 were modified by mixing 250μL of blood with four different contrast agents at volumes ranging from 0 to 50μL to determine optimal contrast agent type and volume for MRI visualization. The contrast agents used were Magnevist© (Berlex Laboratories, Montville, NJ, USA), Combidex© (Combidex Threading Tools b.v, Nieuwe Waterwegstraat 5, Schiedam, Holland), Omniscan© (GE Health Care, Princeton, NJ, USA) and Eovist© (Bayer Healthcare Pharmaceuticals, Wayne, NJ, USA). An animal surgeon with experience in embolic stroke modeling inspected the quality of the clots. At the contrast volumes used, Magnevist© infused clots showed consistent stability, while the use of the other contrast agents resulted in fragile and unstable clots. Magnevist© was therefore used for the in vitro and in vivo experiments.
For in vitro quantification of contrast intensity Magnevist© clots were placed in saline and imaged using the T1-weighted imaging (T1WI) sequence described in the MRI section. The resulting signal intensity of the clot and surrounding saline was measured. The clot enhancement ratio was calculated by dividing the clot signal intensity by the saline signal intensity. Subsequent histological visualization was made possible by incubating the clot in 2% Evans Blue (EB) for 24h at 4°C.
In vivo experiment (Experiment 2)
All procedures used in this study were approved by University of Massachusetts Medical School Institutional Animal Care use Committee. Spontaneously breathing male Wistar rats (n = 22, Taconic Farms, Hudson, NY, USA) weighing 318 ± 27g were anesthetized with isoflurane (5% for induction, 2% for surgery, 1.2% for maintenance) in room air. PE-50 polyethylene tubing was inserted into the femoral artery for monitoring of mean arterial blood pressure (MABP), blood gases, electrolytes, and glucose. Additional tubing was inserted into the femoral vein to allow for intravenous (i.v.) infusion of tPA, rA2+tPA, or vehicle. Body temperature was monitored continuously with a rectal probe and maintained at 37.0 ± 0.5°C with a thermostatically controlled heating pad. Embolic stroke (ES) was induced in all 22 animals as previously described11 with the modified clot reported in Experiment 1. The animals were randomly assigned to either vehicle (n = 6), tPA (n = 8) or rA2+tPA (n = 8) treatment. The i.v. infusion of thrombolytics or vehicle was administered at 90min following ES with a 10% bolus and the remainder infused over 1h. The vehicle group received 1mL of saline, while the tPA groups received 10mg/kg tPA dissolved in either 1mL of saline or rA2 solution (5mg/kg). Histidine tagged rA2 was produced in E. coli from a bacterial expression vector containing full-length human annexin-2 complementary DNA according to the method previously described.12 Purity of rA2 was confirmed by sodium dodecyl sulfate polyacrylamide gel electrophoresis (SDS-PAGE) followed by Coomassie blue staining, and its identity was verified by western blot analysis. rA2 was finally eluted and kept in elution buffer (20mmol/L sodium phosphate, 0.5mol/L NaCl, 500mmol/L imidazole, pH 7.4). Imaging was performed from 30 to 180min and animals were electively sacrificed at 3.5h after ES to remove their brains. Brains were imaged using an optical scanner and EB stained clots were identified and their lengths measured.
MRI
MRI experiments were performed on a Bruker system utilizing a 4.7 T/400mm horizontal magnet equipped with Paravision software (Billerica, MA), and a 20G/cm gradient insert (ID = 120mm, 120μs rise time). A surface coil (ID = 23mm) was used for brain imaging and an actively decoupled neck coil for perfusion labeling.13 T1WI and perfusion weighted images (PWI) were acquired at 60, 90, 105, 120, 135, 150 and 180min post-ES. Diffusion weighted imaging (DWI) was acquired at 30, 90, and 160min post-ES. TOF magnetic resonance angiography (MRA) was performed at 60 and 150min post-ES. PWI, DWI and MRA were performed as previously described in detail.11 Two contiguous slices with in plane visualization of the bifurcation of the middle cerebral artery (MCA), anterior cerebral artery (ACA), and internal carotid artery (ICA) were recorded sequentially using a T1WI centric ordered turbo spin echo with a echo train length of 4, an echo time of 3.2ms, a recovery time of 290ms, a field of view (FOV) of 25.6 × 25.6mm, a slice thickness of 750μm, and a matrix size of 256 × 128. Saturation slabs 1 cm thick were placed posterior and anterior to the Circle of Willis to reduce flow induced imaging artifacts.
Analysis of MRI data
A maximum intensity projection image (MIP) was created from the two T1WI slices acquired, and analyzed using the Medical Image Processing, Analysis, and a Visualization software package (NIH, mipav.cit.nih.gov). To identify the clot on the MIP of the T1WI, a ≥ 30% signal intensity within the ICA, MCA, and ACA compared to the surrounding brain parenchyma was chosen. An investigator (RPW) blinded to treatment assignment outlined the clots using the software’s tracing tool. The length of the clot in each vessel was summed and the total clot length during and after treatment was reported as a percentage of the initial clot length.
DWI, PWI and MRA were analyzed blinded to treatment assignment using QuickVol II (http://www.quickvol.com/).14 Quantitative apparent diffusion coefficient (ADC) and cerebral blood flow (CBF) maps were created and their corresponding threshold-derived lesion volumes were calculated as described previously.13,14 The thresholds used to define respective abnormal ADC and CBF regions were a reduction to 0.53 × 10⁻³ mm2/s and 0.3mL/g/min, respectively, as previously validated.13 Diffusion and perfusion lesion volumes are expressed as percentages of the initial volumes at 30 (DWI) and 60 (PWI) min, respectively.
We introduce a metric to summarize the evolution of the clot length and perfusion deficit volume defined as the α distance, which is expresses by:
| [1] |
where t and i represent the treatment time point and initial value, respectively. Equation [1] was normalized to pre treatment values of clot length and perfusion deficit volume.
For comparative purposes, MRA were visually analyzed by a blinded investigator (KMS) and were scored on a 3 point scale as follows: 1 = complete MCA occlusion, 2 = partial MCA reperfusion, and 3 = complete reperfusion of the MCA. MCA was selected for analysis to reveal an overall picture of vessel recanalization.
Analysis of Evans Blue Clot Histology
The entire surface of all the rat brains was scanned with a high resolution (1600dpi) scanner. The EB clot was identified, and measured by summing the length of all clot fragments. Total clot length was assessed and correlated with MRI to validate T1WI-derived clot length and to determine the lytic efficacy of each treatment.
Statistics
Data are presented as mean ± standard deviation. Statistical comparisons were performed using one-way Analysis of Variance (ANOVA) with post hoc Least Significant Difference (LSD) test for multiple comparisons. Correlation analysis was performed using Pearson two-tailed test (Version 15.0, SPSS Inc., Chicago, IL, USA). p<0.05 was considered significant.
Results
In vitro clot experiments
Figure 1 shows a Magnevist© enhanced clot suspended in saline. The clot’s signal enhancement ratio was calculated for concentrations ranging from 0μL to 50μL of Magnevist©. Signal enhancement was undetectable in clots with the lowest contrast agent volumes of ≤ 5μL. Table 1 displays the clot’s signal enhancement ratios at various Magnevist© volumes. The 25 and 30μL Magnevist© volume provided significantly higher signal enhancement ratios relative to all other concentrations used, with insignificant differences between these two concentrations. We opted to use 25μL Magnevist© in all further experiments to obtain the highest clot signal enhancement ratio while utilizing the lowest contrast agent volume.
Figure 1.
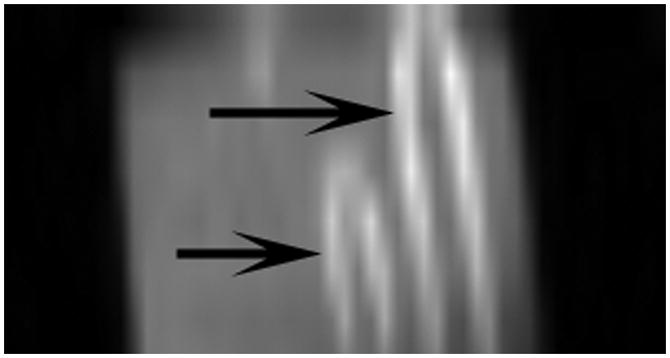
Maximum intensity projection of Magnevist© (25μL contrast agent in 250μL blood) infused clots in saline utilizing T1-weighted imaging. Arrows point to clot sections.
Table 1.
In vitro clot enhancement ratios
| 0 μL | 5 μL | 10 μL | 15 μL | 20 μL | 25 μL | 30 μL | 50 μL | |
|---|---|---|---|---|---|---|---|---|
| Enhancement Ratio | 0† | 0† | 1.28±0.04 | 1.26±0.06 | 1.32±0.09 | 2.1±0.10* | 1.88±0.15* | 1.45±0.22 |
Enhancement ratio as determined by T1-weighted imaging of clots made from blood with different volumes of Magnevist©.
Significantly enhanced signal as compared to other concentrations but not as compared to each other.
Clot enhancement was undetectable.
In vivo clot experiments
The Magnevist©/EB-modified clots were visible on MRI and histology. They produced consistent arterial occlusion and subsequent ischemic changes as assessed by T1WI, PWI, DWI and MRA in all animals. When exposed to tPA the clot slowly dissolved over 90min after treatment initiation. In both the vehicle and the tPA group, T1WI results matched well with EB stained clot found in the MCA, ACA and ICA post mortem (Figure 2). T1WI-derived 180min clot length correlated significantly with the clot length assessed on histology (r = 0.93, p < 0.05).
Figure 2.
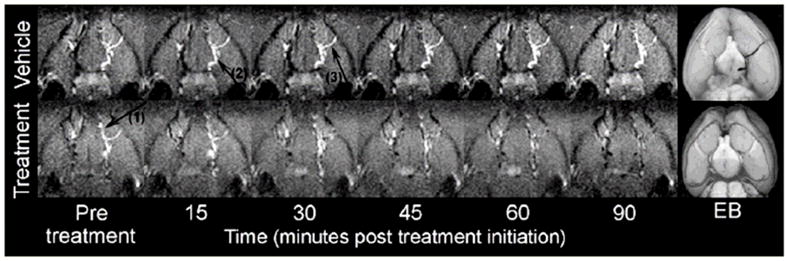
In vivo Maximum Intensity Projection of the clot utilizing T1-weighted imaging in a representative vehicle (top) and tPA (bottom) treated animal, respectively. Note the progressive clot lysis in the tPA-treated but not the vehicle animal. T1-weighted imaging results match well with Evans Blue (EB) stained clot found on histology 3.5h post embolization. Arrow 1, 2 and 3 points to clot visible in anterior cerebral artery, internal carotid artery, and middle cerebral artery respectively.
MRI experiment
Initial clot localization was determined in all animals before treatment was initiated. Clot localization was as follows: MCA + ICA + ACA (n = 13 (59%)), ICA + ACA (n = 4 (18%)), ACA + MCA (n = 3 (14%)), and ICA + MCA (n = 2 (9%)), respectively. MABP, blood gases, electrolytes, and glucose were not significantly different between groups, and values remained within physiological limits throughout the study (data not shown).
Clot length and CBF lesion volumes were significantly smaller than vehicle at 15min post-treatment initiation in the rA2+tPA group, while in the tPA group no significant reduction from vehicle was observed until 30min post-treatment initiation. Beginning at 60min post-treatment clot length in the rA2+tPA group was significantly smaller than in the tPA group. From 90min post-treatment initiation, CBF lesion volume in the rA2+tPA group was significantly smaller than in the tPA group (see Figure 3). The absolute CBF volumes pre-treatment were 311±65 in the vehicle group, 319±40 in the tPA group and 327±32 in the rA2+tPA. There were no initial statistical differences between these groups (p=0.801).
Figure 3.

Temporal evolution of A) T1-weighted imaging derived clot length and B) perfusion lesion volume in the experimental groups. *Significant difference between treatment group and control. †Significant difference between treatment groups. p < 0.05. Note, n = 5 for the last imaging time-point in figure B for the rA2+tPA group.
Plotting CBF lesion volume versus clot length gives the clot lysis profile for each animal over time. In the vehicle group no clot lysis was observed as indicated by consistent CBF lesion volumes and clot lengths over time (Figure 4A–C). Following thrombolysis all animals demonstrated a reduction in CBF lesion volumes and clot lengths with rA2+tPA animals displaying the most complete clot lysis and reperfusion. The α distance of the thrombolysis groups were significantly shorter than that of the vehicle group at all time points following treatment initiation. Combining rA2 with tPA improved clot dissolution and CBF restoration as indicated by a significantly shorter α distance in the rA2+tPA group compared to the tPA alone group at 15, 60 and 90min post-treatment initiation (Figure 4D).
Figure 4.

(A–C) Scatter plot graphically displaying the time course of clot lysis and perfusion restoration in vehicle, tPA and rA2+tPA treated. Both treatment groups show migration toward restoration of perfusion deficit and clot lysis. All animals in the rA2+tPA group had complete clot lysis while only half of the tPA animals had complete clot lysis. (D) Plot of the α distance over all 5 imaging time points after treatment initiation. *Denotes significant enlargement in both treatment groups compared to vehicle. †Denotes significant enlargement in the rA2+tPA treatment group compared to tPA alone. Note, n = 5 for the rA2+tPA group in figure 4C and the last time point in figure 4D.
There was a non-significant reduction in the ADC lesion volumes between the two treatment groups and the vehicle group at 150min post ES (Figure 5).
Figure 5.
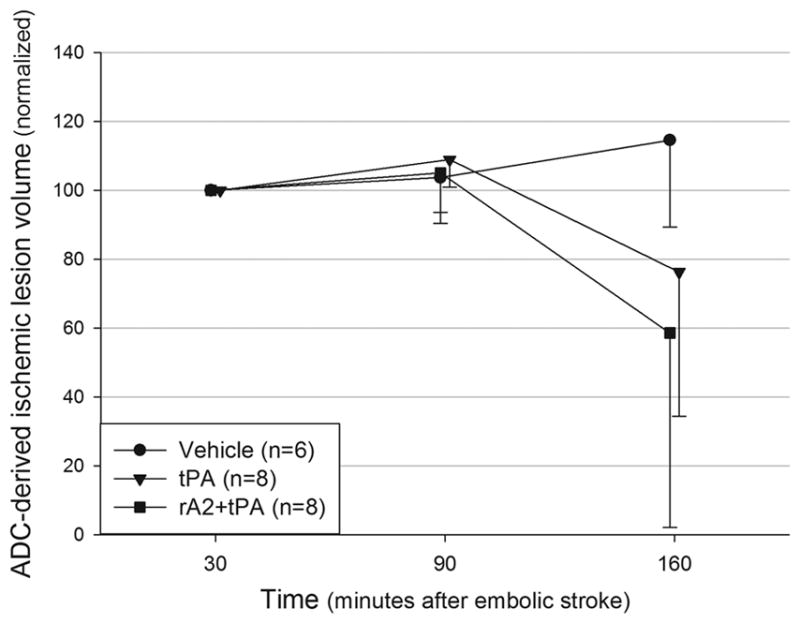
Temporal evolution of the ADC-derived ischemic lesion volumes. Values presented as % of the 30min lesion.
MRAs showed that the treatment groups had significantly better recanalization of the MCA than the vehicle group, but no difference between the treatment groups was found (data not shown).
Discussion
This study describes a novel approach for MR visualization of clot and clot lysis in a rat embolic stroke model by adding Magnevist©, a widely available MR contrast agent, to the blood prior to clotting.
The utility of this approach is to directly compare the efficacy of thrombolytic agents on speed and completeness of clot lysis. Prior studies indirectly assessed thrombolytic efficacy by comparing DWI/PWI derived lesion volumes or final infarct volume on histology.2,4,15 However, directly visualizing clot integrity is especially important at late therapeutic time points in which the ‘no or low reflow phenomenon’ may occur.16 Complete recanalization can potentially occur with a small or non-existent response of the CBF or DWI lesion volume. Information about clot lysis enhances the overall understanding of the results of treatment and more completely answers questions about the mechanisms of success or failure of an investigational stroke treatment. Further, this methodology allows for more complete characterization of the emoblic stroke model. Our results show that a wide variety of clot configurations occur in the cerebral vasculature which may explain some of the variability seen in this model.10
Compared to established methods used in the preclinical setting to determine vessel patency following treatment, the new clot imaging technique offers a number of advantages. It does not require the injection of a contrast agent, which is critical to digital subtraction angiography and some MRA techniques. Vessel visualization on non-contrast MRA techniques such as time of flight is dependent on a combination of pulse sequence parameters, vessel blood flow velocity and blood flow patterns4. The new clot imaging technique allows for high quality visualization of the clot using standard T1 weighted imaging. It is conceivable that with the use of targeted contrast agents, direct clot visualization may become a novel diagnostic technique in patients.8
Clot length was used to determine clot lysis in vivo. This metric directly defines the temporal efficacy of different thrombolytic agents independent of surrogate markers such as perfusion deficit. Together with perfusion and diffusion imaging, imaging of clot lysis allows for a more thorough characterization of the efficacy of thrombolytics in an ES model.
To show the utility of this method, we compared the effects of vehicle, tPA alone, and rA2+tPA treatment. rA2+tPA more reliably produced thrombolysis relative to tPA alone. Our results show that half of all tPA animals had some clot remaining in the arteries while no animals in the rA2+tPA group had clot remaining. After completion of treatment, the more consistent action of rA2+tPA resulted in statistically significant smaller perfusion lesion volume post treatment as compared to tPA alone. Further, rA2+tPA resulted in an earlier statistically significant difference in CBF deficit volume versus vehicle compared to tPA alone. These findings are supported by the α distance analysis, which shows an initial stronger response to rA2+tPA relative to tPA alone. Further, at late time points during and following treatment, rA2+tPA showed a shorter α distance than tPA alone or vehicle. This observation provides further evidence that the addition of rA2 to standard tPA treatment results in enhanced thrombolysis in this embolic stroke model.
rA2 is thought to operate as a cell-surface receptor for both plasminogen (the inactive precursor of plasmin), and its activator, tPA.17,18 The rA2−tPA-plasminogen triple complex is more effective than tPA alone in converting plasminogen into plasmin.19,20 Our previous study confirmed the enhanced plasmin generation by rA2+tPA in vitro and demonstrated rA2+tPA improved neurological outcomes in a rat focal embolic stroke model.1 It is possible that rA2+tPA generates more plasmin at the clot site because it has been demonstrated that the plasmin precursor, plasminogen, binds to the endothelial cell surface and is enriched in the clot.20,21 Therefore, rA2+tPA may locally bind plasminogen and consequently amplify plasmin generation in the vicinity of the clot, resulting in more effective fibrinolysis.
Although we report faster and more complete clot lysis and reperfusion, there was no statistically significant difference in the final ADC lesion volume between groups. We hypothesize that this finding was due to the late initiation of treatment in this experiment. Previous findings in the rat suture model of stroke showed that after 95 minutes of ischemia, recovery of the ADC lesion was non-significant.22 Future experiments should investigate the relationship between lysis efficacy and ADC lesion resolution.
There was an observed difference between the results from MRA characterization of clot lysis and the clot imaging technique in regards to the efficacy of tPA compared to rA2 + tPA. Clot lysis may result in partial recanalization as well as blood vessel damage which can cause changes in blood flow velocity and profile.23 The inherent limitations of MRA to detect vessel patency under these conditions may reduce the sensitivity of this technique to visualize recanalization and explain this result.4
The clot imaging protocol was limited as it is only sensitive to clot localized in the bifurcation of the ICA, ACA, and MCA. Sections of the MCA distal to the M1-segment were not visible. At the current resolution, larger imaging field of views would require lengthier scans and therefore would impede the ability to do other scans and limit the temporal scanning during the acute stroke phase and at multiple time points during treatment.
To summarize, in this study we: (1) successfully developed a methodology that enables us to visualize clots using a contrast reagent Magnevist© in a focal rat embolic stroke model; (2) used this new method to characterize clot lysis dynamics during thrombolytic therapy; and (3) documented that tPA+rA2 yields faster and more consistent thrombolysis than tPA alone. This new methodology provides a novel approach to preclinically evaluate investigational thrombolytic agents.
Acknowledgments
tPA was a kind gift from Genentec.
Source of Funding
This study was supported by institutional grants. X.W was supported by a NIH grant RO1NS065998
Footnotes
Potential conflict of interest
All authors declare no conflict of interest in regards to this study.
References
- 1.Zhu H, Fan X, Yu Z, Liu J, Murata Y, Lu J, Zhao S, Hajjar K, Lo E, Wang X. Annexin a2 combined with low-dose tpa improves thrombolytic therapy in a rat model of focal embolic stroke. J Cereb Blood Flow Metab. 2010;30:1137–1146. doi: 10.1038/jcbfm.2009.279. [DOI] [PMC free article] [PubMed] [Google Scholar]
- 2.Henninger N, Bratane B, Bastan B, Bouley J, Fisher M. Normobaric hyperoxia and delayed tpa treatment in a rat embolic stroke model. J Cereb Blood Flow Metab. 2009;29:119–129. doi: 10.1038/jcbfm.2008.104. [DOI] [PubMed] [Google Scholar]
- 3.Fujiwara N, Murata Y, Arai K, Egi Y, Lu J, Wu O, Singhal A, Lo E. Combination therapy with normobaric oxygen (nbo) plus thrombolysis in experimental ischemic stroke. BMC Neurosci. 2009;10:79. doi: 10.1186/1471-2202-10-79. [DOI] [PMC free article] [PubMed] [Google Scholar]
- 4.Reese T, Bochelen D, Sauter A, Beckmann N, Rudin M. Magnetic resonance angiography of the rat cerebrovascular system without the use of contrast agents. NMR Biomed. 1999;12:189–196. doi: 10.1002/(sici)1099-1492(199906)12:4<189::aid-nbm557>3.0.co;2-o. [DOI] [PubMed] [Google Scholar]
- 5.Hilger T, Niessen F, Diedenhofen M, Hossmann K, Hoehn M. Magnetic resonance angiography of thromboembolic stroke in rats: Indicator of recanalization probability and tissue survival after recombinant tissue plasminogen activator treatment. J Cereb Blood Flow Metab. 2002;22:652–662. doi: 10.1097/00004647-200206000-00003. [DOI] [PubMed] [Google Scholar]
- 6.Gralla J, Schroth G, Remonda L, Fleischmann A, Fandino J, Slotboom J, Brekenfeld C. A dedicated animal model for mechanical thrombectomy in acute stroke. AJNR Am J Neuroradiol. 2006;27:1357–1361. [PMC free article] [PubMed] [Google Scholar]
- 7.Morris T, Marsh J, Chiles P, Konopka R, Pedersen C, Schmidt P, Gerometta M. Single photon emission computed tomography of pulmonary emboli and venous thrombi using anti-d-dimer. Am J Respir Crit Care Med. 2004;169:987–993. doi: 10.1164/rccm.200306-735OC. [DOI] [PubMed] [Google Scholar]
- 8.Spuentrup E, Botnar R, Wiethoff A, Ibrahim T, Kelle S, Katoh M, Ozgun M, Nagel E, Vymazal J, Graham P, Günther R, Maintz D. Mr imaging of thrombi using ep-2104r, a fibrin-specific contrast agent: Initial results in patients. Eur Radiol. 2008;18:1995–2005. doi: 10.1007/s00330-008-0965-2. [DOI] [PubMed] [Google Scholar]
- 9.Prasad S, Kashyap R, Deopujari J, Purohit H, Taori G, Daginawala H. Development of an in vitro model to study clot lysis activity of thrombolytic drugs. Thromb J. 2006;4:14. doi: 10.1186/1477-9560-4-14. [DOI] [PMC free article] [PubMed] [Google Scholar]
- 10.Henninger N, Sicard K, Schmidt K, Bardutzky J, Fisher M. Comparison of ischemic lesion evolution in embolic versus mechanical middle cerebral artery occlusion in sprague dawley rats using diffusion and perfusion imaging. Stroke. 2006;37:1283–1287. doi: 10.1161/01.STR.0000217223.72193.98. [DOI] [PubMed] [Google Scholar]
- 11.Henninger N, Bouley J, Bratåne B, Bastan B, Shea M, Fisher M. Laser doppler flowmetry predicts occlusion but not tpa-mediated reperfusion success after rat embolic stroke. Exp Neurol. 2009;215:290–297. doi: 10.1016/j.expneurol.2008.10.013. [DOI] [PubMed] [Google Scholar]
- 12.Ishii H, Yoshida M, Hiraoka M, Hajjar K, Tanaka A, Yasukochi Y, Numano F. Recombinant annexin ii modulates impaired fibrinolytic activity in vitro and in rat carotid artery. Circ Res. 2001;89:1240–1245. doi: 10.1161/hh2401.101066. [DOI] [PubMed] [Google Scholar]
- 13.Meng X, Fisher M, Shen Q, Sotak C, Duong T. Characterizing the diffusion/perfusion mismatch in experimental focal cerebral ischemia. Ann Neurol. 2004;55:207–212. doi: 10.1002/ana.10803. [DOI] [PMC free article] [PubMed] [Google Scholar]
- 14.Schmidt K, Ziu M, Schmidt N, Vaghasia P, Cargioli T, Doshi S, Albert M, Black P, Carroll R, Sun Y. Volume reconstruction techniques improve the correlation between histological and in vivo tumor volume measurements in mouse models of human gliomas. J Neurooncol. 2004;68:207–215. doi: 10.1023/b:neon.0000033364.43142.bf. [DOI] [PubMed] [Google Scholar]
- 15.Tanaka Y, Ishii H, Hiraoka M, Miyasaka N, Kuroiwa T, Hajjar K, Nagaoka T, Duong T, Ohno K, Yoshida M. Efficacy of recombinant annexin 2 for fibrinolytic therapy in a rat embolic stroke model: A magnetic resonance imaging study. Brain Res. 2007;1165:135–143. doi: 10.1016/j.brainres.2007.06.039. [DOI] [PMC free article] [PubMed] [Google Scholar]
- 16.Liu S, Connor J, Peterson S, Shuttleworth C, Liu K. Direct visualization of trapped erythrocytes in rat brain after focal ischemia and reperfusion. J Cereb Blood Flow Metab. 2002;22:1222–1230. doi: 10.1097/01.wcb.0000037998.34930.83. [DOI] [PubMed] [Google Scholar]
- 17.Kim J, Hajjar KA. Annexin ii: A plasminogen-plasminogen activator co-receptor. Front Biosci. 2002;7:d341–348. doi: 10.2741/kim. [DOI] [PubMed] [Google Scholar]
- 18.Hajjar KA, Menell JS. Annexin ii: A novel mediator of cell surface plasmin generation. Ann N Y Acad Sci. 1997;811:337–349. doi: 10.1111/j.1749-6632.1997.tb52013.x. [DOI] [PubMed] [Google Scholar]
- 19.Hajjar KA, Acharya SS. Annexin ii and regulation of cell surface fibrinolysis. Ann N Y Acad Sci. 2000;902:265–271. doi: 10.1111/j.1749-6632.2000.tb06321.x. [DOI] [PubMed] [Google Scholar]
- 20.Hajjar KA, Krishnan S. Annexin ii: A mediator of the plasmin/plasminogen activator system. Trends Cardiovasc Med. 1999;9:128–138. doi: 10.1016/s1050-1738(99)00020-1. [DOI] [PubMed] [Google Scholar]
- 21.Sakharov DV, Rijken DC. Superficial accumulation of plasminogen during plasma clot lysis. Circulation. 1995;92:1883–1890. doi: 10.1161/01.cir.92.7.1883. [DOI] [PubMed] [Google Scholar]
- 22.Bardutzky J, Shen Q, Henninger N, Schwab S, Duong T, Fisher M. Characterizing tissue fate after transient cerebral ischemia of varying duration using quantitative diffusion and perfusion imaging. Stroke. 2007;38:1336–1344. doi: 10.1161/01.STR.0000259636.26950.3b. [DOI] [PMC free article] [PubMed] [Google Scholar]
- 23.Li L, Ke Z, Tong K, Ying M. Evaluation of cerebral blood flow changes in focal cerebral ischemia rats by using transcranial doppler ultrasonography. Ultrasound Med Biol. 2010;36:595–603. doi: 10.1016/j.ultrasmedbio.2010.01.005. [DOI] [PubMed] [Google Scholar]