

Abstract
Segmentation or metamery in vertebrates is best illustrated by the repetition of the vertebrae and ribs, their associated skeletal muscles and blood vessels, and the spinal nerves and ganglia. The segment number varies tremendously among the different vertebrate species, ranging from as few as six vertebrae in some frogs to as many as several hundred in some snakes and fish. In vertebrates, metameric segments or somites form sequentially during body axis formation. This results in the embryonic axis becoming entirely segmented into metameric units from the level of the otic vesicle almost to the very tip of the tail. The total segment number mostly depends on two parameters: (1) the control of the posterior growth of the body axis during somitogenesis—more same-size segments can be formed in a longer axis and (2) segment size—more smaller-size segments can be formed in a same-size body axis. During evolution, independent variations of these parameters could explain the huge diversity in segment numbers observed among vertebrate species. These variations in segment numbers are accompanied by diversity in the regionalization of the vertebral column. For example, amniotes can exhibit up to five different types of vertebrae: cervical, thoracic, lumbar, sacral and caudal, the number of which varies according to the species. This regionalization of the vertebral column is controlled by the Hox family of transcription factors. We propose that during development, dissociation of the Hox- and segmentation-clock-dependent vertebral patterning systems explains the enormous diversity of vertebral formulae observed in vertebrates.
Overview of segment formation
The first signs of segmentation appear in the embryo during the process of somitogenesis, which drives the formation of transient embryonic segments called somites. The somites are epithelial structures that contain the precursors of vertebrae, ribs, skeletal muscles of the body wall and limbs, and the dermis of the back (Hirsinger et al, ’00; Christ et al, ’07; Brent and Tabin, ’02). Soon after the onset of gastrulation, somites form on both sides of the neural tube from the presomitic mesoderm (PSM) (Fig. 1a). The PSM is part of the paraxial mesoderm and is generated caudally through the process of gastrulation when cells ingress through the primitive streak (in the chicken and mouse) or the blastopore (in Xenopus laevis and zebrafish) and later, through the tail bud (a posterior condensation of cells that replaces the streak/blastopore and contributes to the embryonic posterior elongation process) (Iimura et al, ’07; Kimelman and Griffin, ’00; Kanki and Ho, ’97; Psychoyos and Stern, ’96; Tucker and Slack, ’95; Gont et al, ’93; Catala et al, ’95) (Fig. 1a). In all vertebrate species, pairs of somites bud off periodically at the anterior tip of the PSM at a specific pace depending on the temperature; for example, every 30 min in zebrafish at 28°C, 90 min in the chicken and 120 min in the mouse at 37°C (Schroter et al, ’08; Tam, ’81; Aulehla et al, ’08; Palmeirim et al, ’97; Romanoff, ’60). Concomitantly, the gastrulation process constantly provides cells at the posterior tip of the PSM, hence preventing its exhaustion by the segmentation process. The speed of both of these processes is regulated in a way that allows somitogenesis to continue until the total species-specific number of somites is reached.
Fig. 1.

The Clock and Wavefront model for somitogenesis. (a) Schematic representation of a chicken embryo at day 2 of development. Somites periodically bud off as a pair at the anterior tip of the PSM as the axis elongates. PSM, presomitic mesoderm. (b) Temporal sequence encompassing the formation of two somites illustrating the molecular events that take place in the PSM. The segmentation clock is identified by the periodic waves of cyclic gene transcription (orange, shown only on the left side) that sweep across the PSM during the formation of each somite. The position of the determination front in the PSM is indicated by a solid black line. The determination front is positioned by the antagonistic gradients of Wnt/FGF signaling (purple) and of RA (green). When cells that have passed the determination front receive the clock signal, they activate expression of Mesp2 in a bilateral stripe (black square, shown only on the right side), which constitutes the first segmental prepattern and is used as a template for somite formation. PSM, presomitic mesoderm; RA, retinoic acid. (c) The determination front (horizontal, black dashed line) is positioned in the PSM by the antagonistic activities of FGF/Wnt (purple) and RA (green) gradients and can be localized at the anterior limit of the Mesogenin1 expression domain (blue). RA, retinoic acid. Roman numerals correspond to the somites and their precursors according to the nomenclature described in (Pourquie and Tam, ’01).
Mechanisms of segmentation
In vertebrates, the rhythmic production of somites has been shown to involve an oscillator or clock whose response is gated spatially at the level of a traveling wavefront of maturation that moves posteriorly along the PSM (Cooke and Zeeman, ’76; Palmeirim et al, ’97; Elsdale et al, ’76; Dubrulle et al, ’01; Sawada et al, ’01). When PSM cells in the permissive phase of the clock cycle are passed by the wavefront, they undergo an abrupt transition that leads to segment formation. Thus, the wavefront serves to translate the rhythmic pulse of the clock into the spatial periodic series of segments (reviewed in (Dequeant and Pourquie, ’08)). The discovery in vertebrate species of rhythmically expressed genes in the PSM provides molecular evidence of the oscillator, which was originally proposed in the “clock and wavefront” model ((Cooke and Zeeman, ’76; Dequeant and Pourquie, ’08) and references therein). These “cyclic” genes belong to the Notch, Wnt and fibroblast growth factor (FGF) pathways and are proposed to be part of a complex network involved in the generation of signaling pulses in the PSM. Expression of their mRNA appears as a wave that sweeps across the PSM in a posterior-to-anterior manner within the time it takes to form one somite (Fig. 1b, orange). This wave is reinitiated in the PSM each time a somite forms. In the mouse or fish, mutations in genes associated with the segmentation clock cause severe somitic defects, and in humans they can result in congenital scoliosis (Turnpenny et al, ’07).
Evidence of the traveling wavefront of maturation in the PSM was first provided experimentally from heat-shock experiments in the frog (Elsdale et al, ’76). Subsequent experiments in chicken embryos identified a level of the PSM at which cells become committed to their segmental fate (Dubrulle et al, ’01). This level was termed the “determination front” and its position was shown to correspond to a defined threshold of FGF and Wnt signaling activity located in the anterior PSM (Fig. 1b and c) (Dubrulle et al, ’01; Sawada et al, ’01; Delfini et al, ’05; Aulehla et al, ’08). Posterior-to-anterior gradients of FGF and Wnt signaling activity, evidenced by graded, phosphorylated extracellular signal-regulated kinases (ERK) and nuclear β-catenin, are established in response to the graded expression of ligands, such as Fgf8 and Wnt3a, along the PSM (Fig. 1b and c) (Dubrulle et al, ’01; Dubrulle and Pourquie, ’04; Sawada et al, ’01; Aulehla et al, ’03; Delfini et al, ’05; Aulehla et al, ’08). Cells that are exposed to a high level of FGF/Wnt activity in the posterior PSM are maintained in an immature state (Dubrulle et al, ’01; Sawada et al, ’01) and express the transcription factors Brachyury/T, T-box 6 (Tbx6) and Mesogenin1 (Msgn1). When cells reach the level of the determination front in the PSM, they become competent to form a somite in response to the segmentation clock signal (Fig. 1b and c). This transition from an immature to a competent state can be visualized by the downregulation of the Msgn1 gene at the level of the determination front (Buchberger et al, ’00; Yoon et al, ’00) (Fig. 1c). In response to the clock signal, bilateral stripes of mesoderm posterior 2 (Mesp2) gene expression (black squares) form in a rhythmic sequence at the determination front level (Fig. 1c). The stripe of Mesp2 expression provides the template from which the morphological segment—the somite—will be formed and defines the posterior boundary of the future segment (Morimoto et al, ’05).
The posterior gradients and thus the determination front are displaced caudally in the wake of axis elongation. This posterior displacement relies on an original mechanism involving Fgf8 mRNA decay (Dubrulle and Pourquie, ’04). Transcription of the Fgf8 mRNA is restricted to the PSM precursors in the tail bud, and it ceases when their descendents enter the posterior PSM. Thus, as the axis elongates, cells gradually become located more anteriorly in the PSM, and their Fgf8 mRNA content progressively decays. This results in the establishment of a Fgf8 mRNA gradient that is converted into a graded ligand distribution and FGF activity (Sawada et al, ’01; Dubrulle and Pourquie, ’04; Delfini et al, ’05). A similar mechanism is assumed to be responsible for establishing the Wnt gradient (Aulehla and Herrmann, ’04). As a result of the progressive decay of the FGF/Wnt mRNA and proteins in PSM cells, the determination front is constantly displaced posteriorly, and it is proposed that the speed of this displacement controls the speed of somitogenesis progression along the antero-posterior (AP) axis (Goldbeter et al, ’07). This was verified by measuring the regression speed of the Msgn1 anterior boundary during somitogenesis in the zebrafish, chicken, mouse and corn snake, which was found to be similar to the speed of somite formation (Gomez et al, ’08). During embryogenesis, this gradient formation mechanism ensures a tight coordination between axis elongation and segmentation.
Changing the position of the determination front in the PSM can be achieved by changing the slope of the FGF and Wnt gradients. In the chicken and fish, this can be accomplished by inhibiting FGF signaling by treating embryos with the compound SU5402 (Dubrulle et al, ’01; Sawada et al, ’01) or by conditionally deleting the only FGF receptor expressed in the PSM (FGFR1) in mouse embryos (Wahl et al, ’07; Niwa et al, ’07). In both cases, it leads to the formation of larger somites. Conversely, implanting Fgf8- or Wnt3a-soaked beads in the posterior PSM or blocking retinoic acid (RA) signaling (which results in a FGF gain of function in the PSM) leads to the formation of smaller somites (Dubrulle et al, ’01; Aulehla et al, ’03; Diez del Corral et al, ’03; Maden et al, ’00; Vermot and Pourquie, ’05). Based on the clock and wavefront model previously described, the size of a segment is defined as the distance the determination front travels during one clock oscillation (Fig. 1b). Therefore, FGF inhibition, which results in shrinkage of the FGF gradient, leads to a posterior shift of the determination front position in the PSM, similar to a sudden acceleration of the determination front regression. Hence, more PSM cells pass the front during one clock oscillation, resulting in the formation of a larger somite (Sawada et al, ’01; Dubrulle et al, ’01; Baker et al, ’06). Inversely, FGF8-soaked beads increase the FGF concentration gradient, thus displacing the front position rostrally in the PSM as if the determination front was regressing very slowly, resulting in less available cells to form a somite between two consecutive signals of the clock (Sawada et al, ’01; Dubrulle et al, ’01). Hence, these experiments suggest that accelerating or decreasing the speed of the determination front regression can modulate somite size. Based on the model described, the same effects on somite size would be expected by either decreasing or accelerating the clock rate.
In conclusion, the determination front, in concert with the segmentation clock, controls the periodic formation of the somites along the AP axis of the embryo as well as somite size. As we will see below, this information can be used to hypothesize and to understand the control of somite numbers in vertebrates.
Control of somite number: axis growth
When considering the control of somite number, it is important to understand how axis elongation is regulated to reach a given length. In principle, one could imagine that the somite production continues as long as the PSM acts as a precursor reservoir. Hence, the number of somites will depend on the PSM lifetime during embryogenesis. The PSM lifetime is linked to PSM size and essentially depends on the balance between the speed of somitogenesis and the speed of axis elongation. If the speed of somitogenesis is faster than the speed of axis elongation, then the PSM will shrink until the wavefront catches up to the elongating tail bud, leading to the full segmentation of the PSM and presumably to somitogenesis arrest at PSM exhaustion (Fig. 2a). Conversely, if the speed of axis elongation is faster than or equal to the speed of somitogenesis, the PSM size will theoretically increase or remain steady and an indefinite number of segments will be added (Fig. 2b). The speed of somitogenesis progression essentially depends on the parameters that control the decay of the Wnt and FGF signals and on the proliferation rate in the tail bud. In contrast, the speed of axis elongation depends on the proliferation rate in the tail bud, but also on other still unknown parameters that control the posterior movement of the tail bud. Thus, independent modulation of parameters, such as FGF or Wnt effector stability or cell proliferation in the tail bud, is expected to impact the PSM lifetime and hence the total number of somites.
Fig. 2.

The ratio between the speed of somitogenesis and axis growth controls segment number. (a) Somitogenesis speed is faster than axis elongation speed, leading to the gradual shrinking of PSM size and ultimately to somitogenesis arrest. Shrinkage of the PSM brings the RA source (green) closer to the tail bud, gradually downregulating FGF/Wnt signals (purple) posteriorly. PSM, presomitic mesoderm; RA, retinoic acid. (b) Somitogenesis speed is equal to axis elongation speed, maintaining PSM size and theoretically leading to an infinite somite number. The top hatched line indicates the posterior displacement of somitogenesis and the bottom hatched line marks the regression of axis elongation. PSM, presomitic mesoderm; RA, retinoic acid.
The control of axis growth and PSM lifetime has been studied in the mouse, chicken, zebrafish and corn snake (Tam, ’81; Gomez et al, ’08). In zebrafish, the PSM size shrinks from the beginning until the end of somitogenesis. Mathematical modeling shows that in comparison to the chicken, mouse or snake, axis growth in fish involves a small number of cell generations in the PSM (defined here by the number of times the PSM doubles its cell number throughout somitogenesis), correlating with a small number of somites (32) compared to these three amniote species (Fig. 3) (Gomez et al, ’08). In contrast, in the mouse, chicken and corn snake, the PSM size first increases before it decreases, until the termination of somitogenesis. This behavior correlates with a higher number of calculated generations of PSM growth and an increased number of somites compared to zebrafish (Fig. 3). This suggests that the control of the PSM lifetime is a key aspect of the modulation of somite numbers among vertebrate species.
Fig. 3.

The number of segments varies independently of the number of cell generations required to produce the body axis. Horizontal bars schematically represent the number of cell generations required in the PSM to form the total segment number (delimited by vertical dashed lines) for each species (Gomez et al, ’08). Note that the number of generations in the snake is not much higher than in the mouse or chicken, highlighting the importance of the control of somite size in the control of segment number.
The PSM shrinkage process brings the tail bud in close proximity to the somites. However, termination of somitogenesis does not result only from exhaustion of PSM precursors, because in chicken embryos, a small strip of unsegmented PSM remains at the very tip of the tail after completion of somitogenesis (Bellairs, ’86). In chicken embryos, localized cell death occurs in the tail bud at the completion of somitogenesis, indicating that apoptosis could play a role in the termination of somitogenesis (Sanders et al, ’86; Schoenwolf, ’81). Tail buds from chicken embryos grafted to the chorio-allantoic membrane of nine-day-old host chicken embryos did not form more somites than they would have done if left undisturbed in the embryo, suggesting that the control of somite termination is intrinsic to the tip of the tail bud (Sanders et al, ’86). The potential of cells from “old tail buds” (at E13.5 in which somitogenesis had recently ceased) to contribute to somite formation was analyzed by heterochronic grafting in the primitive streak of younger mouse or chicken embryos (Tam and Tan, ’92; Cambray and Wilson, ’02; McGrew et al, ’08). The grafted cells contributed to somite formation, indicating that the arrest of somitogenesis is likely due to a change in the tissue surrounding the paraxial mesoderm precursors in the tail bud rather than an intrinsic loss of the ability of paraxial mesoderm precursors to contribute to somite formation.
A good candidate to trigger such a change is RA, which is produced in the embryo by the formed somites (Niederreither et al, ’97) and which forms a gradient antagonizing the FGF and Wnt gradients (Diez del Corral et al, ’03; Moreno and Kintner, ’04). Shrinkage of the PSM gradually brings the RA source closer to the tail bud, potentially downregulating the FGF and Wnt3a signals, which promotes axis growth (Fig. 2a) (Cambray and Wilson, ’07). In turn, this could trigger apoptosis in the tail bud, ultimately causing somitogenesis arrest. Indeed, administration of RA to mouse embryos at 9.5 days post-coitum (dpc) induces a downregulation of Wnt3a expression and causes axis truncation by inducing cell apoptosis in the tail bud (Shum et al, ’99). These axis truncations are similar to those observed in mice mutant for Wnt3a or its downstream effectors Lef-1 and Tcf-1, which cause severe axis truncation immediately following the forelimb level (Takada et al, ’94; Galceran et al, ’99). Interestingly, mice bearing the Wnt3a hypomorphic mutation vestigial tail (vt) are truncated at the tail level, whereas mice bearing the vt allele and the Wnt3a knockout allele exhibit a more severe truncation phenotype, forming a variable number of lumbar but not caudal vertebrae (Greco et al, ’96). These results clearly indicate a link between the amount of Wnt3a in the embryo tail bud and the number of somites ultimately present in the embryo. Wnt mutations also affect FGF signaling in the tail bud (Aulehla et al, ’08; Aulehla et al, ’03). In Xenopus laevis or zebrafish embryos, inhibition of FGF signaling causes axis truncation (Amaya et al, ’91; Griffin et al, ’95). FGF controls the expression of the Cytochrome P450 family enzyme Cyp26, which can degrade RA in the tail bud (Moreno and Kintner, ’04; Wahl et al, ’07). Cyp26-null mouse mutants show an extension of the RA signaling domain to the tip of the tail bud and exhibit axis truncation (Sakai et al, ’01; Abu-Abed et al, ’01). Finally, both the Wnt and FGF pathways have been shown to regulate the expression of the T-box genes (Brachyury/T/no tail and Tbx6) in vertebrates (Lou et al, ’06; Hofmann et al, ’04; Ciruna and Rossant, ’01; Yamaguchi et al, ’99). In agreement with these observations, mutations in these mesoderm-specific T-box genes cause similar truncation phenotypes as those observed in mutations in the FGF or Wnt pathways (Schulte-Merker et al, ’94; Herrmann et al, ’90; Chapman and Papaioannou, ’98; Wilson et al, ’95).
In conclusion, all of these experiments demonstrate that the molecules involved in positioning the determination front in the PSM also play a role in axis elongation. However, the fine regulation of the different PSM lifetimes among the vertebrate species remains an open question. The shrinkage of the PSM, which begins at the trunk-tail transition in amniotes, follows the slowing down of axis elongation (Gomez et al, ’08). While this has not been investigated in detail, the trunk-tail transition corresponds to the beginning of activation of the Hox genes from the Abdominal-B group in the tail bud (Izpisua-Belmonte et al, ’91; Burke et al, ’95; van der Hoeven et al, ’96). Hox genes have been involved in the control of cell proliferation (Duboule, ’95) and therefore, are good candidates to modulate axis growth. Further experiments will be necessary to validate these hypotheses.
Control of somite number: somite size
Elongated body plans with a large number of vertebrae are evident in a number of vertebrate clades. This transformation is observed in several fish, amphibian and reptile groups. In lizards and fish, evolution of elongated body plans accompanied by limb reduction has occurred independently several times (Ward and Brainerd, ’07; Wiens and Slingluff, ’01; Berger-Dell’Mour, ’85). The increase in segment number in elongated body species can occur at various levels along the body axis. For example, snakes have a large number of thoracic (between 100 and 200) and caudal (between 15 and 140) vertebrae, whereas other species, such as the extinct marine Plesiosaurus, had more than 70 cervical vertebrae (Narita and Kuratani, ’05). Intraspecific variations in the number of vertebrae (3% to 6% in snakes) are far less important than the interspecific variations (Polly et al, ’01). Studies of the evolution of vertebral formulae in fish or in snakes indicate that in most species, the increase in the total number of vertebrae involves a parallel increase in the trunk and tail regions rather than a specific expansion of a defined region (Polly et al, ’01; Ward and Brainerd, ’07). However, in some species of snakes and elongated fish, the number of pre- and post-cloacal/anal vertebrae has evolved independently, leading to the concept that these two regions might represent different developmental modules in which the number of segments is independently controlled (Polly et al, ’01; Ward and Brainerd, ’07).
Snakes can exhibit five times or more somites than the chicken or mouse and in amniotes, the PSM first increases in size and then begins to shrink until the completion of somitogenesis (Gomez et al, ’08). In principle, the dramatic increase in the number of somites in species such as snakes could be explained simply as a delay in the activation of the PSM shrinkage process. Such a delay would imply that axis growth is sustained for a much longer period, resulting in the production of many more generations of cells populating the PSM in snakes by comparison to the other amniotes. Modeling of the axis growth indicates that the number of PSM generations required to produce the snake embryonic axis is ~21, whereas 16 and 13 generations are required to produce the axis in the mouse and chicken, respectively (Fig. 3) (Gomez et al, ’08). Therefore, the difference in the number of generations involved in axis growth only partially accounts for the difference in segment numbers between the snake, chicken or mouse.
Measurement of the somite size in these three species demonstrates that snake somites are at least three times smaller than mouse or chicken somites (Gomez et al, ’08). As previously stated, production of smaller somites can result either from slowing down the determination front regression or from accelerating the segmentation clock pace. Comparing the determination front regression in the snake and other amniote embryos does not indicate significant differences among these species (Gomez et al, ’08). The time required to form a somite (which matches the segmentation clock period) was compared among different amniote species. In the corn snake, somites are produced every 100 min, a period very similar to that observed in chicken embryos (90 min). However, it is difficult to directly compare the somitogenesis period in these two species because of their strikingly different developmental rates. In the corn snake, the time from fertilization to hatching is three months compared to three weeks in the chicken. When comparing the time between conserved developmental landmarks between the corn snake and chicken, the development rate was at least three times slower in the corn snake when compared to the chicken embryo. Accordingly, the cell cycle is at least three times slower in the tail bud of snake embryos when compared to chicken embryos (Gomez et al, ’08). The whiptail lizard, which forms ~90 somites, develops over a similar period as the corn snake. In the tail bud, the whiptail lizard exhibits a cell-cycle time that is very similar to that of the corn snake but shows a much slower segmentation clock pace (4 hr) (Gomez et al, ’08). Therefore, these results indicate that the rate of somitogenesis in snake embryos is greatly accelerated relative to the axis growth rate compared to chicken and lizard embryos.
In the snake, examination of the stripes of expression of the cyclic gene Lunatic fringe (Lfng) indicates that up to nine dynamic stripes are formed compared to one to three stripes in fish, chicken or mouse embryos (Fig. 4). Mathematical modeling indicates that this increase in stripe number can be explained by an increased pace of the segmentation clock rate relative to the axis growth rate in snakes compared to other amniote species. Such an increase is predicted to generate more traveling waves, resulting in more stripes to be observed simultaneously in the PSM. This clock acceleration was proposed to account for the formation of the much larger number of smaller-sized somites in the snake (Gomez et al, ’08).
Fig. 4.
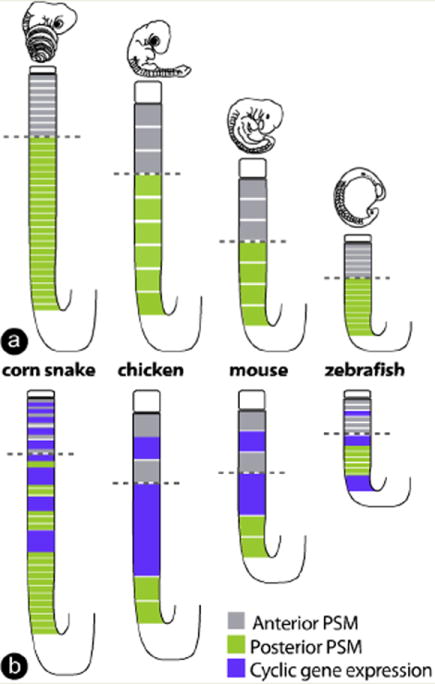
Acceleration of the segmentation clock pace relative to the growth rate in snake embryos. (a) Representation (to scale) of the corn snake, chicken, mouse and zebrafish PSM, as well as the last somite formed. Grey indicates the anterior PSM; green indicates the posterior PSM and the white lines in the PSM represent presumptive somites. Dashed, black horizontal lines indicate the determination front. PSM, presomitic mesoderm.(b) Same representation as in panel a, with the addition of the cyclic gene expression pattern (purple) as observed by in situ hybridizations in the different species. A higher number of cyclic gene stripes (purple) in the PSM correlates with a faster clock rate relative to the axis growth rate in snakes. PSM, presomitic mesoderm.
In the elongated snake-like lizard Anguis fragilis, the addition of somites proceeds faster and leads to the generation of a larger number of smaller segments when compared to the lizard species Lacerta viridis (Raynaud, ’94). These findings are consistent with an acceleration of the segmentation clock pace, similar to findings observed in snakes. In the mouse or zebrafish, no mutations have been described that would cause an increase in axis length or somite numbers, other than a few additional segments. An interesting study evaluating the quantitative trait loci (QTL) associated with an increase in the vertebral number between the wild boar and pig has resulted in the identification of one gene, NR6A1 (alias Germ cell nuclear factor [GCNF]), that is correlated with this phenotype (Mikawa et al, ’07). Mutations that accelerate the pacemaker of the segmentation clock would constitute a plausible explanation for the dramatic increase in the segment number observed in species such as snakes. Identifying the mutation(s) leading to the clock acceleration in snakes will provide tremendous insight into our understanding of the segmentation clock regulation and the mechanisms that control somite numbers.
Axis regionalization
The vertebrate body is partitioned into domains that exhibit different identities (e.g., cervical, thoracic, lumbar, sacral and caudal vertebrae). Within a given species, the number of each type of vertebrae (vertebral formula) is usually fixed. However, the number of vertebrae within each domain can vary greatly among different species. The acquisition of these identities is controlled by a class of genes called Hox genes (Krumlauf, ’94; Wellik, ’07), which are organized in clusters in the genome (Duboule, ’07). The position of the genes along a cluster reflects the order in which each gene will be expressed in time and space along the AP axis of the embryo (Kmita and Duboule, ’03). Hox genes code for transcription factors that are involved in controlling the timing of ingression of paraxial mesoderm precursors into the primitive streak (Iimura and Pourquie, ’06). Thus, precursors expressing more 5’ Hox genes will ingress later than those expressing more 3’ Hox genes and, hence will be positioned more posteriorly along the AP axis. It was proposed that this mechanism results in a collinear or nested arrangement of the expression domain of these genes along the AP axis (Iimura and Pourquie, ’07), defining a specific combination of genes expressed in each somite (Kessel and Gruss, ’91). This combination of Hox genes, which is established at each somite level, is involved in controlling the specification of vertebral identities ((Kessel and Gruss, ’91; Carapuco et al, ’05; Deschamps and van Nes, ’05; Wellik, ’07) and reference therein). Hox gene expression domains often extend from their anterior expression limit in the somites to the posterior end of the embryo, but their action is essentially restricted to their anterior-most expression domain. Thus, the identity of a segment is controlled by the posterior-most Hox genes expressed in this segment—a property termed posterior prevalence in vertebrates (Duboule and Morata, ’94; Burke et al, ’95). Therefore, a shift in Hox gene expression can change the number of somites harboring a given identity and, hence change the vertebral formula (Krumlauf, ’94; Wellik and Capecchi, ’03; Carapuco et al, ’05). One extreme example is evident in pythons, where a shift in Hox gene expression along the AP axis has been proposed to account for the increased number of thoracic vertebrae and the absence of forelimbs (Cohn and Tickle, ’99).
Fate mapping experiments in the chicken embryo indicate a dual origin for paraxial mesoderm cells, which is likely conserved across vertebrates (Iimura et al, ’07; Cambray and Wilson, ’07). The lateral part of a somite is derived from the epiblast in and adjacent to the primitive streak (Iimura et al, ’07) and gives rise to the hypaxial muscles of the limb and body wall (Ordahl and Le Douarin, ’92), whereas the medial part of a somite is produced from a population of stem cells located in the anterior primitive streak (Selleck and Stern, ’91; Psychoyos and Stern, ’96; Iimura et al, ’07), giving rise to the segmented derivatives such as the vertebral column and the epaxial muscles, as well as the dermis of the back (Ordahl and Le Douarin, ’92) (Fig. 5). The precursors of the medial somites control the segmentation process and impose their segmental pattern on the lateral somite (Freitas et al, ’01). In the chicken embryo, Hox gene expression is initiated in lateral somite precursors in the epiblast prior to their ingression into the primitive streak (Fig. 5) (Iimura and Pourquie, ’06). Thus, Hox identity is first acquired in the lateral somite precursors and then by the medial somite precursors, which lie at the level of the anterior primitive streak. Therefore, we propose that the spatial dissociation of the Hox activation from the segmentation patterning process can allow their independent regulation, and hence potentially account for the extraordinary diversity of vertebral formulae observed in vertebrates.
Fig. 5.

Hox gene activation and segmentation patterning activities are controlled in independent populations of paraxial cell precursors. (a) Schematic representation of a chicken embryo at Hamburger and Hamilton stage 7 (HH7) (Hamburger and Hamilton, ’92). The PSM is generated by two populations of cells: one originating from the epiblast lateral to the primitive streak (purple) and generating the lateral PSM, and one originating from the anterior streak/node (orange) and generating the medial PSM. Hox genes are first activated in the population of cells generating the lateral PSM (stippled purple), whereas segmentation is controlled by the descendants of the anterior streak/node cells (orange) generating the medial PSM (stippled orange). PSM, presomitic mesoderm. (b) Cells derived from the lateral epiblast contribute to the lateral somite (purple), whereas descendants from the anterior streak/node form the medial somite (orange). (c) The lateral somite gives rise to the hypaxial muscles (purple); whereas the medial somite produces the axial skeleton, the epaxial muscles and the dermis of the back (orange).
Acknowledgments
The authors thank members of the Pourquié lab and Jacqueline Deschamps for discussion and comments, Joanne Chatfield for editorial assistance and Silvia Esteban for artwork. Research was supported by Stowers Institute for Medical Research. O.P. is a Howard Hughes Medical Institute Investigator.
LITERATURE CITED
- Abu-Abed S, Dolle P, Metzger D, Beckett B, Chambon P, Petkovich M. The retinoic acid-metabolizing enzyme, CYP26A1, is essential for normal hindbrain patterning, vertebral identity, and development of posterior structures. Genes Dev. 2001;15:226–240. doi: 10.1101/gad.855001. [DOI] [PMC free article] [PubMed] [Google Scholar]
- Amaya E, Musci TJ, Kirschner MW. Expression of a dominant negative mutant of the FGF receptor disrupts mesoderm formation in Xenopus embryos. Cell. 1991;66(2):257–270. doi: 10.1016/0092-8674(91)90616-7. [DOI] [PubMed] [Google Scholar]
- Aulehla A, Herrmann BG. Segmentation in vertebrates: clock and gradient finally joined. Genes Dev. 2004;18:2060–2067. doi: 10.1101/gad.1217404. [DOI] [PubMed] [Google Scholar]
- Aulehla A, Wehrle C, Brand-Saberi B, Kemler R, Gossler A, Kanzler B, Herrmann BG. Wnt3a plays a major role in the segmentation clock controlling somitogenesis. Dev Cell. 2003;4(3):395–406. doi: 10.1016/s1534-5807(03)00055-8. [DOI] [PubMed] [Google Scholar]
- Aulehla A, Wiegraebe W, Baubet V, Wahl MB, Deng C, Taketo M, Lewandoski M, Pourquie O. A beta-catenin gradient links the clock and wavefront systems in mouse embryo segmentation. Nat Cell Biol. 2008;10(2):186–193. doi: 10.1038/ncb1679. [DOI] [PMC free article] [PubMed] [Google Scholar]
- Baker RE, Schnell S, Maini PK. A clock and wavefront mechanism for somite formation. Dev Biol. 2006;293(1):116–126. doi: 10.1016/j.ydbio.2006.01.018. [DOI] [PubMed] [Google Scholar]
- Bellairs R. The tail bud and cessation of segmentation in the chick embryo. In: Bellairs E, Lash, editors. Somitogenesis in Developing embryos. New York and London: Plenum Press; 1986. pp. 161–178. [Google Scholar]
- Berger-Dell’Mour HAE. The lizard genus Tetradactylus: a model case of an evolutionary process. In: Schuchmann KL, editor. Proceedings of the international symposium on African Vertebrates: Systematics, phylogeny and evolutionary ecology. Bonn: Selbstverlag; 1985. pp. 495–510. [Google Scholar]
- Brent AE, Tabin CJ. Developmental regulation of somite derivatives: muscle, cartilage and tendon. Curr Opin Genet Dev. 2002;12(5):548–557. doi: 10.1016/s0959-437x(02)00339-8. [DOI] [PubMed] [Google Scholar]
- Buchberger A, Bonneick S, Arnold H. Expression of the novel basic-helix-loop-helix transcription factor cMespo in presomitic mesoderm of chicken embryos. Mech Dev. 2000;97(1-2):223–226. doi: 10.1016/s0925-4773(00)00424-x. [DOI] [PubMed] [Google Scholar]
- Burke AC, Nelson CE, Morgan BA, Tabin C. Hox genes and the evolution of vertebrate axial morphology. Development. 1995;121(2):333–346. doi: 10.1242/dev.121.2.333. [DOI] [PubMed] [Google Scholar]
- Cambray N, Wilson V. Axial progenitors with extensive potency are localised to the mouse chordoneural hinge. Development. 2002;129(20):4855–4866. doi: 10.1242/dev.129.20.4855. [DOI] [PubMed] [Google Scholar]
- Cambray N, Wilson V. Two distinct sources for a population of maturing axial progenitors. Development. 2007;134(15):2829–2840. doi: 10.1242/dev.02877. [DOI] [PubMed] [Google Scholar]
- Carapuco M, Novoa A, Bobola N, Mallo M. Hox genes specify vertebral types in the presomitic mesoderm. Genes Dev. 2005;19(18):2116–2121. doi: 10.1101/gad.338705. [DOI] [PMC free article] [PubMed] [Google Scholar]
- Catala M, Teillet MA, Le Douarin NM. Organization and development of the tail bud analyzed with the quail- chick chimaera system. MechDev. 1995;51:51–65. doi: 10.1016/0925-4773(95)00350-a. [DOI] [PubMed] [Google Scholar]
- Chapman DL, Papaioannou VE. Three neural tubes in mouse embryos with mutations in the T-box gene Tbx6. Nature. 1998;391(6668):695–697. doi: 10.1038/35624. [DOI] [PubMed] [Google Scholar]
- Christ B, Huang R, Scaal M. Amniote somite derivatives. Dev Dyn. 2007 doi: 10.1002/dvdy.21189. [DOI] [PubMed] [Google Scholar]
- Ciruna B, Rossant J. FGF signaling regulates mesoderm cell fate specification and morphogenetic movement at the primitive streak. Dev Cell. 2001;1(1):37–49. doi: 10.1016/s1534-5807(01)00017-x. [DOI] [PubMed] [Google Scholar]
- Cohn MJ, Tickle C. Developmental basis of limblessness and axial patterning in snakes. Nature. 1999;399(6735):474–479. doi: 10.1038/20944. [DOI] [PubMed] [Google Scholar]
- Cooke J, Zeeman EC. A clock and wavefront model for control of the number of repeated structures during animal morphogenesis. J Theor Biol. 1976;58:455–476. doi: 10.1016/s0022-5193(76)80131-2. [DOI] [PubMed] [Google Scholar]
- Delfini MC, Dubrulle J, Malapert P, Chal J, Pourquie O. Control of the segmentation process by graded MAPK/ERK activation in the chick embryo. Proc Natl Acad Sci USA. 2005;102:11343–11348. doi: 10.1073/pnas.0502933102. [DOI] [PMC free article] [PubMed] [Google Scholar]
- Dequeant ML, Pourquie O. Segmental patterning of the vertebrate embryonic axis. Nat Rev Genet. 2008;9(5):370–382. doi: 10.1038/nrg2320. [DOI] [PubMed] [Google Scholar]
- Deschamps J, van Nes J. Developmental regulation of the Hox genes during axial morphogenesis in the mouse. Development. 2005;132:2931–2942. doi: 10.1242/dev.01897. [DOI] [PubMed] [Google Scholar]
- Diez del Corral R, Olivera-Martinez I, Goriely A, Gale E, Maden M, Storey K. Opposing FGF and retinoid pathways control ventral neural pattern, neuronal differentiation, and segmentation during body axis extension. Neuron. 2003;40(1):65–79. doi: 10.1016/s0896-6273(03)00565-8. [DOI] [PubMed] [Google Scholar]
- Duboule D. Vertebrate Hox genes and proliferation: an alternative pathway to homeosis? Curr Opin Genet Dev. 1995;5(4):525–528. doi: 10.1016/0959-437x(95)90058-o. [DOI] [PubMed] [Google Scholar]
- Duboule D. The rise and fall of Hox gene clusters. Development. 2007;134(14):2549–2560. doi: 10.1242/dev.001065. [DOI] [PubMed] [Google Scholar]
- Duboule D, Morata G. Colinearity and functional hierarchy among genes of the homeotic complexes. Trends Genet. 1994;10(10):358–364. doi: 10.1016/0168-9525(94)90132-5. [DOI] [PubMed] [Google Scholar]
- Dubrulle J, McGrew MJ, Pourquie O. FGF signaling controls somite boundary position and regulates segmentation clock control of spatiotemporal Hox gene activation. Cell. 2001;106(2):219–232. doi: 10.1016/s0092-8674(01)00437-8. [DOI] [PubMed] [Google Scholar]
- Dubrulle J, Pourquie O. fgf8 mRNA decay establishes a gradient that couples axial elongation to patterning in the vertebrate embryo. Nature. 2004;427(6973):419–422. doi: 10.1038/nature02216. [DOI] [PubMed] [Google Scholar]
- Elsdale T, Pearson M, Whitehead M. Abnormalities in somite segmentation following heat shock to Xenopus embryos. J Embryol Exp Morphol. 1976;35(3):625–635. [PubMed] [Google Scholar]
- Freitas C, Rodrigues S, Charrier JB, Teillet MA, Palmeirim I. Evidence for medial/lateral specification and positional information within the presomitic mesoderm. Development. 2001;128(24):5139–5147. doi: 10.1242/dev.128.24.5139. [DOI] [PubMed] [Google Scholar]
- Galceran J, Farinas I, Depew MJ, Clevers H, Grosschedl R. Wnt3a-/--like phenotype and limb deficiency in Lef1(-/-)Tcf1(-/-) mice. Genes Dev. 1999;13(6):709–717. doi: 10.1101/gad.13.6.709. [DOI] [PMC free article] [PubMed] [Google Scholar]
- Goldbeter A, Gonze D, Pourquie O. Sharp developmental thresholds defined through bistability by antagonistic gradients of retinoic acid and FGF signaling. Dev Dyn. 2007;236(6):1495–1508. doi: 10.1002/dvdy.21193. [DOI] [PubMed] [Google Scholar]
- Gomez C, Ozbudak EM, Wunderlich J, Baumann D, Lewis J, Pourquie O. Control of segment number in vertebrate embryos. Nature. 2008;454(7202):335–339. doi: 10.1038/nature07020. [DOI] [PubMed] [Google Scholar]
- Gont LK, Steinbeisser H, Blumberg B, de Robertis EM. Tail formation as a continuation of gastrulation: the multiple cell populations of the Xenopus tailbud derive from the late blastopore lip. Development. 1993;119:991–1004. doi: 10.1242/dev.119.4.991. [DOI] [PubMed] [Google Scholar]
- Greco TL, Takada S, Newhouse MM, McMahon JA, McMahon AP, Camper SA. Analysis of the vestigial tail mutation demonstrates that Wnt-3a gene dosage regulates mouse axial development. Genes Dev. 1996;10(3):313–324. doi: 10.1101/gad.10.3.313. [DOI] [PubMed] [Google Scholar]
- Griffin K, Patient R, Holder N. Analysis of FGF function in normal and no tail zebrafish embryos reveals separate mechanisms for formation of the trunk and the tail. Development. 1995;121(9):2983–2994. doi: 10.1242/dev.121.9.2983. [DOI] [PubMed] [Google Scholar]
- Hamburger V, Hamilton HL. A series of normal stages in the development of the chick embryo (1951) DevDyn. 1992;195:231–272. doi: 10.1002/aja.1001950404. [DOI] [PubMed] [Google Scholar]
- Herrmann BG, Labeit S, Poustka A, King TR, Lehrach H. Cloning of the T gene required in mesoderm formation in the mouse. Nature. 1990;343(6259):617–622. doi: 10.1038/343617a0. [DOI] [PubMed] [Google Scholar]
- Hirsinger E, Jouve C, Dubrulle J, Pourquie O. Somite formation and patterning. Int Rev Cytol. 2000;198:1–65. doi: 10.1016/s0074-7696(00)98002-1. [DOI] [PubMed] [Google Scholar]
- Hofmann M, Schuster-Gossler K, Watabe-Rudolph M, Aulehla A, Herrmann BG, Gossler A. WNT signaling, in synergy with T/TBX6, controls Notch signaling by regulating Dll1 expression in the presomitic mesoderm of mouse embryos. Genes Dev. 2004;18:2712–2717. doi: 10.1101/gad.1248604. [DOI] [PMC free article] [PubMed] [Google Scholar]
- Iimura T, Pourquie O. Collinear activation of Hoxb genes during gastrulation is linked to mesoderm cell ingression. Nature. 2006;442:568–571. doi: 10.1038/nature04838. [DOI] [PubMed] [Google Scholar]
- Iimura T, Pourquie O. Hox genes in time and space during vertebrate body formation. Development, growth & differentiation. 2007;49(4):265–275. doi: 10.1111/j.1440-169X.2007.00928.x. [DOI] [PubMed] [Google Scholar]
- Iimura T, Yang X, Weijer CJ, Pourquie O. Dual mode of paraxial mesoderm formation during chick gastrulation. Proc Natl Acad Sci USA. 2007;104(8):2744–2749. doi: 10.1073/pnas.0610997104. [DOI] [PMC free article] [PubMed] [Google Scholar]
- Izpisua-Belmonte JC, Falkenstein H, Dolle P, Renucci A, Duboule D. Murine genes related to the Drosophila AbdB homeotic genes are sequentially expressed during development of the posterior part of the body. Embo J. 1991;10(8):2279–2289. doi: 10.1002/j.1460-2075.1991.tb07764.x. [DOI] [PMC free article] [PubMed] [Google Scholar]
- Kanki JP, Ho RK. The development of the posterior body in zebrafish. Development. 1997;124(4):881–893. doi: 10.1242/dev.124.4.881. [DOI] [PubMed] [Google Scholar]
- Kessel M, Gruss P. Homeotic transformations of murine vertebrae and concomitant alteration of Hox codes induced by retinoic acid. Cell. 1991;67:89–104. doi: 10.1016/0092-8674(91)90574-i. [DOI] [PubMed] [Google Scholar]
- Kimelman D, Griffin KJ. Vertebrate mesendoderm induction and patterning. Curr Opin Genet Dev. 2000;10(4):350–356. doi: 10.1016/s0959-437x(00)00095-2. [DOI] [PubMed] [Google Scholar]
- Kmita M, Duboule D. Organizing axes in time and space; 25 years of colinear tinkering. Science. 2003;301:331–333. doi: 10.1126/science.1085753. [DOI] [PubMed] [Google Scholar]
- Krumlauf R. Hox genes in vertebrate development. Cell. 1994;78(2):191–201. doi: 10.1016/0092-8674(94)90290-9. [DOI] [PubMed] [Google Scholar]
- Lou X, Fang P, Li S, Hu RY, Kuerner KM, Steinbeisser H, Ding X. Xenopus Tbx6 mediates posterior patterning via activation of Wnt and FGF signalling. Cell research. 2006;16(9):771–779. doi: 10.1038/sj.cr.7310093. [DOI] [PubMed] [Google Scholar]
- Maden M, Graham A, Zile M, Gale E. Abnormalities of somite development in the absence of retinoic acid. Int J Dev Biol. 2000;44(1):151–159. [PubMed] [Google Scholar]
- McGrew MJ, Sherman A, Lillico SG, Ellard FM, Radcliffe PA, Gilhooley HJ, Mitrophanous KA, Cambray N, Wilson V, Sang H. Localised axial progenitor cell populations in the avian tail bud are not committed to a posterior Hox identity. Development. 2008;135(13):2289–2299. doi: 10.1242/dev.022020. [DOI] [PubMed] [Google Scholar]
- Mikawa S, Morozumi T, Shimanuki S, Hayashi T, Uenishi H, Domukai M, Okumura N, Awata T. Fine mapping of a swine quantitative trait locus for number of vertebrae and analysis of an orphan nuclear receptor, germ cell nuclear factor (NR6A1) Genome Res. 2007;17(5):586–593. doi: 10.1101/gr.6085507. [DOI] [PMC free article] [PubMed] [Google Scholar]
- Moreno TA, Kintner C. Regulation of segmental patterning by retinoic acid signaling during Xenopus somitogenesis. Dev Cell. 2004;6(2):205–218. doi: 10.1016/s1534-5807(04)00026-7. [DOI] [PubMed] [Google Scholar]
- Morimoto M, Takahashi Y, Endo M, Saga Y. The Mesp2 transcription factor establishes segmental borders by suppressing Notch activity. Nature. 2005;435:354–359. doi: 10.1038/nature03591. [DOI] [PubMed] [Google Scholar]
- Narita Y, Kuratani S. Evolution of the vertebral formulae in mammals: a perspective on developmental constraints. Journal of experimental zoology Part B. 2005;304(2):91–106. doi: 10.1002/jez.b.21029. [DOI] [PubMed] [Google Scholar]
- Niederreither K, McCaffery P, Drager UC, Chambon P, Dolle P. Restricted expression and retinoic acid-induced downregulation of the retinaldehyde dehydrogenase type 2 (RALDH-2) gene during mouse development. Mech Dev. 1997;62(1):67–78. doi: 10.1016/s0925-4773(96)00653-3. [DOI] [PubMed] [Google Scholar]
- Niwa Y, Masamizu Y, Liu T, Nakayama R, Deng CX, Kageyama R. The initiation and propagation of Hes7 oscillation are cooperatively regulated by Fgf and notch signaling in the somite segmentation clock. Dev Cell. 2007;13(2):298–304. doi: 10.1016/j.devcel.2007.07.013. [DOI] [PubMed] [Google Scholar]
- Ordahl CP, Le Douarin NM. Two myogenic lineages within the developing somite. Development. 1992;114:339–353. doi: 10.1242/dev.114.2.339. [DOI] [PubMed] [Google Scholar]
- Palmeirim I, Henrique D, Ish-Horowicz D, Pourquié O. Avian hairy gene expression identifies a molecular clock linked to vertebrate segmentation and somitogenesis. Cell. 1997;91:639–648. doi: 10.1016/s0092-8674(00)80451-1. [DOI] [PubMed] [Google Scholar]
- Polly PD, Head JJ, Cohn MJ. Testing modularity and dissociation: the evolution of regional proportions in snakes. In: Zelditch M, editor. Beyond heterochrony : the evolution of development. New York: Wiley-Liss; 2001. pp. 305–335. [Google Scholar]
- Pourquie O, Tam PP. A nomenclature for prospective somites and phases of cyclic gene expression in the presomitic mesoderm. Dev Cell. 2001;1(5):619–620. doi: 10.1016/s1534-5807(01)00082-x. [DOI] [PubMed] [Google Scholar]
- Psychoyos D, Stern CD. Fates and migratory routes of primitive streak cells in the chick embryo. Development. 1996;122:1523–1534. doi: 10.1242/dev.122.5.1523. [DOI] [PubMed] [Google Scholar]
- Raynaud A. Bull Soc Hist Nat. Vol. 130. Toulouse: 1994. Données préliminaires sur l’allongement du corps et la somitogenèse chez les jeunes embryons d’orvet (Anguis fragilis, L.) et de lézart vert (Lacerta virodos. Laur.) pp. 47–52. [Google Scholar]
- Romanoff A. The Avian Embryo : Structural and Functional Development. New York: The Macmillan Company; 1960. pp. 1–677. [Google Scholar]
- Sakai Y, Meno C, Fujii H, Nishino J, Shiratori H, Saijoh Y, Rossant J, Hamada H. The retinoic acid-inactivating enzyme CYP26 is essential for establishing an uneven distribution of retinoic acid along the anterio-posterior axis within the mouse embryo. Genes Dev. 2001;15(2):213–225. doi: 10.1101/gad.851501. [DOI] [PMC free article] [PubMed] [Google Scholar]
- Sanders EJ, Khare MK, Ooi VC, Bellairs R. An experimental and morphological analysis of the tail bud mesenchyme of the chick embryo. Anat Embryol (Berl) 1986;174(2):179–185. doi: 10.1007/BF00824333. [DOI] [PubMed] [Google Scholar]
- Sawada A, Shinya M, Jiang YJ, Kawakami A, Kuroiwa A, Takeda H. Fgf/MAPK signalling is a crucial positional cue in somite boundary formation. Development. 2001;128(23):4873–4880. doi: 10.1242/dev.128.23.4873. [DOI] [PubMed] [Google Scholar]
- Schoenwolf GC. Morphogenetic processes involved in the remodeling of the tail region of the chick embryo. Anat Embryol. 1981;162(2):183–197. doi: 10.1007/BF00306490. [DOI] [PubMed] [Google Scholar]
- Schroter C, Herrgen L, Cardona A, Brouhard GJ, Feldman B, Oates AC. Dynamics of zebrafish somitogenesis. Dev Dyn. 2008;237(3):545–553. doi: 10.1002/dvdy.21458. [DOI] [PubMed] [Google Scholar]
- Schulte-Merker S, van Eeden FJ, Halpern ME, Kimmel CB, Nusslein-Volhard C. no tail (ntl) is the zebrafish homologue of the mouse T (Brachyury) gene. Development. 1994;120:1009–1015. doi: 10.1242/dev.120.4.1009. [DOI] [PubMed] [Google Scholar]
- Selleck MA, Stern CD. Fate mapping and cell lineage analysis of Hensen’s node in the chick embryo. Development. 1991;112:615–626. doi: 10.1242/dev.112.2.615. [DOI] [PubMed] [Google Scholar]
- Shum AS, Poon LL, Tang WW, Koide T, Chan BW, Leung YC, Shiroishi T, Copp AJ. Retinoic acid induces down-regulation of Wnt-3a, apoptosis and diversion of tail bud cells to a neural fate in the mouse embryo. Mech Dev. 1999;84(1-2):17–30. doi: 10.1016/s0925-4773(99)00059-3. [DOI] [PubMed] [Google Scholar]
- Takada S, Stark KL, Shea MJ, Vassileva G, McMahon JA, McMahon AP. Wnt-3a regulates somite and tailbud formation in the mouse embryo. Genes Dev. 1994;8:174–189. doi: 10.1101/gad.8.2.174. [DOI] [PubMed] [Google Scholar]
- Tam PP. The control of somitogenesis in mouse embryos. J Embryol Exp Morphol. 1981;65 Suppl:103–128. [PubMed] [Google Scholar]
- Tam PP, Tan SS. The somitogenetic potential of cells in the primitive streak and the tail bud of the organogenesis-stage mouse embryo. Development. 1992;115:703–715. doi: 10.1242/dev.115.3.703. [DOI] [PubMed] [Google Scholar]
- Tucker AS, Slack JM. Tail bud determination in the vertebrate embryo. Curr Biol. 1995;5(7):807–813. doi: 10.1016/s0960-9822(95)00158-8. [DOI] [PubMed] [Google Scholar]
- Turnpenny PD, Alman B, Cornier AS, Giampietro PF, Offiah A, Tassy O, Pourquie O, Kusumi K, Dunwoodie S. Abnormal vertebral segmentation and the notch signaling pathway in man. Dev Dyn. 2007;236(6):1456–1474. doi: 10.1002/dvdy.21182. [DOI] [PubMed] [Google Scholar]
- van der Hoeven F, Sordino P, Fraudeau N, Izpisua-Belmonte JC, Duboule D. Teleost HoxD and HoxA genes: comparison with tetrapods and functional evolution of the HOXD complex. Mech Dev. 1996;54(1):9–21. doi: 10.1016/0925-4773(95)00455-6. [DOI] [PubMed] [Google Scholar]
- Vermot J, Pourquie O. Retinoic acid coordinates somitogenesis and left-right patterning in vertebrate embryos. Nature. 2005;435:215–220. doi: 10.1038/nature03488. [DOI] [PubMed] [Google Scholar]
- Wahl MB, Deng C, Lewandoski M, Pourquie O. FGF signaling acts upstream of the NOTCH and WNT signaling pathways to control segmentation clock oscillations in mouse somitogenesis. Development. 2007;134(22):4033–4041. doi: 10.1242/dev.009167. [DOI] [PubMed] [Google Scholar]
- Ward AB, Brainerd EL. Evolution of axial patterning in elongate fishes. Biological Journal of the Linnean Society. 2007;90:97–116. [Google Scholar]
- Wellik DM. Hox patterning of the vertebrate axial skeleton. Dev Dyn. 2007;236(9):2454–2463. doi: 10.1002/dvdy.21286. [DOI] [PubMed] [Google Scholar]
- Wellik DM, Capecchi MR. Hox10 and Hox11 genes are required to globally pattern the mammalian skeleton. Science. 2003;301:363–367. doi: 10.1126/science.1085672. [DOI] [PubMed] [Google Scholar]
- Wiens JJ, Slingluff JL. How lizards turn into snakes: a phylogenetic analysis of body-form evolution in anguid lizards. Evolution; international journal of organic evolution. 2001;55(11):2303–2318. doi: 10.1111/j.0014-3820.2001.tb00744.x. [DOI] [PubMed] [Google Scholar]
- Wilson V, Manson L, Skarnes WC, Beddington RS. The T gene is necessary for normal mesodermal morphogenetic cell movements during gastrulation. Development. 1995;121(3):877–886. doi: 10.1242/dev.121.3.877. [DOI] [PubMed] [Google Scholar]
- Yamaguchi TP, Takada S, Yoshikawa Y, Wu N, McMahon AP. T (Brachyury) is a direct target of Wnt3a during paraxial mesoderm specification. Genes Dev. 1999;13(24):3185–3190. doi: 10.1101/gad.13.24.3185. [DOI] [PMC free article] [PubMed] [Google Scholar]
- Yoon JK, Moon RT, Wold B. The bHLH class protein pMesogenin1 can specify paraxial mesoderm phenotypes. Dev Biol. 2000;222(2):376–391. doi: 10.1006/dbio.2000.9717. [DOI] [PubMed] [Google Scholar]